 Huizhi Jiang1,2†
 Weixuan Chen1,2†
 Wujun Jiang3
 Feng Liu3
 Xiaobo Wu1,2
 Weiyu Yan1,2
 Xujiang He1,2*
 Zhijiang Zeng1,2*
- 1Honeybee Research Institute, Jiangxi Agricultural University, Nanchang, China
- 2Jiangxi Province Key Laboratory of Honeybee Biology and Beekeeping, Nanchang, China
- 3Apiculture Research Institute of Jiangxi Province, Nanchang, China
Honey, a key beekeeping product, is rich in antioxidants and bioactive compounds, offering antimicrobial, anti-inflammatory and health-promoting properties. The water content of honey is directly correlated with its quality. However, Triadica cochinchinensis honey (TCH), produced in high humidity regions, is frequently at risk of fermentation and spoilage due to excessive water content. A dewatering method using an automated, temperature- and humidity-controlled honey cabinet was applied to address this issue and investigate its effects on TCH. After 96 h of treatment, the water content of TCH capped honeycombs effectively reduced to below 18%. Meanwhile, most physicochemical parameters, volatile compounds and chemical compositions largely remained unchanged, thereby preserving their nutritional value and flavor. Moreover, phenolics and flavonoids levels significantly increased by 15.83 and 25.42%, respectively, thereby enhancing the honey’s antioxidant capacity. Our results indicated that this method can significantly enhance maturity and improve the quality of TCH, providing reference value for other honey produced in high humidity regions. The utilization of honey cabinets can enhance the market value of honey in these regions, and consumers can benefit from higher-quality honey with greater biological activity.
1 Introduction
Honey, a sweet food, is collected by worker bees from the nectar or plant secretions, which is subsequently processed and stored in honeycombs (1, 2). It is a rich source of natural antioxidants and exhibits various beneficial properties, including antioxidant (3) antibacterial (4), and anti-inflammatory effects (5). Composed primarily of glucose and fructose, honey contains sugars that are easily absorbed by the human body (6). In addition, honey is packed with enzymes, vitamins, trace elements, and organic acids, contributing to its significant nutritional value (7).
Antioxidant capacity is one of the most important properties of honey (8). It depends on concentration, botanical source, geographical origin, processing methods and storage conditions (9, 10). Phenolic compounds, mainly responsible for honey’s antioxidant properties, are secondary metabolites produced by plants and transferred to honey through bee foraging (11, 12). The phenolic compounds in honey mainly consist of flavonoids and phenolic acids (13). Additionally, amino acids, antioxidant enzymes, and vitamins in honey also contribute to its antioxidant capacity (14).
The water content of honey is a key factor in determining its physicochemical properties, affecting its quality, storage stability, crystallization, and viscosity (15). Several factors influence honey’s water content, including the type of nectar source, bee species, colony conditions, honey production duration, and environmental temperature and humidity during the nectar flow period, as well as storage methods (16). For instance, in regions with high humidity, such as Southern China and tropical countries, the water content of capped honey can range from 22 to 23% (17, 18). If honey is extracted directly without proper processing, the excessive water content may lead to fermentation, spoilage, flavor degradation, phase separation, and ultimately compromise both the quality and safety of honey for consumption (19, 20). The standard in China specifies a maximum water content of 18% for mature honey and 20% for regular honey. The lower water content effectively inhibits yeast growth and extends storage life (21, 22).
Triadica cochinchinensis is one of the primary nectar sources in southern China, with its flowering period occurring from June to July and characterized by large nectar secretion (Figure 1A) (23). Triadica cochinchinensis honey (TCH) has the highest production in southern China during summer, and each colony (Apis mellifera) can produce 20 to 30 kilograms of TCH (Figure 1B) (24). Previous studies have shown that TCH is notably rich in iron and zinc, exhibits naturally low diastase activity and possesses the ability to alleviate alcoholic liver damage and anti-aging properties (25–27). (−)-Gallocatechin gallate is a characteristic marker to identify TCH, which belongs to flavonoids and exhibits antioxidant properties (18). The southern regions of China have typical subtropical monsoon climate, featuring hot and rainy summers (28). Due to the high humidity levels in the production environment, TCH tends to have a relatively high water content (> 22%) after being capped, and most of it is immature. This not only makes it easy to ferment and spoilage but also leads to coarse crystallization—a defect in which sugars form large, gritty crystals. Crystallization compromises its texture and consumer acceptability and ultimately resulted in a low selling price for TCH and reduced income for beekeepers (29, 30). Over time, there has been a huge negative impact on the regional economy because of the difficulty in marketing low quality TCH.
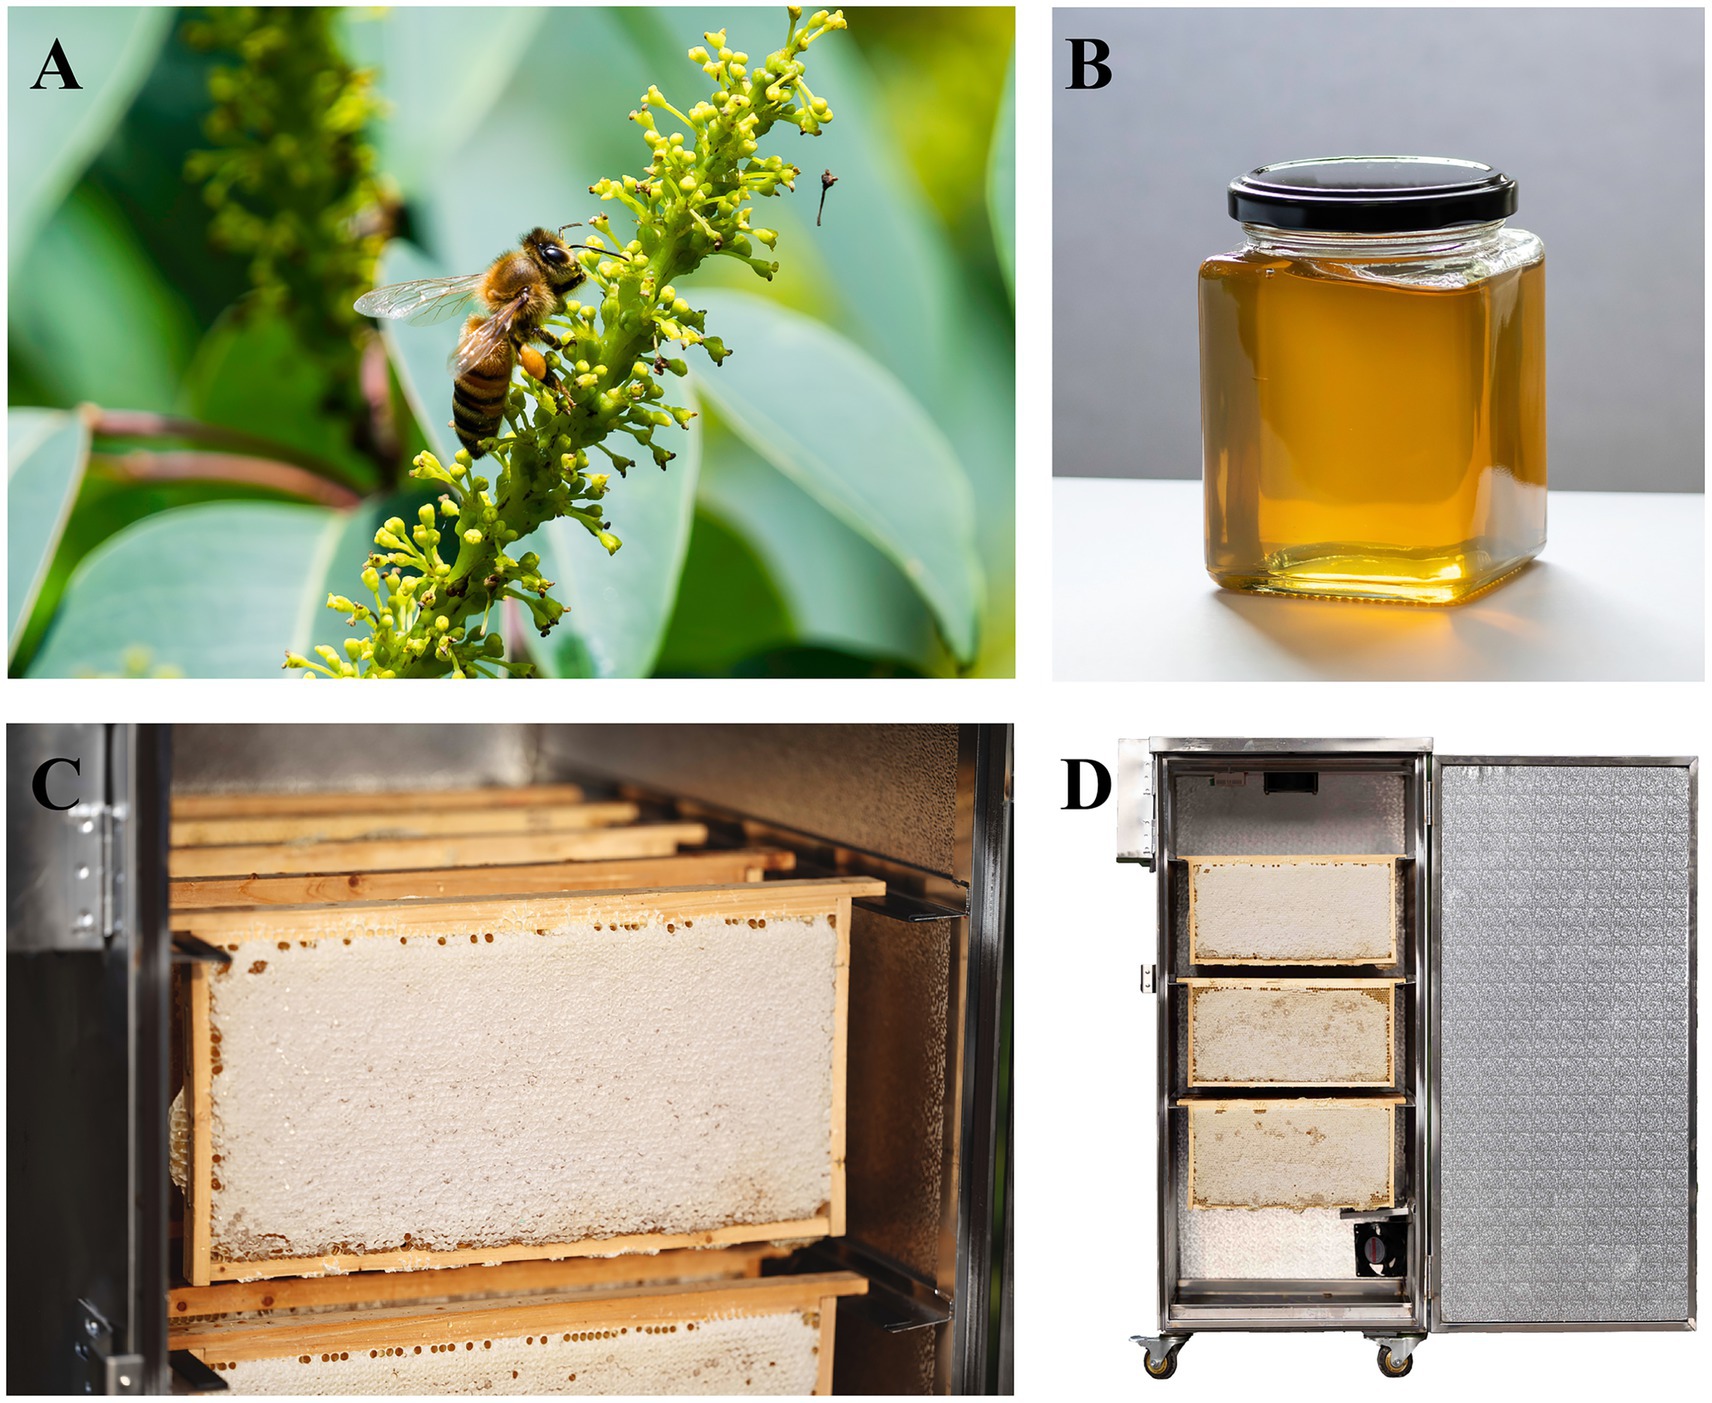
Figure 1. The botanical original analysis of Triadica cochinchinensis monofloral honey (TCH) and running operation of honey cabinet. (A) Honeybee visited T. cochinchinensis flower. (B) View of TCH. (C) The capped honeycombs of TCH in the honey cabinet. (D) Physical map of honey cabinet. Dimensions: 1.2 m (W) × 0.8 m (D) × 1.6 m (H). Capacity: 15 honeycombs (40 × 25 cm each).
Several methods are employed to address the challenge of high water content in honey production. Thermal treatment is commonly employed for industrial honey dehydration, with temperature typically ranging from 55 °C to 80 °C (31). However, high-temperatures may reduce diastase activity and induce the formation of harmful substances such as 5-hydroxymethylfurfural (HMF) (32, 33). As a potential carcinogen, HMF is correlated with reduced honey freshness (34). Thermal treatment can enhance honey’s antioxidant activity (35). Vacuum drying methods of honey include high-temperature, freeze and ultrasonic vacuum drying. High-temperature and freeze vacuum drying can increase the total phenolics and flavonoid level of honey (15), whereas ultrasonic vacuum drying increases HMF content and darkens honey color (36). Microwave heating is another method for honey drying, as it penetrates and interacts with honey to achieve rapid heating (37). Nevertheless, under the same processing time, HMF formation seems to increase to a greater extent compared to thermal heating, and there is a decrease in glucose oxidase and invertase activity (38). When stingless bee honey is subjected to microwave heating at a constant power level of 60 W for 1 min, its antioxidant activity significantly decreases (39). Placing capped honeycombs in a hot room equipped with an automated temperature (36–38 °C) and humidity (30–40%) control system is also a useful drying method. This approach replicates the temperature and humidity conditions within bee colonies to facilitate honey dehydration. After 3 to 4 days of treatment, this method can effectively reduce the water content of the honey to below 18% (40–42).
For small-scale apiaries (<100 colonies), thermal treatment may reduce the nutritional value of honey. Vacuum drying and microwave heating require skilled operators and are difficult to maintain. Hot rooms are impractical due to spatial limitations (>10 m2) and financial constraints. However, beekeepers in small apiaries are in urgent need of a low-cost and quality-preserving way to reduce the water of honey.
This study, drawing on the principles of hot air-drying technology, developed an automated temperature- and humidity-controlled honey cabinet designed explicitly for small apiaries in high-humidity regions to reduce the water content of TCH. The cabinet (1.5 m3) utilizes heaters, dehumidifiers, and axial fans to maintain a temperature of 38 °C and a relative humidity of 30% (Supplementary Figures S1, S2), processing 15 honeycombs per batch. Comprehensive functional verification demonstrated that after treatment with the cabinet, the water content in capped honeycombs of TCH was reduced to below 18%, while effectively preserving nutritional and flavor components of honey and enhancing its antioxidant capacity. Unlike industrial dehydrators or hot rooms, its compact design (<0.5 kW in power) suited small apiaries, offering the advantages of low operating costs, quick return on investment and portability. This innovation not only enhances honey quality and concentration but also contributes to improved economic returns for beekeepers.
2 Materials and methods
2.1 Sample collection
TCH was selected for this experiment, which had the largest production during summer in the high-humidity regions of southern China. The apiaries selected for the production and harvesting of TCH were Weimin apiary in Yongxiu County, Jiangxi Province, China (29°01′N, 115°29′E) and Gan’s apiary in Anfu County, Jiangxi Province, China (114°21′E, 27°14’N). Both were surrounded by plantations of T. cochinchinensis. During the flowering period of T. cochinchinensis (June–July 2024), 10 colonies (Apis mellifera) were organized to produce TCH. Honeycombs with a capped rate exceeding 95% were chosen as the test samples.
2.2 Chemicals and reagents
LC–MS acetonitrile, methanol and formic acid were purchased from Thermo Fisher (MA, United States). A mixture of n-alkanes (C7-C40) standard was purchased from Merck (Darmstadt, Germany). Glucose and fructose standards were obtained from Dr. Ehrenstorfer (Augsburg, Germany). Sucrose standard was sourced from Anpel (Shanghai, China). Octanol standard was purchased from TMTR (Changzhou, China). Rutin and gallic acid standards from Weiye (Beijing, China). Furfural standard solution was acquired from Alta (Tianjin, China). NaOH and H2SO4 were purchased from Bolind (Shenzhen, China). Glycerol, sodium acetate, acetic acid, iodine, potassium iodide, sodium chloride, and starch were purchased from Sinopharm (Shanghai, China). Dichloromethane (purity) ≥ 99.9% was purchased from Xiya (Linyi, China). AlCl3, Na2CO3 and ethanol were obtained from Xilong (Shantou, China). Honey glycerol enzymatic analysis kit was obtained from Kwinbon (Beijing, China). Folin-Ciocâlteu reagent, ABTS free radical scavenging capacity (ABTS+) and ferricion reducing antioxidant power (FRAP) kits were purchased from yuanye (Shanghai, China). 2,2-diphenyl-1-picrylhydrazyl (DPPH) was acquired from Phygene (Fujian, China). Ultra-pure water from Ultrapure Lab Water Systems (RephiLe, Shanghai, China) was used throughout the study.
2.3 Honey cabinet and verification of its dewatering efficiency and energy consumption
A honey cabinet was used to excessive water content in this experiment. The control system of the honey cabinet utilizes the temperature and humidity sensor to automatically regulate the heater, dehumidifier, and axial fan, ensuring proper air circulation and maintaining stable temperature and humidity environment within the honey cabinet (Supplementary Figures S1, S2). Dimensions: 1.2 m (W) × 0.8 m (D) × 1.6 m (H). Capacity: 15 honeycombs (40 × 25 cm each). The relevant parameters of honey cabinet were summarized in Supplementary Table S1. The automated control system can maintain a stable temperature at 38 °C ± 1 °C and the relative humidity at 30 ± 5%. Upon activation of the honey cabinet, the heated air is accelerated, distributed and filled the entire cavity, which creates a continuous circulation of hot air within the drying chamber and effectively facilitates the drying of the capped honeycombs (Supplementary Figures S3, S4). The operational flow diagram for the honey cabinet was shown in Supplementary Figure S5.
A total of 30 capped honeycombs of TCH (15 in one apiary) with an initial water content of 21–22% were selected. Each honeycomb was divided into six areas, and five cells were randomly sampled from each area to measure the water content, allowing for the estimation of the overall water content across the entire honeycomb. Five honeycombs were placed on each shelf of the honey cabinet, maintaining a spacing of 6–8 cm between them (Figures 1C,D).
We conducted a pre-experiment using capped honeycomb samples with different initial water contents and found that the water contents of all samples could be reduced to below 18% after 96 h of treatment. Therefore, the honeycombs were processed in the cabinet for 96 h. Before treatment (0 H), five honeycombs were randomly chosen. Each honeycomb was divided into six areas (three on each side), and five cells were selected within each section. Remove the beeswax caps and measure the initial water content of TCH. After 96 h of treatment (96 H), follow-up sampling was performed in each area by measuring water of five cells. Random sampling was performed in each honeycomb area, and the analysts were blinded to treatment groups during subsequent experiments.
There were 30 replicates in each group. The water content was then calculated by determining the refractive index at 40 °C using an Abbe refractometer (DRA1, ATAGO, Tokyo, Japan). During the cabinet run, the energy consumed by honey cabinet was recorded with power meters.
2.4 Palynological and physicochemical analysis
The TCH produced by Weimin apiary was utilized for subsequent analysis. The light microscope equipped with a camera (DS-Fi3, Nikon Corporation, Tokyo, Japan) was used to palynological analysis. The TCH samples preparation and local pollen grains determination was based on the method of Yang et al. (43).
To examine the effects of cabinet treatment on TCH quality, the physicochemical components of 0 and 96 H TCH samples were analyzed. The contents of fructose, glucose and sucrose in TCH samples were determined using the AOAC method No. 977.20 (44). A high-performance liquid chromatograph (HPLC) equipped with a refractive index detector (2695–2,414, Waters, MA, United States). The Cosmosil Sugar-D (5 μm 4.6 × 250 mm) column (Nacalai tesque, Kyoto, Japan) was used for the separation of sugar compounds. The mobile phase consisted of water-acetonitrile (25:75, v/v) with a flow rate at 1.0 mL/min, column temperature at 40 °C, injection volume of 20 μL and run time of 15 min per sample. Standard solutions of glucose, fructose and sucrose were prepared to establish standard curves for calculating the sample concentration. The water system also used for HMF analysis consisted of an HPLC and an ultraviolet (UV) detector. The chromatographic separation was by ACQUITY UPLC BEH C18 (1.7 μm 2.1 × 50 mm) column (Waters, MA, United States). The conditions were as follows: the mobile phase consisted of water–methanol (90:10, v/v), the flow rate of 1.0 mL/min, column temperature at 30 °C, injection volume of 10 μL and run time of 15 min per sample. HMF standards were prepared at concentrations of 0.01 mg/mL - 1 mg/mL with water–methanol (90:10, v/v) for calibration. Samples were dissolved to 100 mg/mL with water–methanol (90:10, v/v) for determination.
The diastase activity of TCH was analysis as follows: 5.0 g sample was dissolved in 15 mL water, together with 2.5 mL acetate buffer (pH = 5.3). Then 1.5 mL of 0.5 M sodium chloride was added, and the mixture was diluted to 25 mL with water. 5 mL starch solution was combined with 10 mL honey solution. From the 5th min, 1.0 mL of the mixture was added to 10.0 mL iodine solution every 15 min and then the absorbance was measured at 660 nm using a spectrophotometer. The procedure was repeated until the absorbance dropped below 0.235. A standard curve was drawn with time and absorbance to calculate the time when the absorbance of the sample mixed solution reached 0.235.
The free acidity was determined using the Chinese rules for the inspection of honey for import and export (SN/T0852-2012) (45). A 10.0 g honey sample was dissolved in 75 mL of boiled and cooled water. Two to three drops of 1% phenolphthalein indicator were added, followed by titration with 0.1 M sodium hydroxide solution until a stable pink color persisted for at least 10s. The final acidity values were calculated in mL/kg. The glycerol of TCH were assessed utilizing commercial assay kits and results were expressed as mg/kg.
The lab chromaticity was measured by a CM-5 chromameter (Minolta, Shanghai, China). The samples were filled into the cuvette and placed in the transmission sample chamber to measure the L* (lightness), a* (Redness) and b*(yellowness) values after whiteboard correction.
2.5 GC–MS analysis
The SPME fiber (50/30 μm DVB/CAR/PDMS, stableflex (2 cm) 24 Ga; Supelco, PA, United States) was used to extract volatile compounds from TCH samples. 5.000 g of sample was weighed, dissolved in distilled water, and diluted to 10 mL to obtain a concentration of 0.5 g/mL. The mixture was then transferred to a 20 mL SPME vial. 200 μL of octanol was subsequently added (dissolved in dichloromethane, 10 μg/mL) and mixed well (46). The samples were incubated at 40 °C for 15 min and then extracted for 30 min. Before the extraction, the SPME fibers were conditioned 30 min.
GC–MS system (5977B-7890B, Agilent Technologies, CA, United States) equipped with HP-VOC (30 m × 0.20 mm × 1.12 μm) was adopted for sample analysis. The conditions were as follows: Helium (99.99% purity) served as the carrier gas at a constant flow rate of 1.2 mL/min, maintaining a constant pressure of 9.1075 psi. The injection temperature was 250 °C and the analytes were carried out in splitless mode. The initial column temperature was held at 40 °C for 2 min, then increased to 180 °C at a rate of 2 °C/min, followed by a further increase to 260 °C at 5 °C/min, and held for 5 min. The total analysis time was 97.00 min. The mass spectra data were performed under 70 eV electron ionization.
2.6 UPLC-MS/MS analysis
The Oasis HLB (3 cc/60 mg, Waters Oasis, MLF, United States), a solid-phase extraction (SPE) column was used for the extraction of compounds from TCH samples. Briefly, 2.5 g honey sample was weighed, dissolved thoroughly in 5 mL of water, and then centrifuged at 8000 r/min for 10 min. The supernatant was retained. After the SPE column was activated according to the instructions, the supernatant was loaded onto the column for component enrichment. The column was then washed with water and thoroughly removed residual water. Subsequently, the column was eluted with 3 mL of methanol and dried under nitrogen gas. The eluate was redissolved in 1 mL of 80% methanol solution, filtered through a 0.22 μm filter membrane, and transferred to an injection vial for analysis. The quality control (QC) sample was prepared by mixing equal volumes of the injection solutions from all samples, which was used to monitor the stability of the analytical system.
An ultra-high-performance liquid chromatography system (Dionex Ultimate 3,000, Thermo Fisher Scientific, MA, United States) coupled to a Q Exactive mass spectrometer (MS, Thermo Fisher Scientific, MA, United States) with a heated electrospray ionization (HESI) source was used for testing the compounds of TCH samples. The separation was performed on an ZORBAX Eclipse Plus C18 chromatographic column (3.0 × 150 mm × 1.8 μm, Agilent Technologies, CA, United States) thermostated at 40 °C. A gradient elution program ran with mobile phase A (0.1% formic acid water) and B (methanol) as follows: 0–0.5 min, 95% A; 0.5–4 min, 95–40% A; 4–12 min, 40–5% A, 12–16 min, 5% A; and 16–20 min, 95% A. Each injection of 2 μL was loaded with a flow rate of 0.3 mL/min. All samples were collected in positive (ESI+) and negative ion (ESI-) switching full scan modes. The quality control (QC) sample was injected once for every five real samples to examine the stability of the entire detection process and was used for qualitatively determination scanned in the full scan/ddMS2 mode.
The HESI parameters were optimized as follows: sheath gas flow rate 40 L/min; aux. Gas flow rate 5 L/min; spray voltage 3,000 V for ESI- and 3,500 V for ESI+; capillary temperature 320 °C; S lens radio frequency voltage level of 60%; and aux. Gas heater temperature 350 °C. Full scan data (m/z 80–1,200) were acquired at a resolution of 70, 000 and ddMS2 was set at 17,500. The collision energies were 20, 30, and 40 eV. The automatic gain control (AGC) was set at 1 × 10⁶ and the maximum injection time was set to 50 ms. The scan rate was set at 1 scan/s. MS data was collected using Xcalibur software 4.0 (Thermo Fisher Scientific, MA, United States) and saved as Raw format files.
2.7 Analysis of total phenolics, flavonoids content and antioxidant capacity
2.7.1 Determination of total phenolics and flavonoids
Total phenolics (TPC) and flavonoids content (TFC) of TCH samples were assessed following the protocol previously published by Cucu et al. (47). A calibration curve was constructed using various concentrations (0.01–0.25 mg/mL) of gallic acid (y = 10.567x + 0.1268, R2 = 0.998) and rutin (y = 9.0645x + 0.0816, R2 = 0.999). The results were presented as gallic acid equivalents (GAE) in mg/100 g of honey for phenolics determination and rutin equivalents (RE) in mg/100 g of honey for flavonoids measurement.
2.7.2 Determination of antioxidant capacity
DPPH/ABTS+ reflect radical scavenging in hydrophilic systems, while FRAP assesses reduction potential—collectively covering honey’s antioxidant mechanisms (12). The antioxidant capacity of TCH samples was determined by FRAP, DPPH, and ABTS+ methods. For the DPPH experiment, the procedure followed the method described by Hu et al. (48). The ABTS+ and FRAP assays for TCH were assessed utilizing commercial assay kits. The results were displayed as 50% inhibitory concentration (IC50) of DPPH and ABTS+, while the FRAP results were expressed as mg/Trolox kg of honey.
2.8 Statistical analysis
Except for the moisture content analysis, all experiments were repeated with five biological replicates and the results are presented as mean ± standard error (SE). Data normality was confirmed via Shapiro–Wilk tests (p > 0.05). Unpaired t-test were performed using IBM SPSS (version 27, IBM Corp., NY, United States). Additionally, Pearson correlation coefficient was used for correlation analysis. The metabolomics analyses were conducted using the online platform MetaboAnalyst.1
The raw MS data were imported into Compound Discoverer 3.2 software (Thermo Fisher Scientific, CA, United States) for subsequent data calibration and data analysis. Firstly, the CD3.2 software identified and aligned the ion peaks in the raw file, as well as normalizing the peak area, and performed preliminary characterization. The ion peak matching parameters were as follows: maximum allowed retention time offset 0.2 min; maximum allowed mass deviation 5 ppm; minimum peak response value 1 × 10⁷; signal to noise ratio 3; peak response deviation 30%. The mzCloud, ChemSpider and mzVaul databases were used for metabolite identification.
A peak rating threshold of 4.5 was applied and only features detected in at least three samples were retained.
The qualitative volatiles were identified using the MassHunter Workstation Unknowns Analysis, B.09.00 software (Agilent Technologies, CA, United States) combined with the NIST 17 database, based on retention time, mass-spectral similarity match (> 80%) and Retention Index (RI) offsets of ± 20 units.
3 Results and discussion
3.1 Dewatering efficiency and energy consumption of honey cabinet
Following a 96-h treatment in the honey cabinet at a temperature of 38 °C ± 1 °C and relative humidity of 30% ± 5%, the water content of the capped honeycombs of TCH produced by Yongxiu and Anfu both decreased to below 18% (Table 1). It was significantly lower than the European Union standard of less than 20% (49). This reduction effectively prevented fermentation and degradation, thereby enhancing the quality and facilitating long period storage of TCH (50).
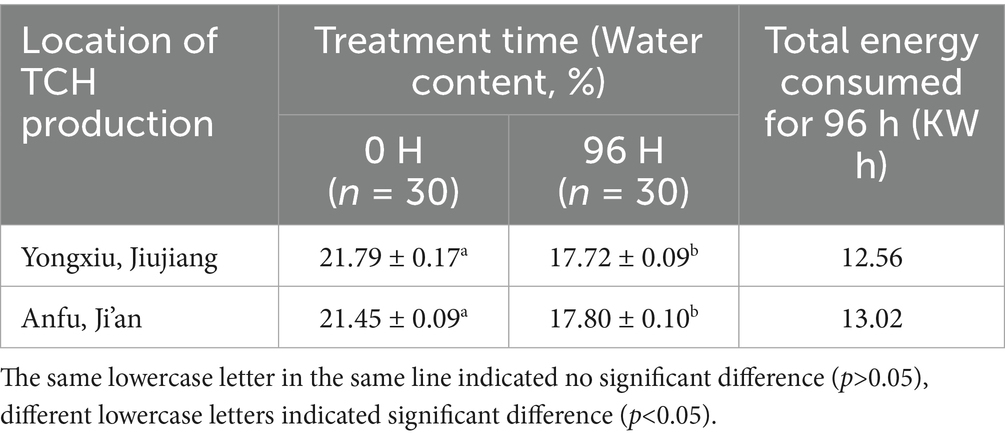
Table 1. Honey dewatering and total energy consumption for each test.
The average energy consumption per run of cabinet was 12.8 kWh, translated to an operational cost of approximately $1.06 per run, based on the 2025 U. S. industrial electricity rates. It was a marked reduction compared to traditional hot rooms, which are estimated to be 25–35 kWh for comparable throughput (40). Each run could process approximately 50 kilograms of TCH, so the cabinet’s energy use was 0.26 kWh/kg and the 96 h treatment cost was $0.02 per kilogram, which is 48% lower than commercial vacuum drying units (0.5 kWh/kg) (17) and 85% lower than thermal heating machine ($0.135 per kilogram) (35).
While a duration of 96 h may seem long, this is a viable timeframe for high value honey batch production in small apiaries. Additionally, automation has minimized labor costs. Further optimization may include slightly higher temperatures and lower relative humidity (within safe limits to avoid HMF or glycerol) to potentially reduce processing time without compromising quality.
In summary, the honey cabinet not only guaranteed efficient dehydration of capped honeycombs but also maintained a comparatively low operational cost. It provided a practical solution to improve income for small-scale beekeepers facing TCH devaluation due to high water content. With a low purchase cost of only $ 210 and an easy one-touch operation, it is highly suitable for small apiaries and favorable for rapid and wide-scale dissemination in humid regions.
3.2 Palynological characterization and effects on physicochemical parameters of TCH
The pollen grains in TCH observed under the microscope displayed a prolate shape in the equatorial view (Figure 2A) and a trilobed circular shape in the polar view (Figure 2B). The pollen grains of T. cochinchinensis accounted for 85.06% ± 2.51% in TCH. Which indicates that the samples met the requirement (>45%) to be considered monofloral honey (51).
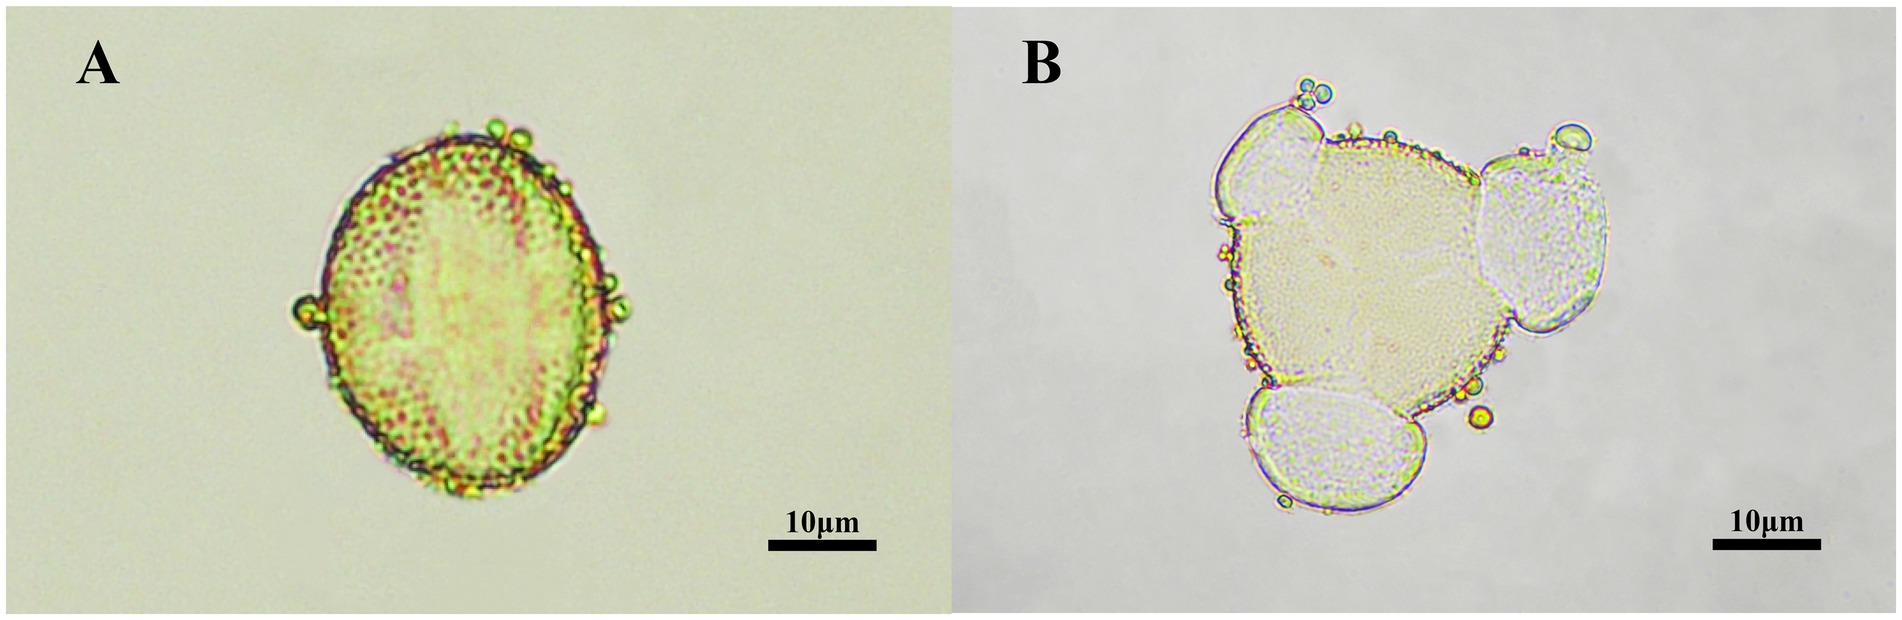
Figure 2. The palynological characterization of TCH. (A) An equatorial view of TCH pollen grains under the microscope. (B) A polar view of TCH pollen grains under the microscope.
Seven physicochemical parameters of TCH at different treatment times were shown in Table 2. As the treatment time increased, the content of fructose and glucose in TCH significantly increased, while the sucrose content significantly decreased. The sucrose was enzymatically hydrolyzed into fructose, glucose and other monosaccharide by invertase during the honey maturation process (52, 53). This indicated that during the honey cabinet treatment, TCH underwent a post maturation. Additionally, the significant increase in monosaccharide content aligned with the sugar composition characteristics observed in mature honey (54).
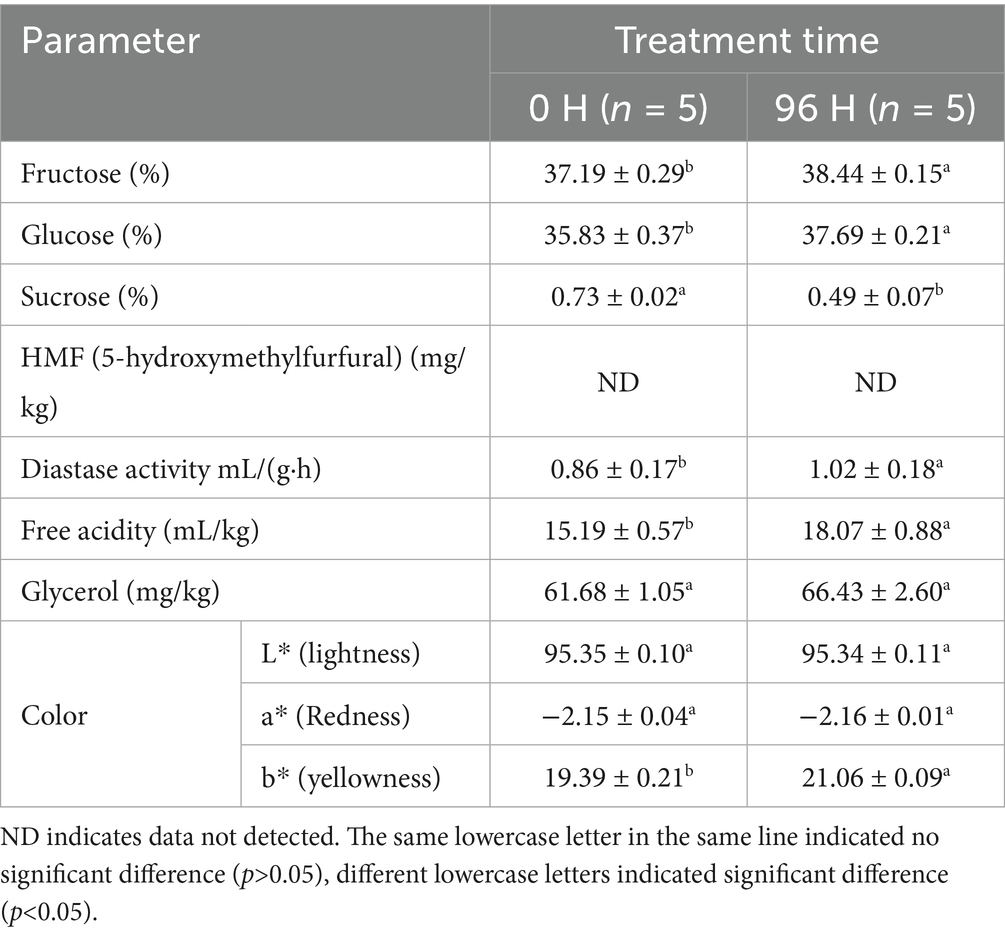
Table 2. Physicochemical parameters of 0 H and 96 H TCH.
HMF, a toxic cyclic aldehyde and an intermediary product of Maillard reactions in honey, served as a crucial indicator for evaluating the extent of honey thermal treatment (55, 56). No HMF was detected in any TCH samples, indicating that the honey cabinet treatment did not result in thermal degradation and consequently prevented the formation of harmful substances such as HMF (57).
Diastase is sensitive to heat, and exposure to thermal treatment can cause denaturation of its structure, leading to inactivation (15, 58). The activity of diastase is frequently used as an indicator to evaluate the freshness and the processing suitability of honey (59). TCH naturally exhibits low diastase activity (18). As treatment time increased, the diastase activity in TCH also rose, which is consistent with Zhang et al.’s findings that diastase activity increases with greater maturity (60).
Acidity plays a pivotal role in inhibiting microbial growth (51). The significant increase in acidity of 96 H TCH enhanced the antibacterial properties of honey (61). Honey fermentation results in the production of glycerol, which is difficult to eliminate during subsequent honey processing (62). It can be used to assess honey spoilage and processing suitability (63). The glycerol content of TCH showed no difference after 96 h of processing, which indicates that it will not accelerate fermentation and extend the storage time. The color of TCH is light amber (64). The b* (yellowness) values increased significantly with prolonged treatment time, suggesting that TCH is progressively maturing.
3.3 Variation of volatile compounds of TCH
Volatile compounds impart both taste and aroma to honey, representing essential quality characteristics of honey (65). Over 600 volatile compounds have been identified in various types of honey (66, 67).
A total of 8 kinds of 36 volatile compounds were tentatively identified from 0 H and 96 H TCH, including acids, alcohols, aldehydes, esters, hydrocarbons, aromatics, phenols and ethers. All of them were present on both time points. Both groups identified octanal and nonanal as frequently detected volatile compounds, contributing to the fresh citrus-like fruit aroma characteristic of TCH (46, 68). Furthermore, nonanoic acid and decanol impart woody and floral aromas to TCH (69, 70).
The orthogonal partial least squares-discriminant analysis (OPLS-DA) was carried out on 36 volatile compounds. The two groups were clearly separated in the OPLS-DA score plot, indicating the discrimination between them was excellent (Figure 3A). The differential volatile compounds were screened using p < 0.05 and |log2FC| > 0.585. Compared to the 0 H TCH, the 96 H TCH had 2 differential volatile compounds (Figure 3B). The proportion of non-differential volatile compounds was 94.44%. 2-methylnonane was down-regulated. Hydrocarbons are common in honey and may originate from flower nectar and further converted by bees (71). The result was consistent with the studies that the maturity of Gallnut honey increased while hydrocarbons content decreased (72). The content of cedrol increased after 96 H treatment. Previous studies have shown that the volatile compounds in honey, particularly terpenoids, alcohols, and aldehydes, fluctuate during the ripening process, consistent with our findings (73). Cedrol provides herbal flavors for TCH and serves as a volatile marker and an important contributor to unifloral safflower honey (74). Therefore, it was observed that after 96 H treatment by honey cabinet, the overall volatile compounds of TCH had no significant alterations.
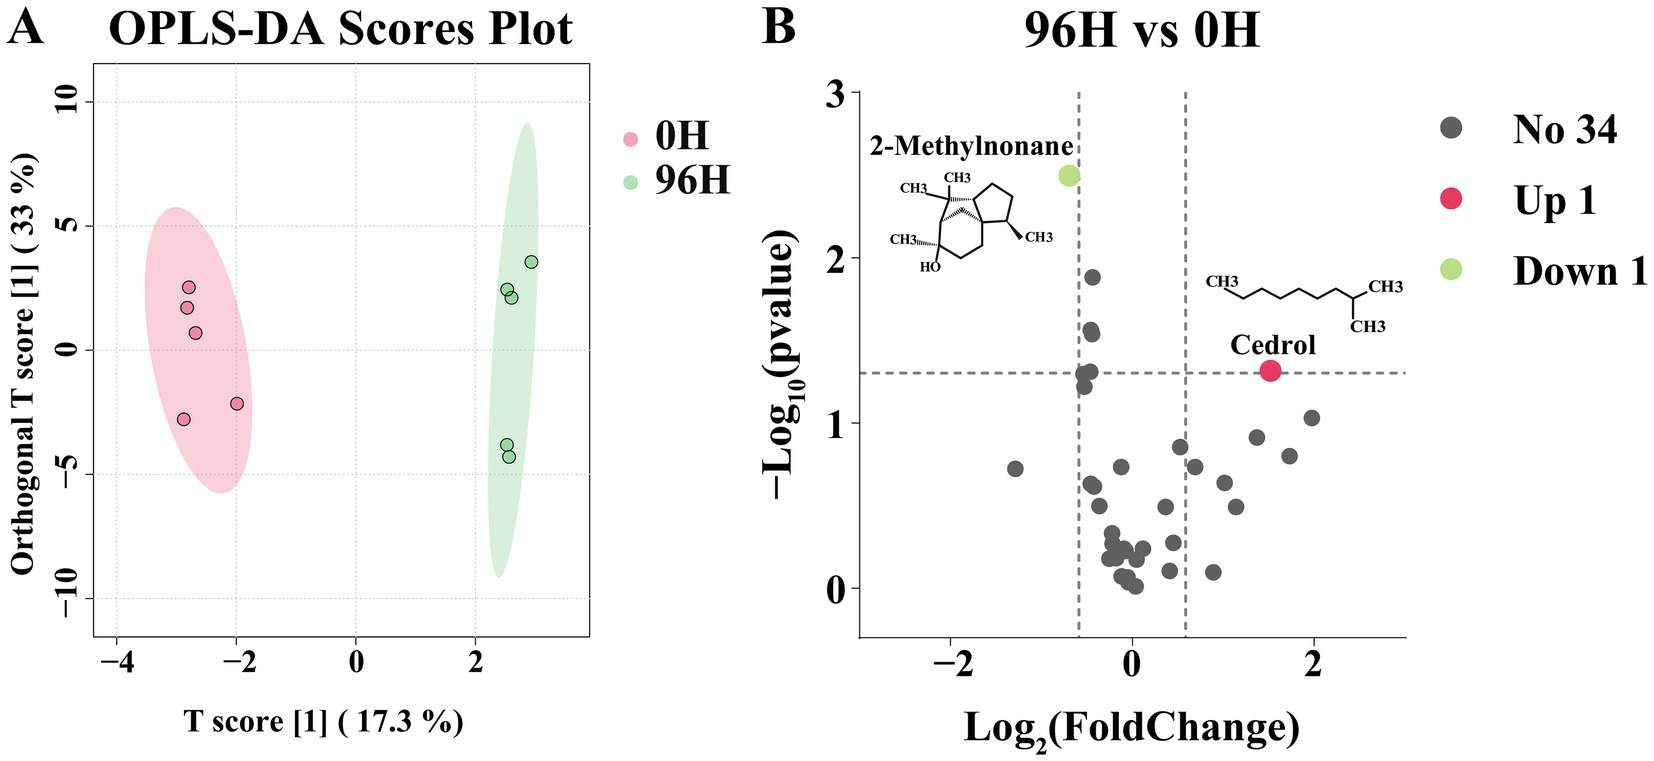
Figure 3. The GC–MS analysis of 0 H and 96 H TCH. (A) The OPLS-DA scores plot of volatile compounds determined by GC–MS of 0 H and 96 H TCH (n = 5). (B) Volcano plot of 36 identified volatile compounds from 96 H TCH vs. 0 H TCH. The differential volatile compounds were analyzed by p < 0.05 and |log2FC| > 0.585.
Sensory evaluation was valuable for flavor perception. However, the minimal changes in key aroma-active compounds in TCH like octanal, nonanal and nonanoic acid (65), along with the increase in cedrol, indicate that the overall sensory profile characteristic of TCH is well-preserved (75). Moreover, sensory perception depends on both compound concentrations and odor thresholds, and given that 2-methylnonane is a minor component, its sensory impact is likely to be limited (76). Future studies should include sensory panels to confirm consumer acceptability.
3.4 Variation of chemical compositions of TCH
A total of 1,546 small molecule compounds were identified in TCHs (0 H and 96 H treatment), with the composition of components being identical in both groups. The OPLS-DA analysis was carried out on the 1,546 metabolites in two groups. There was a clear separation in the OPLS-DA score plot, indicating that the optimal classification result has been achieved (Figure 4A). The differential metabolites were screened using p < 0.05 and |log2FC| > 0.585. Compared to the 0 H TCH, the 96 H TCH exhibited 66 differential components (Supplementary Table S2; Figure 4B), including 42 up-regulated components, mainly organic acids, fatty acids, esters, phenolic acids, flavonoids and others. The proportion of non-differential compounds was 95.73%.
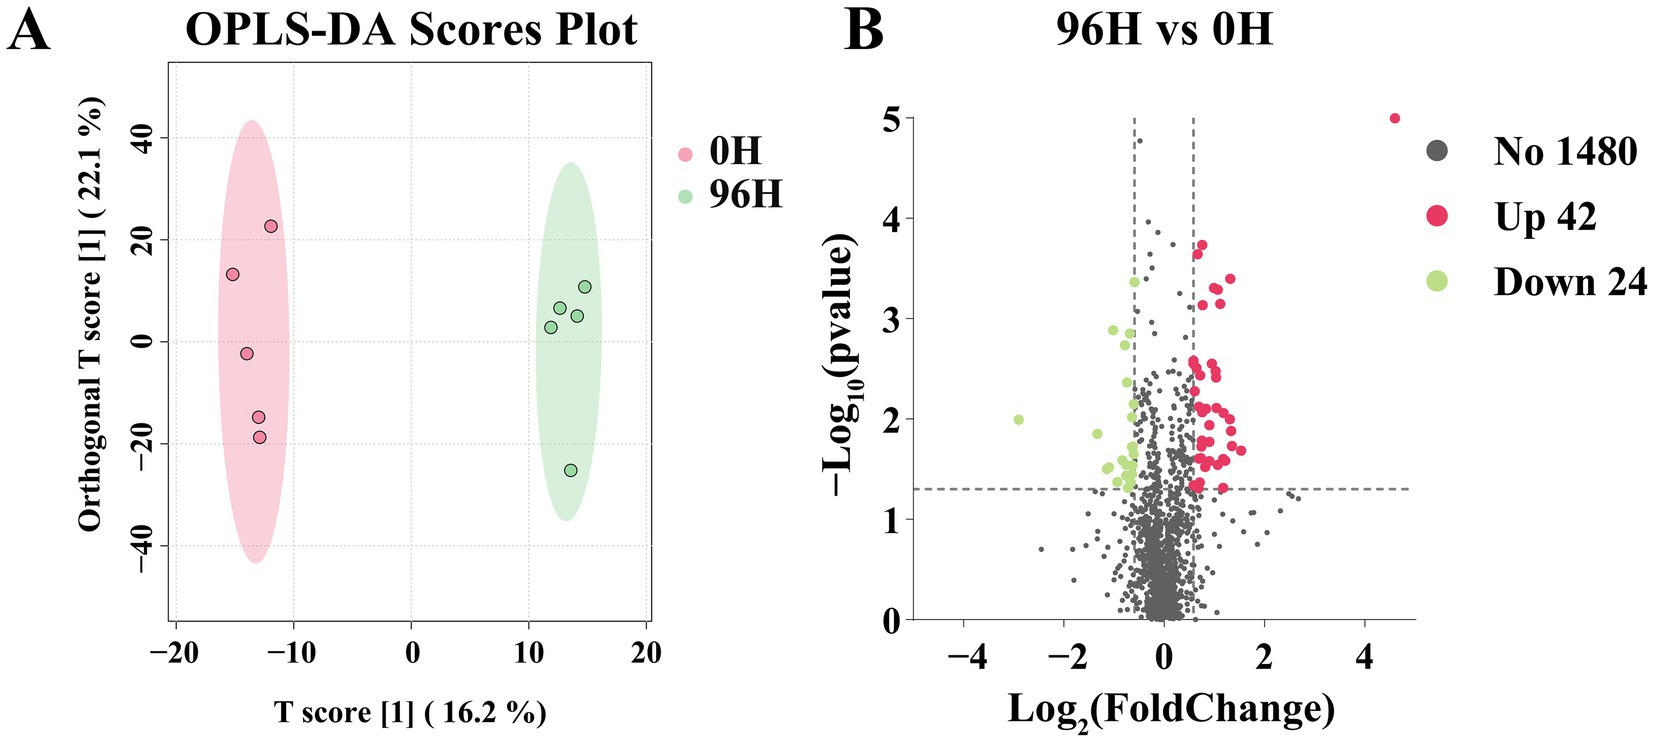
Figure 4. The UPLC-MS/MS analysis of 0 H and 96 H TCH. (A) The OPLS-DA scores plot of compounds determined by UPLC- MS/MS of 0 H and 96 H TCH (n = 5). (B) Volcano plot of the 1,546 identified metabolites from 96 H TCH vs. 0 H TCH. The differential metabolites were analyzed by p < 0.05 and |log2FC| > 0.585.
The upregulation of differential components in the 96 H TCH could primarily be attributed to two factors. Firstly, the reduction in water content resulted in a higher concentration of specific components. Secondly, after 96 h of treatment, TCH had exhibited greater transformation and maturity. For example, during the maturation process, sucrose continuously undergoes hydrolysis to form fructose and glucose, while organic acids are simultaneously generated (77). The elevated levels of six organic acids contributed to lowering the pH value of TCH, thereby enhancing its antibacterial properties (78). Fatty acids accumulate by the action of lipase on lipids during honey maturation, and the subsequent dehydration process further increases their concentration (79). There was a significant upregulation of two long-chain fatty acids, which aligned with previous research that mature honey contained significantly higher levels of long-chain fatty acids compared to immature honey (54). Additionally, the levels of three esters in the 96 H TCH had also increased, contributing to the development of TCH’s distinctive fruity and floral aromas (80). Furthermore, we also found that one Phenolic acid and one flavonoid were upregulated in the 96 H TCH, consistent with the finding that some polyphenol levels increase during TCH maturation (81), potentially improving the antioxidant capacity of TCH. Phenolic increases may arise from continued plant enzyme activity (e.g., polyphenol oxidase) during dehydration, converting glycosides to aglycones (82).
These results collectively suggested that honey cabinet treatment promoted honey maturation without causing significant changes in the composition or content of the compound and may enhance TCH antioxidant capacity.
3.5 Comparative analysis of TPC, TFC and antioxidant capacity of TCH
Phenolic acids and flavonoids are important bioactive substances in honey, mainly contributing to its antioxidant activity (83, 84). The TPC and TFC of the 96 H TCH were significantly increased by 15.83 and 25.42%, respectively, compared to those of the 0 H TCH (Figures 5A,B). Based on the UPLC- MS/MS results, methyl gallate and 2-methoxyisoliquiritigenin showed significant increase. Furthermore, phenolic acids like gallic acid, sinapinic acid and 4-hydroxy-2-methylbenzoic acid, as well as flavonoids including quercetin, kaempferol, eupatorin and sakuranetin, all exhibited upward trends. Methyl gallate (upregulated 2.1-fold) exhibits high oral bioavailability and antimicrobial effects against Aspergillus spp., potentially extending shelf-life (85).
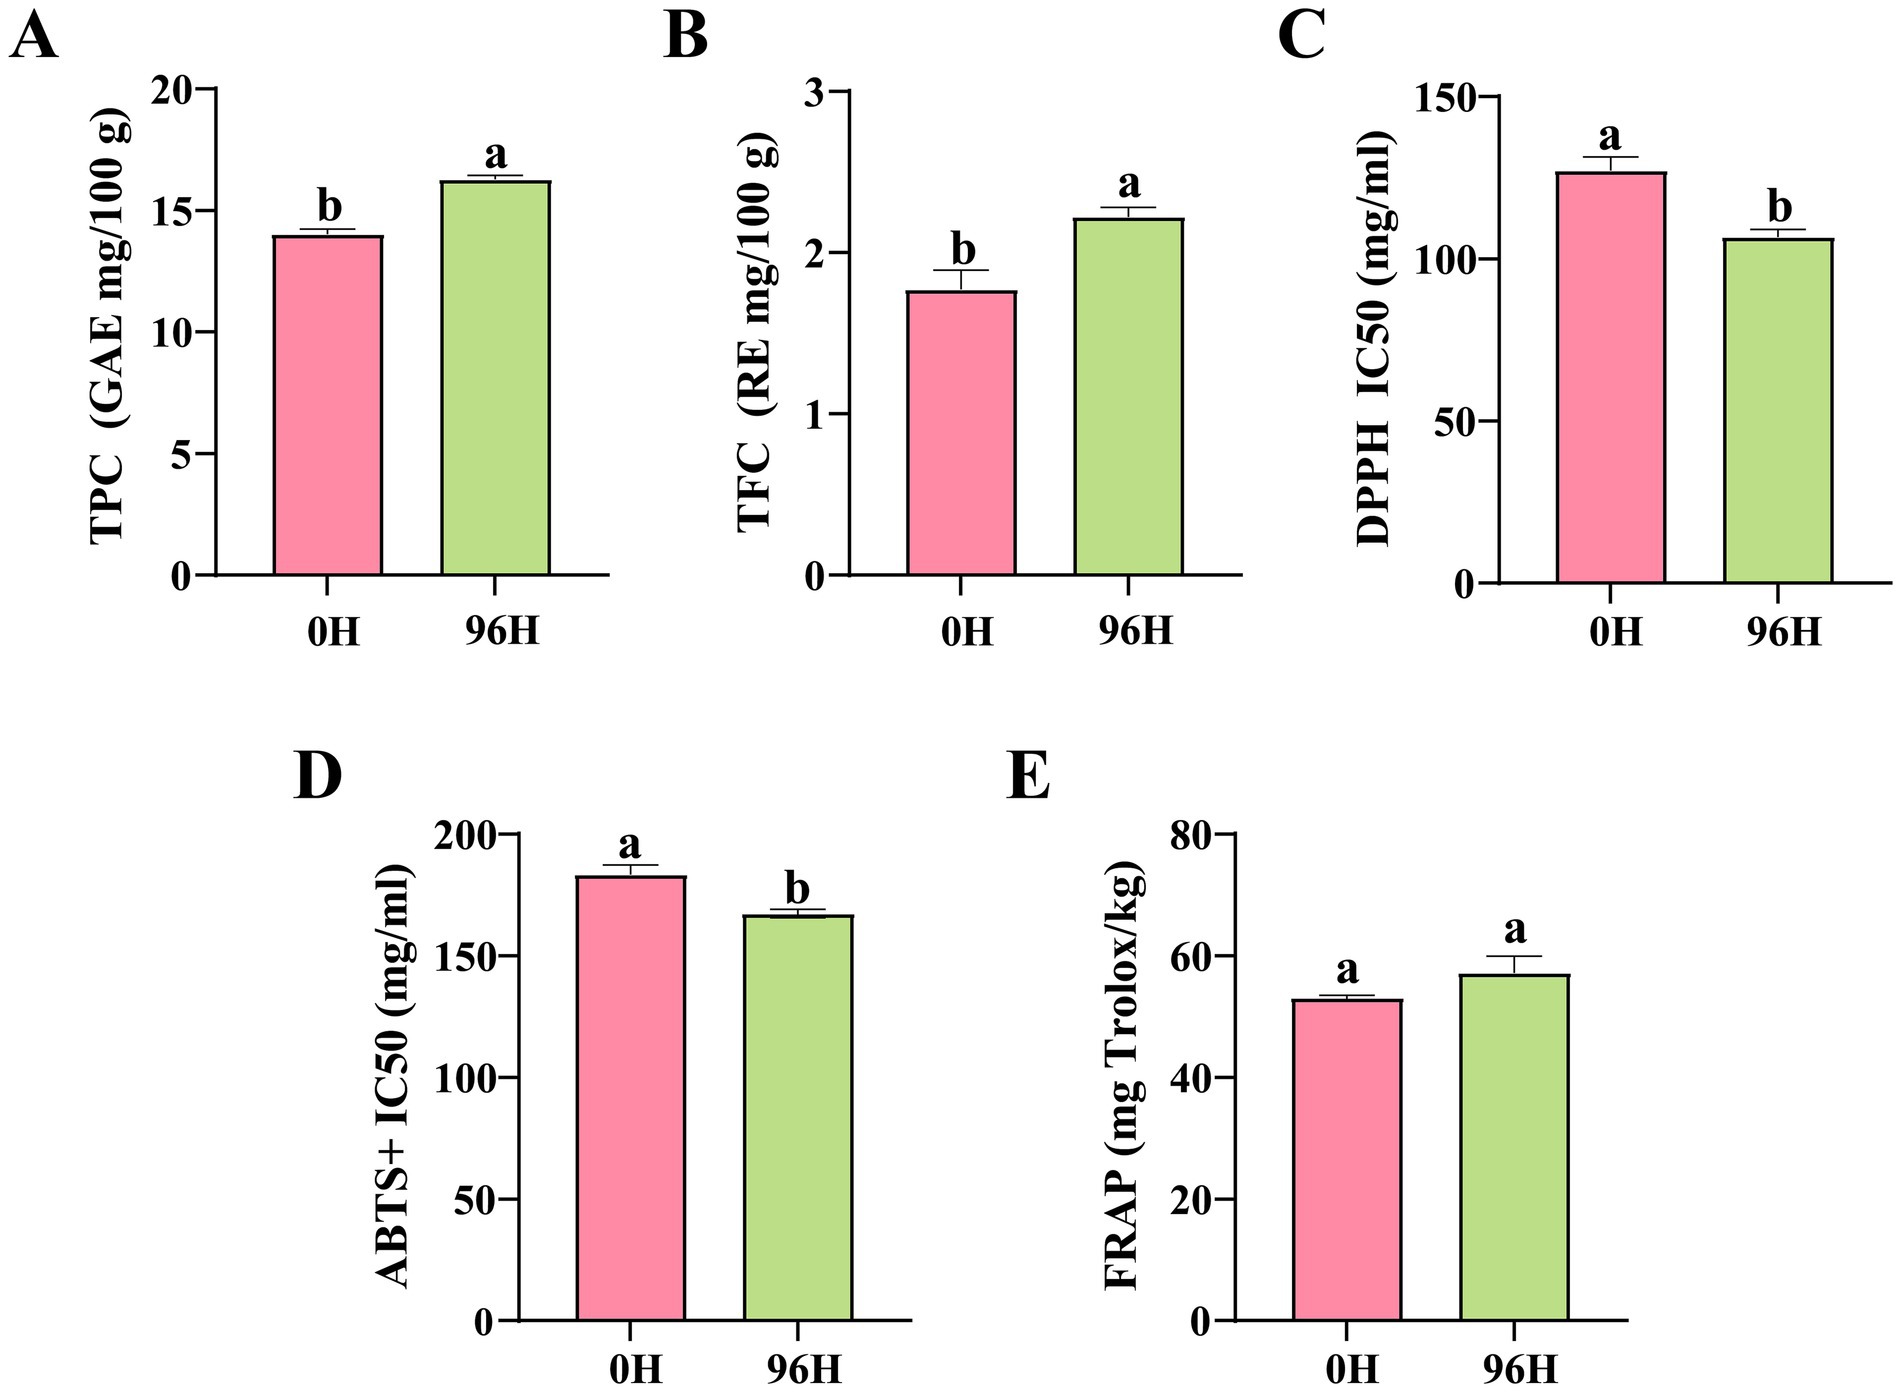
Figure 5. Total phenolics, flavonoids content and antioxidant capacity of 0 H and 96 H TCH. (A) Total phenolics content (GAE mg/100 g) in 0 H and 96 H TCH (unpaired t-test, n = 5). (B) Total flavonoids content (RE mg/100 g) in 0 H and 96 H TCH (unpaired t-test, n = 5). (C) The 2,2-diphenyl-1-picrylhydrazyl (DPPH) IC50 (mg/mL) in 0 H and 96 H TCH (unpaired t-test, n = 5). (D) The ABTS free radical scavenging capacity (ABTS+) IC50 (mg/mL) in 0 H and 96 H TCH (unpaired t-test, n = 5). (E) The ferricion reducing antioxidant power (FRAP; mg Trolox/kg) in 0 H and 96 H TCH (unpaired t-test, n = 5). The same lowercase letter in the same figure indicated no significant difference (P>0.05), different lowercase letters indicated significant difference (P<0.05).
The DPPH IC50 and ABTS+ IC50 values for 96 H TCH are notably lower by 19.20 and 9.5%, respectively, compared to those of 0 H TCH (Figures 5C,D). Although the FRAP values did not reach statistical significance, they exhibited an upward trend (Figure 5E). As shown in Table 3, both TPC and TFC in TCH have significant correlations with antioxidant capacity (DPPH IC50, ABTS+ IC50 and FRAP). These results showed that 96 h treatment with honey cabinet enhanced not only the TPC and TFC, but also the in vitro antioxidant capacity.
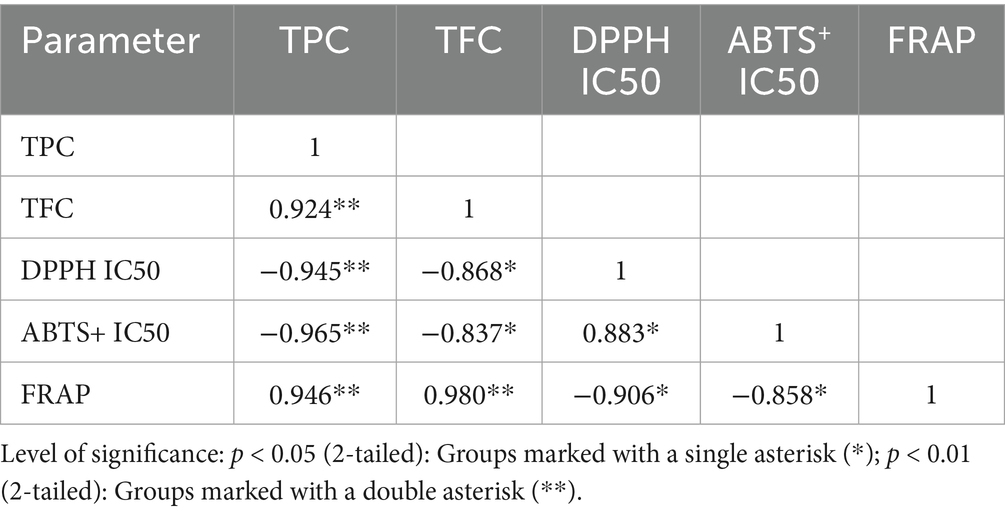
Table 3. Correlation matrix between TPC, TFC, and antioxidant capacity in TCH (n = 5).
Two factors may explain this observation: firstly, the treatment may improve honey maturity. Guo et al. noted that mature honey possessed richer polyphenolic compositions, and Zhang et al. found the TPC, TFC and vitro antioxidant capacity of rape honey displayed an overall upward trend with the increase of ripening (60, 82). Secondly, the b* (yellowness) values of 96 H TCH significantly increased. Research indicates that the color values of honey is a positive correlation with phenolic compounds content and antioxidant capacity (86). Estevinho et al. demonstrated that dark honeys contain significantly higher phenolics and superior DPPH scavenging capacity than light variants (87).
4 Conclusion
In this study, after 96 h of treatment at the temperature of 38 ± 1 °C and relative humidity of 30 ± 5% in the honey cabinet, the water content of TCH decreased to below 18%, effectively extending its shelf life. Results showed that this dewatering method not only accelerated TCH maturation and improved quality but also avoided the adverse effects of conventional thermal treatment. The composition and content of chemical composition and volatile compounds remained largely unchanged, with 95.73 and 94.44% similarity before and after treatment, respectively. Additionally, it increased TPC and TFC, enhancing antioxidant activity. These findings confirmed the honey cabinet’s effectiveness and practicality for TCH dewatering and quality preservation, providing a strong theoretical and technical foundation for its broader application in small apiaries. Additionally, it shows great potential in handling other high water honeys across Southeast Asia. While the sample size (30 honeycombs) and biological replication (n = 5) provide statistically significant results for the parameters measured, future studies with larger-scale validation across multiple seasons would strengthen generalizability.
Beekeepers can adopt this system for $210 (material costs), recovering investments within one season via improved honey quality. To ensure optimal performance, it is recommended that beekeepers follow the specified temperature and humidity settings when operating the honey cabinet. During the dewatering treatment, beekeepers should regularly check the water content of honeycombs to avoid over-drying. Overall, the cabinet’s cost-effectiveness and scalability provide a viable solution for small apiaries, enhancing economic returns for beekeepers in humid regions.
Data availability statement
The original contributions presented in the study are included in the article/Supplementary material, further inquiries can be directed to the corresponding authors.
Author contributions
HJ: Conceptualization, Data curation, Formal analysis, Methodology, Software, Writing – original draft, Writing – review & editing. WC: Conceptualization, Data curation, Formal analysis, Methodology, Software, Writing – original draft, Writing – review & editing. WJ: Resources, Validation, Writing – review & editing. FL: Investigation, Visualization, Writing – review & editing. XW: Data curation, Resources, Writing – review & editing. WY: Investigation, Visualization, Writing – review & editing. XH: Project administration, Software, Supervision, Writing – original draft. ZZ: Conceptualization, Funding acquisition, Project administration, Supervision, Writing – original draft, Writing – review & editing.
Funding
The author(s) declare that financial support was received for the research and/or publication of this article. This research was funded by Earmarked Fund for the China Agricultural Research System (grant number: CARS-44-KXJ15) and the Earmarked Fund for the Jiangxi Agricultural Research System (grant number: JXARS-14).
Acknowledgments
We would like to thank all the research participants for their active involvement. We also thank Hongmei Li-Byarlay for her comments that improved this manuscript, and Weimin Wu for providing the experimental colonies.
Conflict of interest
The authors declare that the research was conducted in the absence of any commercial or financial relationships that could be construed as a potential conflict of interest.
Generative AI statement
The author(s) declare that no Gen AI was used in the creation of this manuscript.
Any alternative text (alt text) provided alongside figures in this article has been generated by Frontiers with the support of artificial intelligence and reasonable efforts have been made to ensure accuracy, including review by the authors wherever possible. If you identify any issues, please contact us.
Publisher’s note
All claims expressed in this article are solely those of the authors and do not necessarily represent those of their affiliated organizations, or those of the publisher, the editors and the reviewers. Any product that may be evaluated in this article, or claim that may be made by its manufacturer, is not guaranteed or endorsed by the publisher.
Supplementary material
The Supplementary material for this article can be found online at: https://www.frontiersin.org/articles/10.3389/fnut.2025.1641551/full#supplementary-material
SUPPLEMENTARY FIGURE S1 | The structural diagram of honey cabinet includes left view, right view and air intake view. The meaning of numbers in the figure are as follows: 1. Dehumidifier, 2. Temperature and humidity sensor, 3. Axial fan, 4. Honeycomb shelves, 5. Heater, 6. Air intake, 7. Air outlet.
SUPPLEMENTARY FIGURE S2 | The 3D schematic representations: left and right view of honey cabinet, and control components including heaters, dehumidifiers, axial fans, air intake and air outlet.
SUPPLEMENTARY FIGURE S3 | The distribution of relevant parameters within honey cabinet. (A) The airflow mechanism of honey cabinet. Air enters through the bottom intake, accelerated by an axial fan to form a horizontal laminar flow that evenly spreads across the base and gradually fills the cabinet vertically, finally being discharged directionally through diagonally positioned upper vents. (B) The distribution of temperature in honey cabinet (°C), (C) The distribution of humidity in honey cabinet (%).
SUPPLEMENTARY FIGURE S4 | The internal temperature and relative humidity within the honey cabinet during a 96-h operation (38 °C ± 1 °C and the RH 30 ± 5%).
SUPPLEMENTARY FIGURE S5 | The operational flow diagram for the honey cabinet.
Footnotes
References
1. Bogdanov, S. Honey as nutrient and functional food. Proteins. (2012) 1100:1400–2700. Available at: https://freethebees.ch/wp-content/uploads/2020/06/HoneyNutrientFunctional.pdf
2. Marek, K, Wiktoria, S, Katarzyna, S, Lechosław, D, Anna-Maria, S, Agata, K, et al. The quality of selected raw and pasteurized honeys based on their sensory profiles and consumer preferences. Front Nutr. (2024) 10:1330307. doi: 10.3389/fnut.2023.1330307
3. Zhang, CP, Zhou, S, Wu, C, Xu, X, and Zhu, X. Evaluation of Litchi honey quality in southern China. Agriculture. (2025) 14:510. doi: 10.3390/foods14030510
4. Juraj, M, Marcela, B, Ioannis, K, Piotr, S, Katherine, AH, and Dimitris, M. Honey antibacterial activity: a neglected aspect of honey quality assurance as functional food. Trends Food Sci Technol. (2021) 118:870–86. doi: 10.1016/j.tifs.2021.11.012
5. Yazan, R, Abdah, MA, Hasiah Ab, H, Ka, H, Abdulmannan, F, Zainul Amiruddin, Z, et al. Honey and its nutritional and anti-inflammatory value. BMC Complement Med. (2021) 21:1–7. doi: 10.1186/s12906-020-03170-5
6. Akanda, MKM, Mehjabin, S, and Parvez, GMM, Honey for nutrition and health benefits: An overview. Honey in food science and physiology. Singapore: Springer Nature. (2024) 33–56.
8. Farkas, Á, Balázs, VL, Kõszegi, T, Csepregi, R, Kerekes, E, and Horváth, G. Antibacterial and biofilm degradation effects of Hungarian honeys linked with botanical origin, antioxidant capacity and mineral content. Front Nutr. (2022) 9:953470. doi: 10.3389/fnut.2022.953470
9. Tlak Gajger, I, and Vlainić, J. Antioxidant activity of honey bee products. Antioxidants. (2025) 14:64. doi: 10.3390/antiox14010064
10. Yiğit, Y, Yalçın, S, and Onbaşılar, EE. Effects of different packaging types and storage periods on physicochemical and antioxidant properties of honeys. Foods. (2024) 13:3594. doi: 10.3390/foods13223594
11. Michiu, D, Socaciu, M-I, Fogarasi, M, Jimborean, AM, Ranga, F, and Mureşan, V. Implementation of an analytical method for spectrophotometric evaluation of total phenolic content in essential oils. Molecules. (2022) 27:1345. doi: 10.3390/molecules27041345
12. Wilczyńska, A, and Żak, N. Polyphenols as the main compounds influencing the antioxidant effect of honey—a review. Int J Mol Sci. (2024) 25:10606. doi: 10.3390/ijms251910606
13. Tanleque-Alberto, F, and Escriche, I. Antioxidant characteristics of honey from Mozambique based on specific flavonoids and phenolic acid compounds. JFood ComposAnal. (2020) 86:103377. doi: 10.1016/j.jfca.2019.103377
14. Gül, A, and Pehlivan, T. Antioxidant activities of some monofloral honey types produced across Turkey. Saudi J Biol Sci. (2018) 25:1056–65. doi: 10.1016/j.sjbs.2018.02.011
15. Ikhsan, LN, Chin, K-Y, and Ahmad, F. Methods of the dehydration process and its effect on the physicochemical properties of stingless bee honey: a review. Molecules. (2022) 27:7243. doi: 10.3390/molecules27217243
16. Suhri, A, and Bahar, I. Water content of stingless bee honey varies by season. J Bio Tro. (2023) 23:16–22. doi: 10.29303/jbt.v23i2.4651
17. Subramanian, R, Hebbar, HU, and Rastogi, N. Processing of honey: a review. Int J Food Prop. (2007) 10:127–43. doi: 10.1080/10942910600981708
18. Jiang, HZ, Li, Z, Zhong, SQ, and Zeng, ZJ. (−)-Gallocatechin Gallate: a novel chemical marker to distinguish Triadica cochinchinensis honey. Foods. (2024) 13:1879. doi: 10.3390/foods13121879
19. Hebbar, HU, Nandini, KE, Lakshmi, MC, and Subramanian, R. Microwave and infrared heat processing of honey and its quality. Food Sci Technol Res. (2003) 9:49–53. doi: 10.3136/fstr.9.49
20. Albu, A, Bora, FD, Cucu-Man, S-M, Stoleru, V, Nistor, CE, and Brumă, IS. Assessing honey quality: a focus on some physicochemical parameters of honey from Iasi County (Romania). Agriculture. (2025) 15:333. doi: 10.3390/agriculture15030333
23. Xiong, ZL, Zhao, ZY, Yuan, F, Luo, Q, Jiang, WJ, Peng, CT, et al. Key technical points for multi-box mature honey production of Apis mellifera in Jiangxi province. Apiculture of China. (2024) 75:19–20.
24. Jiang, HZ, Chen, WX, and Zeng, ZJ. Research advances of Triadica cochinchinensis honey. J Bee. (2024) 44:1–3.
25. Luo, LP, Zhang, JP, Liu, MY, Qiu, SR, Yi, SX, and Yu, WJ. Monofloral Triadica Cochinchinensis honey polyphenols improve alcohol-induced liver disease by regulating the gut microbiota of mice. Front Immunol. (2021) 12:673903. doi: 10.3389/fimmu.2021.673903
26. Jiang, HZ, Jiang, WJ, Li, Z, Zhong, SQ, He, XJ, Yan, WY, et al. Production and composition analysis of high quality Triadica cochinchinensis honey. Acta Agric Univ Jiangxiensis. (2023) 45:1473–1485. doi: 10.13836/j.jjau.2023135
27. Yi, SX, Yu, WJ, Chen, LL, Zhang, GW, Sun, QF, and Luo, LP. Effect of Triadica cochinchinensis honey supplementation on liver metabolomics and gut microbiota in naturally aging mice. Food Biosci. (2024) 61:104863. doi: 10.1016/j.fbio.2024.104863
28. Zhou, GY, Peng, CH, Li, YL, Liu, SZ, Zhang, QM, and Tang, XL. A climate change-induced threat to the ecological resilience of a subtropical monsoon evergreen broad-leaved forest in southern China. Glob Chang Biol. (2013) 19:1197–210. doi: 10.1111/gcb.12128
29. Xu, XJ, and Zhong, Z. Introduction to the plant source of Triadica cochinchinensis honey. Apiculture of China. (2024) 75:15.
30. Yan, XC, Jiang, H, Feng, L, Pan, D, and He, X. Challenges and strategies for the production of high-quality honey collected by Apis ceranacerana in Jiangxi Province. Apiculture of China. (2024) 75:19–21.
31. Scepankova, H, Pinto, CA, Paula, V, Estevinho, LM, and Saraiva, JA. Conventional and emergent technologies for honey processing: a perspective on microbiological safety, bioactivity, and quality. Compr Rev Food Sci Food Saf. (2021) 20:5393–420. doi: 10.1111/1541-4337.12848
32. Bhure, RA, Alam, M, Nanda, V, Pawar, VM, and Saxena, S. Exploring the impact of thermal processing on the quality attributes of honey: a comprehensive review. J Food Process Eng. (2025) 48:e70033. doi: 10.1111/jfpe.70033
33. Fernanda, COLM, Gabriela, MRNA, Anna Flavia, SS, Wanessa, RM, and Fábio, RPR. The role of 5-hydroxymethylfurfural in food and recent advances in analytical methods. Food Chem. (2022) 395:133539. doi: 10.1016/j.foodchem.2022.133539
34. Önür, İ, Misra, N, Barba, FJ, Putnik, P, Lorenzo, JM, Gökmen, V, et al. Effects of ultrasound and high pressure on physicochemical properties and HMF formation in Turkish honey types. J Food Eng. (2018) 219:129–36. doi: 10.1016/j.jfoodeng.2017.09.019
35. Singh, I, and Singh, S. Honey moisture reduction and its quality. J Food Sci Technol. (2018) 55:3861–71. doi: 10.1007/s13197-018-3341-5
36. Zhu, YG, Lv, HX, Jiang, MM, Zhu, WX, Jin, YZ, and Wang, XW. Effect of dual-frequency ultrasonic vacuum drying on drying characteristics and quality of honey. LWT. (2024) 213:117071. doi: 10.1016/j.lwt.2024.117071
37. Ramly, NS, Sujanto, ISR, Abd Ghani, A, Huat, JTY, Alias, N, and Ngah, N. The impact of processing methods on the quality of honey: a review. Malaysian J Applied Sci. (2021) 6:99–110. doi: 10.37231/myjas.2021.6.1.280
38. Kowalski, S, and Lukasiewicz, M. Diastase and invertase activity changes and 5-hydroxymethyl-2-furfural formation in honeys under influence of microwave irradiation. J Food Process Eng. (2017) 40:e12410. doi: 10.1111/jfpe.12410
39. Yegge, M, Fauzi, N, Talip, B, Jaafar, M, Othman, M, Yaacob, M, et al. Reduction in moisture content of dehumidified and microwave-heated stingless bee (Kelulut) honey and its quality. Mater Today Proc. (2021) 42:75–9. doi: 10.1016/j.matpr.2020.09.803
41. Tan, HW, Jin, ZX, Zhang, J, Jin, KW, Liu, Y, Chen, GG, et al. Effect of post ripening treatment on honey quality. Apiculture of China. (2023) 74:46–8.
42. Fan, Y, Du, L, Han, JM, Chen, QJ, Zhang, L, and Hou, P. Effect of post-ripening process on main quality index of gallnut honey. Food and Fermentation Industries. (2022) 48:236–40. doi: 10.13995/j.cnki.11-1802/ts.031310
43. Yang, J, Huang, X, Zeng, Q, and Lei, S. Six honeys analysis with Melissopalynology and amylase activity. J Bee. (2021) 41:16–9.
44. AOAC International. Official methods of analysis of AOAC international method 977.20: Separation of sugars in honey by liquid chromatography. Rockville, MD, USA: AOAC (2016).
45. Li, SW. The rules for the inspection of honey for import and export. SN/T 0852–2012. Beijing, China: Standards Press of China (2012).
46. Luo, LP, Qiao, N, Guo, LM, and Liu, T. Analysis of volatile components of Triadica cochinchinensis honey by Hs-spme-gc-ms. J Nanchang University (Natural Sci). (2022) 46:320–6. doi: 10.13764/j.cnki.ncdl.2022.03.008
47. Cucu, A-A, Bobiș, O, Bonta, V, Moise, AR, Pașca, C, and Cornea-Cipcigan, M. Unraveling the physicochemical, nutritional and antioxidant properties of the honey produced from the Fallopia japonica plant. Foods. (2024) 13:1959–9. doi: 10.3390/foods13131959
48. Hu, YY, Li, Z, Wang, SC, and Wu, XB. The difference in composition and nutritional potency of honey extracted by centrifugation and pressed processes. Food Qual Saf. (2023) 7:fyad018. doi: 10.1093/fqsafe/fyad018
49. Council E. Council directive 2001/110/EC of 20 December 2001 relating to honey. Off J Eur Communities L. (2002) 10:47–52.
50. Pereira, TC, Cruz, AG, Guimarães, JT, Cravotto, G, and Flores, EM. Ultrasonication for honey processing and preservation: a brief overview. Food Res Int. (2023) 174:113579. doi: 10.1016/j.foodres.2023.113579
51. Ren, CJ, Wang, K, Luo, T, Xue, XF, Wang, M, and Wu, LM. Kaempferol-3-O-Galactoside as a marker for authenticating Lespedeza Bicolor Turcz. Monofloral honey. Food Res Int. (2022) 160:111667. doi: 10.1016/j.foodres.2022.111667
52. da S, PM, Cony, G, Luciano Valdemiro, G, Ana Carolina Oliveira, C, and Roseane, F. Honey: chemical composition, stability and authenticity. Food Chem. (2016) 196:309–23. doi: 10.1016/j.foodchem.2015.09.051
53. Alaerjani, WMA, Abu-Melha, S, Alshareef, RMH, Al-Farhan, BS, Ghramh, HA, Al-Shehri, BMA, et al. Biochemical reactions and their biological contributions in honey. Molecules. (2022) 27:4719. doi: 10.3390/molecules27154719
54. Sun, JM, Zhao, HA, Wu, FH, Zhu, M, Zhang, Y, and Cheng, N. Molecular mechanism of mature honey formation by GC-MS- and LC-MS-based metabolomics. J Agric Food Chem. (2021) 69:3362–70. doi: 10.1021/acs.jafc.1c00318
55. Shapla, UM, Solayman, M, Alam, N, Khalil, MI, and Gan, SH. 5-Hydroxymethylfurfural (HMF) levels in honey and other food products: effects on bees and human health. Chem Cent J. (2018) 12:1–18. doi: 10.1186/s13065-018-0408-3
56. El Hajj, R, and Estephan, N. Advances in infrared spectroscopy and chemometrics for honey analysis: a comprehensive review. Crit Rev Food Sci Nutr. (2024) 1:1–14. doi: 10.1080/10408398.2024.2439055
57. Biagio, F, Zappalà, M, Elena, A, and Antonella, V. Effects of conditioning on HMF content in unifloral honeys. Food Chem. (2004) 85:305–13. doi: 10.1016/j.foodchem.2003.07.010
58. Alicja, S, Aneta, P, and Szczesna, T. Quality of commercially available Manuka honey expressed by pollen composition, diastase activity, and Hydroxymethylfurfural content. Foods. (2023) 12:2930. doi: 10.3390/foods12152930
59. Tosi, E, Martinet, R, Ortega, M, Lucero, H, and Ré, E. Honey diastase activity modified by heating. Food Chem. (2008) 106:883–7. doi: 10.1016/j.foodchem.2007.04.025
60. Zhang, GZ, Tian, J, Zhang, YZ, Li, SS, Zheng, HQ, and Hu, FL. Investigation of the maturity evaluation indicator of honey in natural ripening process: the case of rape honey. Foods. (2021) 10:2882. doi: 10.3390/foods10112882
61. Halagarda, M, Groth, S, Popek, S, Rohn, S, and Pedan, V. Antioxidant activity and phenolic profile of selected organic and conventional honeys from Poland. Antioxidants. (2020) 9:44–4. doi: 10.3390/antiox9010044
62. Zucchi, P, Marcazzan, G, Dal Pozzo, M, Sabatini, A, Desalvo, F, and Floris, I. Il contenuto di etanolo nel miele per la valutazione di processi fermentativi. APOidea. (2006) 3:18–26. Available at: https://cris.unibo.it/handle/11585/27841
63. Żak, N, and Wilczyńska, A. The importance of testing the quality and authenticity of food products: the example of honey. Foods. (2023) 12:3210. doi: 10.3390/foods12173210
64. Zhang, XQ, Zhou, WL, Zhang, CL, Xi, FG, Xia, XC, et al. A concise analysis of the biological activities of three medicinal nectar plants and their corresponding honeys in Jiangxi Province. Special Econ Animals Plants. (2023) 26:22–27+33.
65. Ruisinger, B, and Schieberle, P. Characterization of the key aroma compounds in rape honey by means of the molecular sensory science concept. J Agric Food Chem. (2012) 60:4186–94. doi: 10.1021/jf3004477
66. Li, HY, Liu, ZL, Shuai, MY, Song, MS, Dong, Q, Peng, WJ, et al. Characterization of Evodia Rutaecarpa (Juss) Benth honey: volatile profile, odor-active compounds and odor properties. J Sci Food Agric. (2024) 104:2038–48. doi: 10.1002/jsfa.13088
67. Cuevas-Glory, LF, Pino, JA, Santiago, LS, and Sauri-Duch, E. A review of volatile analytical methods for determining the botanical origin of honey. Food Chem. (2007) 103:1032–43. doi: 10.1016/j.foodchem.2006.07.068
68. Mohamed, AAM, Özlem Kılıç, B, Mohamed, MAF, and Serkan, S. Aroma active compounds of honey: analysis with GC-MS, GC-O, and molecular sensory techniques. J Food Compos Anal. (2024) 134:106545. doi: 10.1016/j.jfca.2024.106545
69. Min Jeong, K, Keup-rae, K, Keono, K, Aria, GM, Chuleui, J, Sukjun, S, et al. Metabolomic analysis reveals linkage between chemical composition and sensory quality of different floral honey samples. Food Res Int. (2023) 173:113454–4. doi: 10.1016/j.foodres.2023.113454
70. Guo, J, Yu, ZH, Liu, MY, Guan, MD, Shi, A, Hu, YD, et al. Investigation on the volatiles and aromatic characteristic of raw Puerh tea with different storage durations by headspace solid-phase microextraction combined with gas chromatography-mass spectrometry and odor activity value analysis. Res Sq. [Preprint]. (2023) Available at: https://www.researchsquare.com/article/rs-3214856/v1 (Accessed August 03, 2023).
71. Li, HX, Liu, ZL, Song, MS, Jiang, AL, Lang, Y, and Chen, LZ. Aromatic profiles and enantiomeric distributions of volatile compounds during the ripening of Dendropanax Dentiger honey. Food Res Int. (2024) 175:113677. doi: 10.1016/j.foodres.2023.113677
72. Shi, Z, Yang, X, H, LI, Zhou, S, Hu, W, Yi, Z, et al. Changes in physicochemical indexes and volatile components during the ripening process of gallnut honey. Sci Technol Food Ind. (2024) 46:1–11. doi: 10.13386/j.issn1002-0306.2024080368
73. Li, HX, Lang, YN, Liu, ZL, Song, M, Jiang, A, and Li, N. Dynamic variation in the aroma characteristics of Rhus Chinensis honey at different stages after capping. Food Chem. (2024) 449:139226. doi: 10.1016/j.foodchem.2024.139226
74. Gao, YF, Zhou, ZX, Wang, MJ, and Zhang, YH. Volatile markers for unifloral safflower honey: an untargeted and targeted metabolomics analysis. Food Chem. (2025) 471:142734. doi: 10.1016/j.foodchem.2024.142734
75. Yu, WJ, Sun, FJ, Xu, RX, Cui, M, Liu, YQ, and Xie, QY. Chemical composition and anti-inflammatory activities of Castanopsis honey. Food Funct. (2023) 14:250–61. doi: 10.1039/D2FO02233H
76. Chambers, E IV, and Koppel, K. Associations of volatile compounds with sensory aroma and flavor: the complex nature of flavor. Molecules. (2013) 18:4887–905. doi: 10.3390/molecules18054887
77. Rahman, MA, Hossain, MM, and Barman, DN. “Organic acids in honey.” In: Khalil MI, editor. Honey: composition and health benefits. Hoboken, NJ: Wiley Press (2023) 102–12.
78. Wang, TH, Zhang, SB, Zhang, HM, Zhao, GY, Li, XM, Wei, YH, et al. Determination of volatile components in buckwheat honey and correlation analysis with honey maturity. Food Sci. (2020) 41:222–30.
79. Mărgăoan, R, Mărghitaş, LA, Dezmirean, DS, Dulf, FV, Bunea, A, et al. Predominant and secondary pollen botanical origins influence the carotenoid and fatty acid profile in fresh honeybee-collected pollen. J Agric Food Chem. (2014) 62:6306–16. doi: 10.1021/jf5020318
80. Mohammad Mijanur, R, Hussain Md, S, Siew Hua, G, and Ibrahim, K. Chemical composition and biological properties of aromatic compounds in honey: an overview. J Food Biochem. (2017) 41:e12405. doi: 10.1111/jfbc.12405
81. Liu, T, Qiao, N, Ning, FJ, Huang, XY, and Luo, LP. Identification and characterization of plant-derived biomarkers and physicochemical variations in the maturation process of Triadica Cochinchinensis honey based on UPLC-QTOF-MS metabolomics analysis. Food Chem. (2023) 408:135197. doi: 10.1016/j.foodchem.2022.135197
82. Guo, NN, Zhao, LW, Zhao, YZ, Li, QQ, Xue, XF, and Wu, LM. Comparison of the chemical composition and biological activity of mature and immature honey: an HPLC/QTOF/MS-based metabolomic approach. J Agric Food Chem. (2020) 68:4062–71. doi: 10.1021/acs.jafc.9b07604
83. Alcivar-Saldaña, JJ, Rodriguez-Monroy, MA, Carrillo-Miranda, L, and Canales-Martinez, MM. Botanical origin and biological properties of honey and Propolis from Cuautitlan, state of Mexico. Mexico Antioxidants. (2024) 13:874. doi: 10.3390/antiox13070874
84. Pasupuleti, VR, Arigela, CS, Gan, SH, Salam, SKN, Krishnan, KT, and Rahman, NA. A review on oxidative stress, diabetic complications, and the roles of honey polyphenols. Oxidative Med Cell Longev. (2020) 2020:1–16. doi: 10.1155/2020/8878172
85. Zhan, YR, Ma, MG, Chen, Z, Ma, AJ, Li, ST, and Xia, JX. A review on extracts, chemical composition and product development of walnut Diaphragma juglandis fructus. Foods. (2023) 12:3379. doi: 10.3390/foods12183379
86. Alvarez-Suarez, JM, Giampieri, F, and Battino, M. Honey as a source of dietary antioxidants: structures, bioavailability and evidence of protective effects against human chronic diseases. Curr Med Chem. (2013) 20:621–38. doi: 10.2174/092986713804999358
Keywords: honey, honey cabinet, chemical profiling, bioactivity, antioxidant activity
Citation: Jiang H, Chen W, Jiang W, Liu F, Wu X, Yan W, He X and Zeng Z (2025) Enhancing antioxidant activity and quality of Triadica cochinchinensis honey via an automated temperature-humidity controlled cabinet. Front. Nutr. 12:1641551. doi: 10.3389/fnut.2025.1641551
Edited by:
Silvia Valverde, University of Valladolid, SpainReviewed by:
Ahmed Noah Badr, National Research Centre, EgyptTrupti Rajesh Pandit, Lovely Professional University, India
Copyright © 2025 Jiang, Chen, Jiang, Liu, Wu, Yan, He and Zeng. This is an open-access article distributed under the terms of the Creative Commons Attribution License (CC BY). The use, distribution or reproduction in other forums is permitted, provided the original author(s) and the copyright owner(s) are credited and that the original publication in this journal is cited, in accordance with accepted academic practice. No use, distribution or reproduction is permitted which does not comply with these terms.
*Correspondence: Xujiang He, eHVqaWFuZ2hlQGp4YXUuZWR1LmNu; Zhijiang Zeng, YmVlczE5NjVAc2luYS5jb20=
†These authors have contributed equally to this work