 Xinyi DuYan ZhaoLu Ding
 Fei HuangWei RenZongjie Ma
 Mingxia Zhu
 Guiqin Liu
 Muhammad Zahoor KhanChangfa Wang
 Miaomiao Zhou*
 Mengmeng Li*
- School of Agriculture and Biology, Liaocheng Research Institute of Donkey High-Efficiency Breeding and Ecological Feeding, Liaocheng University, Liaocheng, China
Introduction: The flavor is one of the important qualities of milk, which the effect of roughage on the composition of volatile compounds (VOCs) in donkey milk is unclear.
Methods: This study comprehensively analyzed the VOCs of milk from donkeys fed with corn straw (G1), wheat hulls (G2), or wheat straw (G3) using GC-lMS combined with multivariate analysis.
Results: A total of 43 VOCs were identified in donkey milk including 27.91% esters, 25.58% ketones, 18.60% aldehydes, and 16.28% alcohols. The levels of esters and aldehydes were significantly higher in the G1 group than in the G2 and G3 groups, whereas the opposite was true for alkenes. The 13 VOCs with relative odor activity value >1 were the major characteristic flavor compounds of donkey milk, mainly thiocyanic acid methyl ester, acetic acid ethyl ester, and hexanal. The VOCs in the milk from donkeys fed with corn straw (G1), wheat hulls (G2), or wheat straw (G3) were well differentiated using two-dimensional, difference, three dimensional spectra, and fingerprint gallery plots. A total of 23 different VOCs were identified as potential markers to distinguish the milk of donkeys fed with different roughage, including 2-acetylpyrrole, benzaldehyde-dimer, and hexanal-monomer.
Conclusion: Our study indicates that the VOCs in donkey milk are influenced by different roughage fed to donkeys and provided a theoretical basis for the regulation of VOCs in donkey milk by roughages.
1 Introduction
As a fundamental nutritional source globally, milk consumption and dairy product utilization have seen unprecedented growth since the beginning of the twenty-first century. As consumers seek dairy products with high nutritional value and diversity, donkey milk has emerged as a notable option. Distinguished by its rich nutritional profile and unique flavor, donkey milk has garnered significant attention in recent years (1). It is recognized as a high-quality dairy product, rich in essential nutrients such as vitamin C, lysozyme, whey proteins, and polyunsaturated fatty acids (PUFAs). Furthermore, donkey milk is associated with several health-promoting properties, including anti-inflammatory, antibacterial, antioxidant, and anti-diabetic effects (2–4). Additionally, donkey milk has a pleasantly creamy, slightly sweet flavor with a long-lasting aftertaste (5). As a result, it is favored by some consumers and has emerged as one of the preferred choices in the dairy market.
Flavor, a complex combination of taste and aroma, plays a crucial role in consumer preference (6). The formation of flavor is influenced by volatile compounds (VOCs), which include aldehydes, ketones, esters, alcohols, acids, hydrocarbons, and nitrogen-containing compounds, among others (7, 8). VOCs in food products arise from both intrinsic odors and chemical reactions during processing, such as Maillard reaction, caramelization, oxidation of lipids, carbohydrate degradation, and degradation of proteins (9). In milk, the primary nutrients—proteins, fats, and carbohydrates—are influenced by various factors including breed, diet, and seasonality (10). Roughage, an important component of herbivore feed, plays a key role in shaping both the composition and flavor of milk (11). For example, a study found that substituting alfalfa with red clover as the sole feed reduced the production of milk, fat, protein, and lactose (12). Similarly, replacing grass silage with corn silage altered the fatty acid composition of milk, decreasing n-3 PUFA concentrations and increasing n-6 PUFA levels, thus raising the n-6/n-3 PUFA ratio (13). The type of feed can influence the sensory attributes of milk, either directly through the transfer of VOCs or indirectly via non-volatile substrates that serve as VOC precursors (14). However, there is limited research on how roughage affects the VOCs of donkey milk.
Gas chromatography-ion mobility spectrometry (GC-IMS) is an advanced method for analyzing VOCs (15), providing benefits like enhanced sensitivity, fast detection, ease in operation, and cost-effectiveness. Moreover, in food flavor analysis, it is also considered a powerful tool (16). Recent studies have employed GC-IMS to examine VOCs in raw cow milk from different regions in China (8). Additionally, principal component analysis (PCA) in combination with GC-IMS has been employed to identify VOCs associated with the spoilage of yak, cattle-yak, and cow milk during refrigeration (17). Furthermore, GC-IMS and chemometric analysis have been used to differentiate VOC profiles between cow milk powder and powders from horse, donkey and camel milk (18). The impact of different drying methods on VOCs in yak milk powder has also been investigated using GC-IMS and PCA, comparing spray drying and freeze-drying techniques (19). Building upon these studies, the present work aims to examine the influence of roughage on the VOC profile of donkey milk, employing GC-IMS and multivariate statistical methods. The findings of this study will enhance the understanding of how roughage influences the aroma profile of donkey milk, offering a theoretical basis for regulating VOCs in donkey milk through dietary interventions.
2 Materials and methods
2.1 Sample collection
The Institutional Animal Care and Use Committee of Liaocheng University approved all animal experiments under approval number: 2023022706. Raw milk samples were obtained from 27 healthy, prolific female donkeys, 5 years of age (60 ± 15 days into lactation and 286 ± 25 kg body weight). The female donkeys were randomly divided into three groups (9 donkeys in each group) and fed three different types of roughage. The approximate composition of the three types of roughage—corn straw, wheat hulls and wheat straw—are shown in Table 1. The dry matter was determined by direct drying method. The moisture in the diet was evaporated in the drying oven, and then the dry matter content was calculated. Crude protein was determined by Kjeldahl method. Crude fat was determined by oil gravimetric method. The determination of crude ash is to obtain the residue after the sample is burned at 550 °C. The residue is expressed by mass fraction, that is, the content of crude ash in the sample. Neutral detergent fiber and acid detergent fiber were determined by detergent fiber analysis. Calcium was determined by potassium permanganate titration. Phosphorus was determined by molybdenum yellow spectrophotometry. The basic dietary formulation of the diets was as follows: 80.00% roughage (G1: Corn straw; G2: Wheat wells; G3: Wheat straw), 15.50% corn, 3.10% soybean, 1.20% premix and 0.20% salt. The approximate analysis of the diets was as follows: G1 (dry matter: 95.49%, crush ash: 11.50%, crush protein: 6.30%, crush fat: 2.66%), G2 (dry matter: 93.53%, crush ash: 11.14%, crush protein: 6.50%, crush fat: 2.33%), G3 (dry matter: 91.48%, crude ash: 12.06%, crude protein: 6.12%, crude fat: 2.31%). Except for the roughage, the other feed components were the same, and the donkeys had free access to water. The Donkeys were housed in the same semi-dense system and fed twice a day (09:00, 16:00). The experiment lasted 6 weeks, with the first 2 weeks as the study period and the last 4 weeks as the formal period. At the end of the study, milk samples were collected from each donkey (10:00). The milk was immediately frozen and maintained at −80 °C until analysis using GC-IMS.
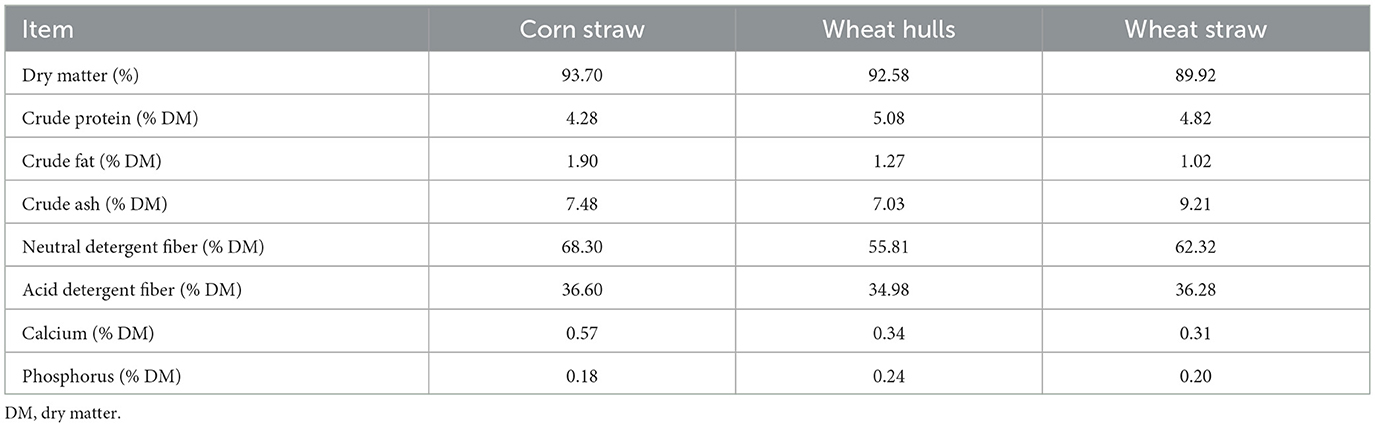
Table 1. Roughage proximate composition.
2.2 GC-IMS
The analysis of VOCs present in donkey milk was conducted using FlavorSpec® (Gesellschaft für Analytische Sensorysteme GmbH, G.A.S., Dortmund, Germany) equipped with an autosampler unit (CTC-PAL, CTC Analytics AG, Zwingen, Switzerland). Nothing is added to the blank sample. Donkey milk samples were thawed at 4 °C. A 5 mL sample of donkey milk was placed in a 20 mL headspace glass bottle and incubated at 60 °C for 15 min while rotating at 500 rpm. Then, 500 μL of headspace gas was automatically injected into a heated injector set at 85 °C. The temperature of the gas chromatography column was set to 40 °C, and nitrogen gas (purity ≥ 99.999%) was used to drive the headspace to the capillary column (MXT-5, 15 m × 0.53 mm × 1.0 μm). The carrier gas flow program was as follows: increase to 2 mL/min within 0–2 min, to 20 mL/min within 2–10 min, and finally to 100 mL/min within 10–20 min. The drift tube of the IMS instrument is 9.8-cm long, with drift temperatures of 60 °C and 45 °C, respectively. The drift tube voltage was set to 5 kV and the drift gas was nitrogen (purity ≥ 99.999%) with a flow rate of 150 mL/min. 3H ionization was performed in positive ion mode.
2.3 VOCs analysis
The VOCs data of donkey milk were collected and analyzed using the VOCal instrument analysis software, the GC-IMS library, and built-in plugins (Reporter and Gallery Plot). VOCal, the National Institute of Standards and Technology (NIST), and the built-in GC-IMS database in the software were used for qualitative analysis of VOCs. All samples were analyzed in triplicate. N-ketone C4-C9 (Sinopharm Chemical Reagent Beijing Co., Ltd., China) was used as an external reference to compare the retention indices (RIs) of VOCs of the samples under the same conditions. The Reporter plugin is used to compare spectral differences between samples. The Gallery Plot plugin is used to compare fingerprints of different samples and analyze VOCs between different samples. The key flavor compounds refer to compounds with relative odor activity values (ROVA) ≥ 1. In ROAV calculation, it is not necessary to distinguish haploid and diploid of the same VOCs, and the concentration is directly combined and calculated based on the threshold of monomer. The relative content is calculated by area normalization method. When calculating the peak area or peak area percentage, the level of the compound does not mean its quantity, and the amounts or concentration of the compound cannot be calculated. The ROAVmax of the compound that contributes the most to the aroma components is defined as 100, and the other ROAVs of the remaining components are calculated according to the following formula. The relative content was calculated by area normalization method.
Ci represent the relative content (%) of each VOC, relative content (%) = peak area of the substance / total peak area of all volatile substances × 100; Cmax represent the relative content (%) of the compound that contributes the most to VOC content; Ti represent the threshold (μg/kg) in water of each VOC; Tmax represent the aroma threshold (μg/kg) in water of the compound that contributes the most to VOC content.
2.4 Statistical analysis
SPSS version 21.0 (SPSS Inc., Chicago, IL, USA) was used for data processing. One-way analysis of variance (ANOVA) followed by Tukey's test was performed for comparisons. Results are expressed as mean ± standard error of mean (SEM, n = 9), with significance set at P < 0.05. The differential VOCs were identified using criteria of variable importance in projection (VIP) > 1 and P < 0.05. GraphPad Prism 9.0 (Graph-Pad Software, Inc.) was used to visualize data statistical results, while MetaboAnalyst 5.0 (https://www.metaboanalyst.ca/) online software was used for orthogonal partial least squares discriminant analysis (OPLS-DA), and heatmap analysis. In metaboanalyst, the study used sum normalization, logarithmic transformation and Pareto scaling for data preprocessing. The relative intensity after the above standardized steps is standardized intensity, which is used to ensure that the comparison of VOCs differences between different dietary groups is fair and repeatable.
3 Results
3.1 VOC profiles
A total of 43 VOCs were detected in donkey milk, as illustrated in Figure 1a and detailed in Table 2. These VOCs were categorized into eight groups: 12 esters, 11 ketones, 8 aldehydes, 7 alcohols, 1 pyrrole, 1 alkene, 1 acid, and 2 unidentified compounds, accounting for 27.91%, 25.58%, 18.60%, 16.28%, 2.33%, 2.33%, 2.33%, and 4.65% of the total, respectively (Figures 1b, c). Ketones and esters were the most prevalent VOCs, followed by alcohols and aldehydes (Figure 1d). Significantly higher levels of esters and aldehydes were found in the G1 group compared to both G2 and G3 groups (P < 0.05 and P < 0.001, respectively). The alcohols level was significantly higher in G1 group than G2 group (P < 0.05). In contrast, alkene levels were significantly elevated in the G3 group relative to both the G1 and G2 groups, with the G2 group also exhibiting significantly higher alkene levels than the G1 group (P < 0.001). Additionally, the pyrrole level was significantly reduced in the G3 group compared to both the G1 and G2 groups (P < 0.05).
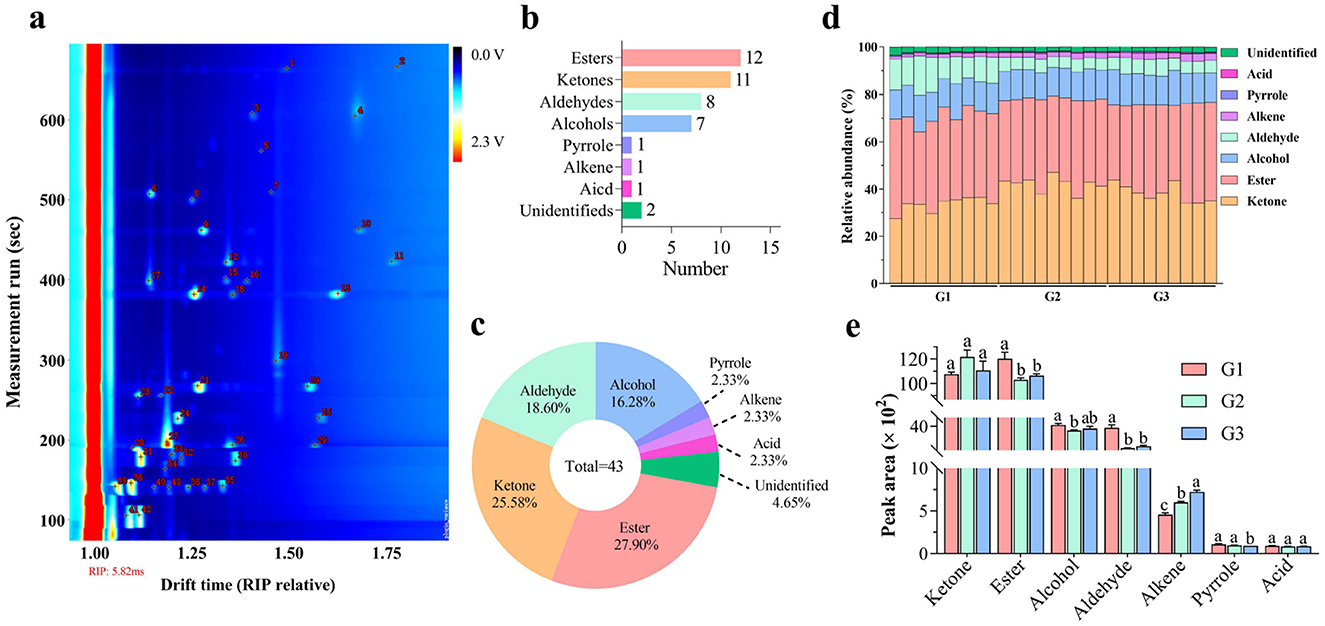
Figure 1. VOC profiles of different donkey milks. Number of VOCs (a). Number (b) and percentage (c) of VOC categories. Relative abundance (d) and concentration (e) of VOC classes in donkey milk. Data presented as mean ± standard error of mean (SEM) (n = 9), where different letters indicate significant difference (P < 0.05). RIP, reactive ion peak; G1, corn straw; G2, wheat hulls; G3, wheat straw.
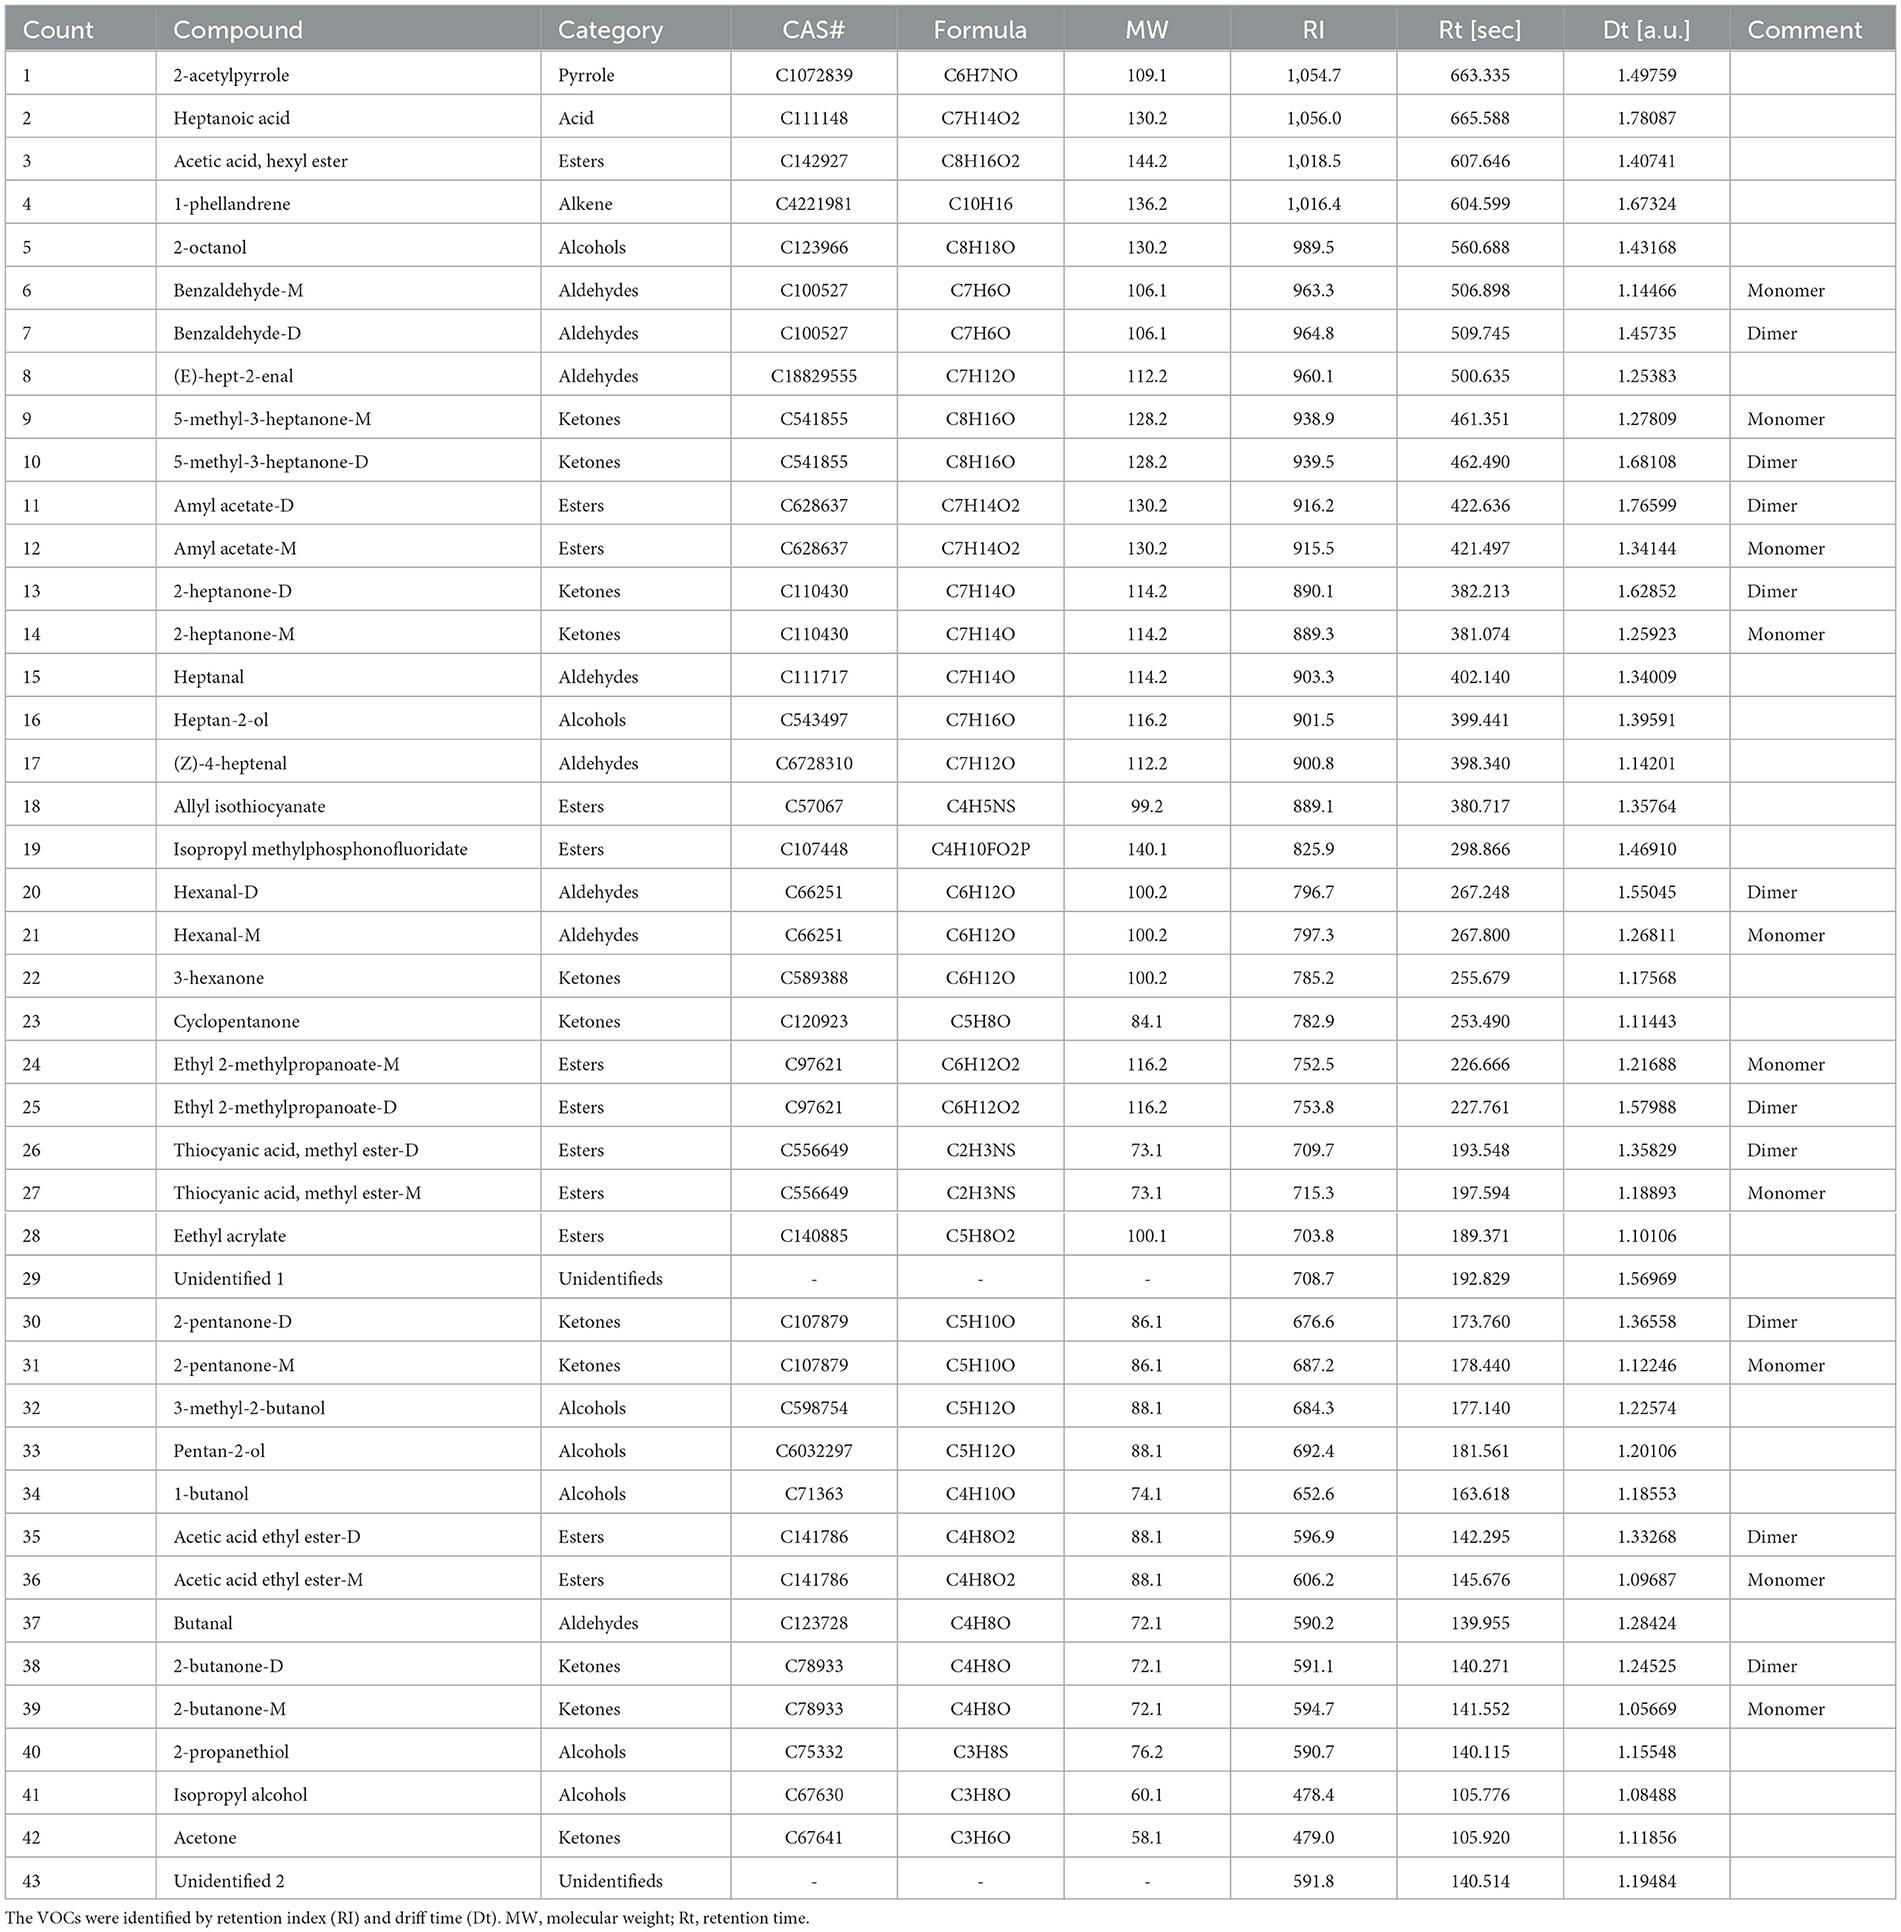
Table 2. Information on VOCs in donkey milk.
3.2 Characteristic VOCs in donkey milk
Thirteen characteristic VOCs with ROAVs greater than 1 were identified in donkey milk, as shown in Figure 2. These compounds included (E)-hept-2-enal, amyl acetate, (Z)-4-heptenal, heptanal, allyl isothiocyanate, 2-heptanone, hexanal, 3-hexanone, thiocyanic acid methyl ester, 2-pentanone, acetic acid ethyl ester, butanal, 2-butanone. The identified VOCs were classified into three categories: five aldehydes, four esters, and four ketones. Among these, Thiocyanic acid methyl ester, acetic acid ethyl ester, and hexanal were found to make the most significant contributions to the overall flavor profile of donkey milk. Additionally, the ROAVs of (E)-hept-2-enal, (Z)-4-heptenal, heptanal, acetic acid ethyl ester and butanal in G2 and G3 groups were significantly lower than those in G1 group, whereas the opposite was true for allyl isothiocyanate, 2-heptanone, hexanal, 3-hexanone and thiocyanic acid methyl ester (P < 0.001). The ROAVs of 2-pentanone (P < 0.001) and 2-butanone (P < 0.05) in G2 group were significantly lower than that in G1 and G3 groups. The ROAV of amyl acetate in group G3 was greater than that in groups G2 and G1, and the ROAV in group G2 was greater than that in group G1 (P < 0.001).
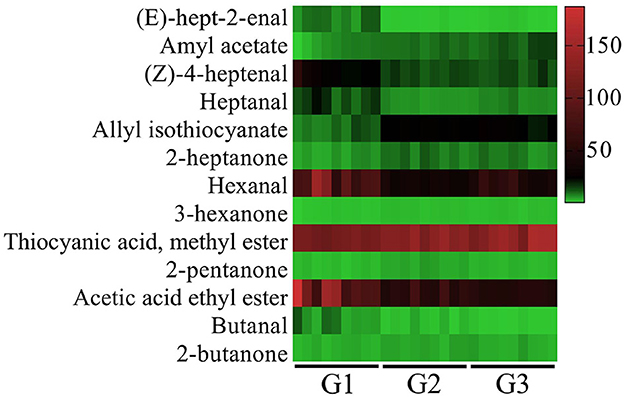
Figure 2. Relative odor activity value (ROAVs ≥ 1) of VOCs in donkey milk. G1, corn straw; G2, wheat hulls; G3, wheat straw.
3.3 Comparison of VOCs
As shown in Figure 3, the VOC profiles of donkey milk from three distinct groups were visually represented using two-dimensional spectra, difference spectra, and three-dimensional spectra (Figures 3a–c). The two-dimensional spectra of G1 was chosen as the reference, and the two-dimensional spectra of G2 and G3 were subtracted from the reference. Red signifies a concentration greater than the reference, and blue signifies a concentration lower than the reference. The red and blue spots in the differential spectra of G2 and G3 indicate significant differences from G1. Significant differences in the VOCs were observed between each group of donkey milk, as evidenced by the analysis of the fingerprint gallery plots (Figure 3d). Furthermore, compounds such as pentan-2-ol, acetic acid ethyl ester-monomer, butanal, acetic acid ethyl ester-dimer, ethyl 2-methylpropanoate-dimer, ethyl 2-methylpropanoate-monomer, hexanal-dimer, heptan-2-ol, (Z)-4-heptenal, (E)-hept-2-enal, hexanal-monomer, heptanal, and 2-octanol exhibited distinct signals, indicating the presence of differential components in the fingerprint regions of the G1 group compared to the other two groups (Figure 3d).
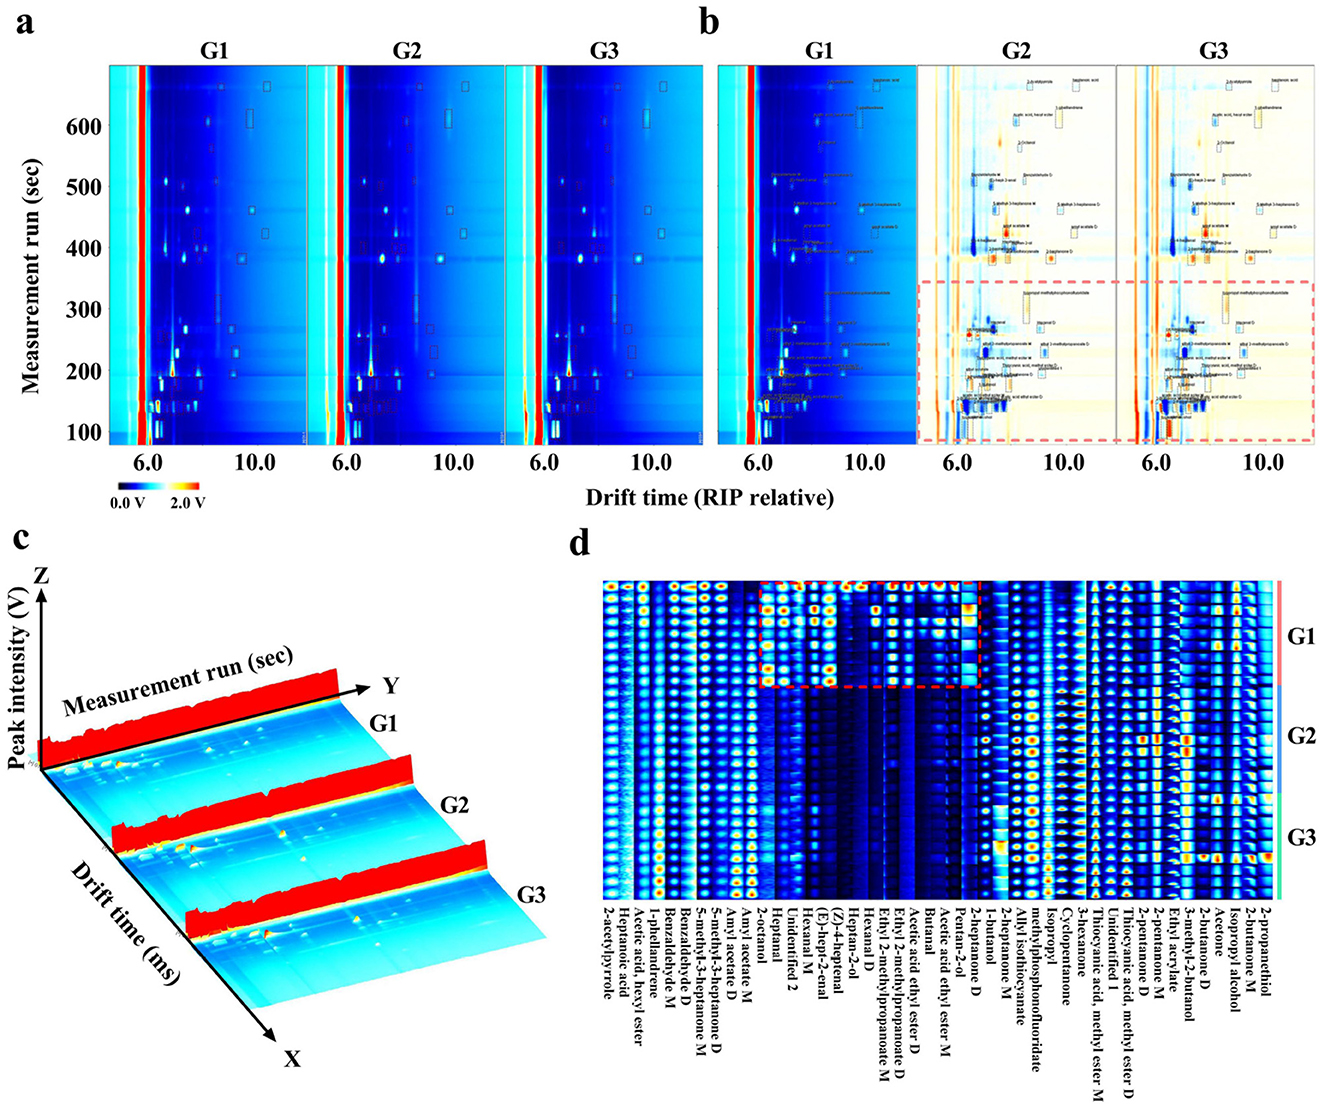
Figure 3. Comparison of VOCs of three types of donkey milk. Two-dimensional (a), difference (b), three-dimensional spectra (c) and fingerprint (d) of VOCs in donkey milk samples. G1, corn straw; G2, wheat hulls; G3, wheat straw.
3.4 Multivariate analysis of VOCs
As shown in Figure 4, the donkey milk samples were effectively discriminated using OPLS-DA (Figure 4a). The OPLS-DA model demonstrated robustness, accuracy, and no overfitting, with satisfactory validation results (Figure 4b). The VIP analysis of the OPLS-DA model, presented in Table 3, identified 23 distinct VOCs with VIP values greater than 1 across the three groups of donkey milk. These VOCs were classified into six categories: 9 esters, 8 aldehydes, 2 alcohols, 2 ketones, 1 alkene, and 1 pyrrole (Table 3). A comparison of the VOC levels revealed that the concentrations of (E)-hept-2-enal, (Z)-4-heptenal, 2-octanol, 5-methyl-3-heptanone-dimer, 5-methyl-3-heptanone-monomer, acetic acid, hexyl ester, benzaldehyde-monomer, heptanal, hexanal-dimer, acetic acid ethyl ester-monomer, butanal, ethyl 2-methylpropanoate-dimer, and pentan-2-ol were significantly lower in groups G2 and G3 compared to group G1 (P < 0.05). Furthermore, significantly higher levels of 1-phellandrene, thiocyanic acid methyl ester-monomer, and allyl isothiocyanate were found in G2 and G3 groups compared to G1Additionally, the levels of 2-acetylpyrrole, benzaldehyde-dimer, acetic acid ethyl ester-dimer, and ethyl 2-methylpropanoate-monomer were significantly higher in G1 than in G2 and G3, with the G2 group showing higher levels than G3 (P < 0.05). The levels of isopropyl methylphosphonofluoridate and amyl acetate-dimer were significantly elevated in G3 compared to G1 and G2 (P < 0.05), with G2 showing higher levels than G1. The hexanal-monomer levels were significantly higher in G1 compared to G2 and G3, and G3 exhibited significantly higher levels than G2 (P < 0.05).
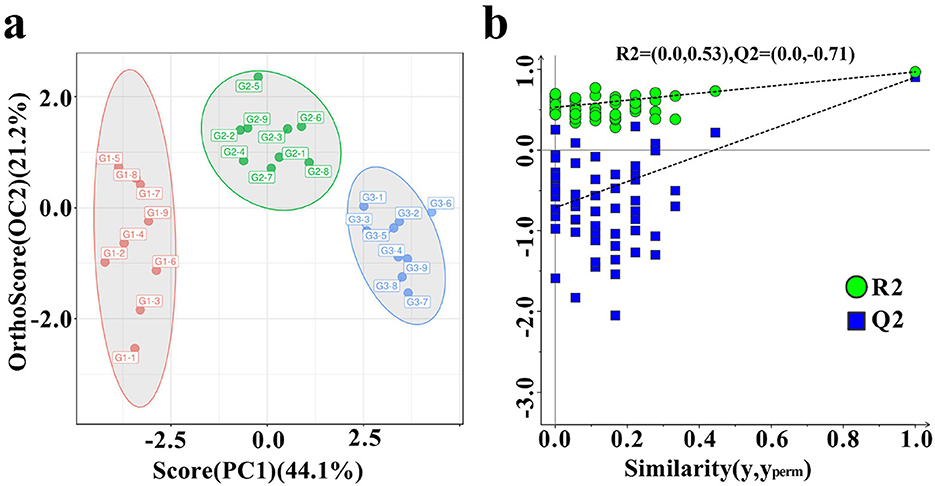
Figure 4. Differences in VOCs in three types of donkey milk. Orthogonal partial least squares discriminant analysis (OPLS-DA) score plot (a) and corresponding OPLS–DA validation plot (b) of donkey milk VOCs data. G1, corn straw; G2, wheat hulls; G3, wheat straw.
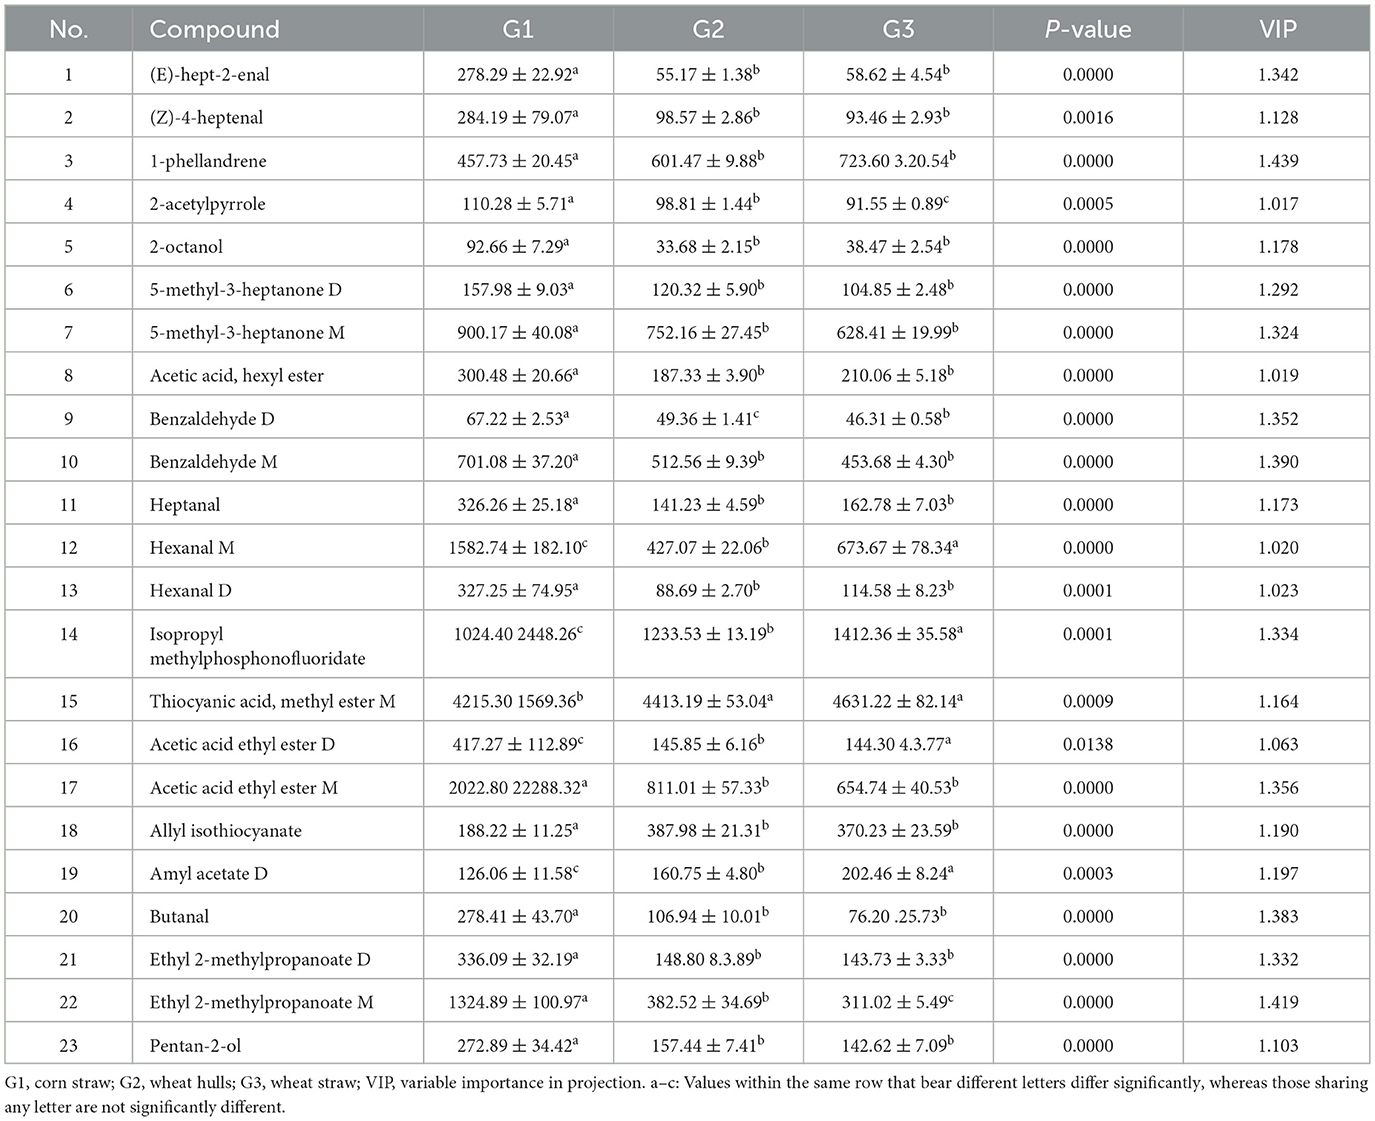
Table 3. Difference of VOCs of donkey meat fed with three different diets (standardized intensity).
4 Discussion
Flavor is a key determinant of consumer preferences, representing one of the fundamental characteristics of milk quality. It is primarily defined by the specific composition of VOCs, which contribute significantly to its sensory profile (20, 21). The main VOCs that contribute to the unique flavor of milk include alcohols, aldehydes, ketones, and esters (22). Flavoromics technologies, particularly GC-IMS, have emerged as effective tools for detecting VOCs in food. This method offers advantages such as simplicity, high sensitivity, rapid detection, and no sample preparation (19). The VOCs in donkey milk, sourced from animals fed different roughages, were comprehensively characterized and compared using GC-IMS. A total of 43 VOCs were identified in donkey milk, consistent with the 34 VOCs reported in yak milk from various regions of Gannan using GC-IMS (6). The lower number of VOCs in donkey milk can be attributed to the reduced moisture content of whole milk powder, which typically results in a higher number of VOCs (23). At the same time, VOCs are more abundant in whole milk powder due to the reduced moisture content (24). Additionally, GC-IMS is more adept at detecting low molecular weight compounds compared to GC-MS, which enhances its sensitivity for certain VOCs (25). The predominant VOCs in donkey milk were esters, ketones, aldehydes, and alcohols, with ketones and esters exhibiting the highest concentrations. These findings align with previous GC-IMS studies on donkey milk at various lactation stages (26). Notably, 12 esters were identified in donkey milk, a significantly higher number compared to the 3 esters found in raw cow milk (8). This suggests that esters are particularly abundant in donkey milk. Furthermore, the levels of esters, aldehydes, and pyrroles were significantly higher in milk from donkeys fed corn straw, compared to those fed wheat hulls and wheat straw. The production of esters and aldehydes is closely linked to the free fatty acids present in milk fat, with higher fatty acid levels leading to increased ester and aldehyde production (27). It has also been shown that the lipid composition of roughage influences the lipid profile of donkey milk (28). Higher crude fat content in the diet reduces the proportion of short-chain fatty acids but increases the proportion of monounsaturated and polyunsaturated fatty acids (29).Therefore, the elevated levels of esters and aldehydes in donkey milk may be attributed to the higher crude fat level of the corn straw provided in this study. In this investigation, pyrrole refers exclusively to 2-acetylpyrrole, a condensation product formed between dicarbonyl compounds and ammonia (30). Lactose present in milk serves as a precursor for the generation of α-dicarbonyl compounds (31). A previous study revealed that partial replacement of short alfalfa hay with corn silage increased dry matter intake, which in turn improved milk yield and yields of milk protein and lactose (32). In this study, the elevated level of pyrroles in donkey milk may be attributed to the higher dry matter level of the corn straw provided. Conversely, the concentration of alkenes was lower in milk from donkeys fed corn straw, especially 1-phellandrene. There is a positive correlation between 1-phelandrene in milk and terpene content in botanical composition of pasture (33). The lower level of alkene in donkey milk may be attributed to the lower alkene level of the corn stover provided in this study.
The contribution of each VOC to the overall flavor can be determined using ROAV, and VOCs with ROAV > 1 represents the key flavor compounds (34). In this study, 13 key flavor compounds were identified in donkey milk, including 2-heptanone, hexanal, acetic acid ethyl ester, and butanal. A previous study has similarly identified these compounds as key contributors to the flavor of cow milk (27), suggesting a degree of similarity in flavor characteristics between donkey and cow milk. There seems to be a potential direct transfer of some nonterpene VOCs from feed to milk, as suggested by tentative associations (35). In addition, after Tarantaise cows changed their diet and ingested yarrow, the concentrations of monoterpenes and sesquiterpenes in milk fat gradually increased, and then declining despite continued yarrow intake (36). Therefore, VOCs in dietary components and feeding time may affect the types and contents of VOCs in animal milk, thereby affecting ROAV.
The characteristic VOCs in donkey milk primarily consisted of five aldehydes, four esters, and four ketones. Aldehydes and ketones are particularly notable for their low odor thresholds and are commonly found in dairy products (37). Aldehydes are mainly derived from the Maillard reaction and fatty acid oxidation processes (38). In this study, the fatty aldehydes identified in donkey milk included (E)-hept-2-enal, (Z)-4-heptenal, heptanal, hexanal, and butanal. These compounds, particularly in low concentrations, are associated with green, herbaceous, and grassy aromas (39). Among these, hexanal, which ranked third in terms of ROAV, imparts a grassy, green, and slightly vinegar-like aroma (40). Ester compounds, characterized by low perception thresholds, are crucial to the flavor of food, contributing fruity, floral, and sweet flavors (41). In milk, esters primarily arise from esterification reactions between free fatty acids and alcohols within milk fat (18). In this study, key ester compounds identified in donkey milk included acetyl acetate, allyl isothiocyanate, thiocyanic acid methyl ester, and acetic acid ethyl ester. Notably, acetic acid ethyl ester and thiocyanic acid methyl ester were the most influential in the flavor profile of donkey milk. Acetic acid ethyl ester, which has a high perception threshold, contributes a distinct pineapple smell, while thiocyanic acid methyl ester imparts a garlic aroma (41, 42).
The VOCs differences across samples can be visualized through GC-IMS spectral analyses, including two-dimensional, difference, and three-dimensional spectra. These visualizations facilitate the intuitive and specific comparison of VOC levels between samples, with fingerprints serving as a particularly useful tool for this purpose (19). In the present study, significant spectral differences were observed in donkey milk from animals fed different roughages. This was verified by fingerprint analysis, which revealed notable variations in specific VOCs such as ethyl 2-methylpropanoate, butanal, and acetic acid ethyl ester, particularly in milk from donkeys fed corn straw compared to those fed wheat hulls and wheat straw. The VOCs capable of directly influencing flavor may be absorbed within the digestive tract, particularly in the rumen and or intestine, prior to diffusing into the blood and being conveyed to the mammary gland, or they may enter via the pulmonary route, being inhaled into the lungs, entering the bloodstream, and ultimately diffusing into the mammary gland (36). The rumen microbiota is responsible for the production of odd- and branched-chain fatty acids in milk fat (43). Divergent diets alter rumen fermentation patterns, thereby driving variations in the rumen microbial community structure (44). Feed fermentation hinge on intrinsic feed properties, with wheat straw and wheat hulls showing equal in vitro dry-matter disappearance that remains lower than corn stover. Therefore, the properties between wheat straw and wheat husk are similar, while both have significant differences in properties compared to corn straw (45). A study indicated that the low nutrient digestibility of wheat straw may be due to its higher lignin content compared to corn straw, as well as its lower acid detergent fiber content, which is consistent with this study (46). Previous studies have successfully employed fingerprint analysis using GC-IMS to monitor VOC dynamics in dairy products, such as the changes during the ripening of cream cheese (47) and the impact of fatty acid composition on VOCs in pasteurized milk stored at 4 °C (27). Multivariate analysis techniques, including heatmap visualization, PCA, and OPLS-DA, are commonly used to further analyze sample differences (48, 49). For example, the classification of sorghum types has been achieved through GC-IMS combined with multivariate analysis techniques, where OPLS-DA successfully distinguished significant sample variations within varieties (50). In the present study, OPLS-DA effectively distinguished the differences in VOCs across donkey milk samples. The VIP value was used to measure the contribution of each variable to the model classification, with a VIP > 1 indicating a significant contribution (47, 51). Statistically, a P-value below the critical threshold of 0.05 typically signifies a significant result, whereas a P-value above this threshold suggests a lack of significance (52). A total of 23 different VOCs were identified in donkey milk, with compounds such as ethyl 2-methylpropanoate, butanal, and acetic acid ethyl ester showing consistent results with the fingerprint analysis. These findings indicate that the VOC profile of donkey milk can undergo significant changes depending on the roughage fed to the animals, aligning with previous research on the effects of forage types on milk composition (35).
5 Conclusion
Flavor, especially VOCs, is one of the key factors directly affecting consumer choice and acceptance. Some feeds may introduce unpleasant odors or enhance pleasant odors, which in turn guides the optimization of feed formulations and avoids flavor defects in donkey milk. The effects of different types of roughage on VOCs of donkey milk were analyzed and compared using GC-IMS and multivariate analysis. A total of 43 VOCs detected in seven categories. Of these, 13 compounds, including thiocyanic acid methyl ester, acetic acid ethyl ester, and hexanal, were selected as characteristic flavor compounds. Additionally, 23 VOCs were identified as potential markers to differentiate the milk of donkeys fed different types of roughage. The VOCs, particularly esters and aldehydes, in donkey milk were primarily influenced by the type of roughage fed to the donkeys. The outcomes of this study provide insights into how different roughage types influence VOC composition in donkey milk, offering a theoretical foundation for VOC regulation in donkey milk production.
Data availability statement
The original contributions presented in the study are included in the article/supplementary material, further inquiries can be directed to the corresponding author/s.
Ethics statement
The animal study was approved by the Institutional Animal Care and Use Committee of Liaocheng University. The study was conducted in accordance with the local legislation and institutional requirements.
Author contributions
XD: Methodology, Writing – original draft, Investigation, Conceptualization, Visualization, Data curation. YZ: Formal analysis, Investigation, Writing – original draft, Data curation, Validation. LD: Data curation, Validation, Investigation, Resources, Writing – original draft. FH: Data curation, Investigation, Writing – original draft, Resources. WR: Data curation, Resources, Writing – original draft, Investigation. ZM: Data curation, Writing – original draft, Investigation. MZhu: Writing – original draft, Data curation, Investigation. GL: Investigation, Data curation, Writing – original draft. MK: Writing – original draft, Writing – review & editing. CW: Writing – review & editing, Writing – original draft. MZho: Writing – review & editing, Supervision, Project administration. ML: Supervision, Writing – review & editing, Project administration.
Funding
The author(s) declare that financial support was received for the research and/or publication of this article. This research was funded by the National Key R&D Program of China (2022YFD1600103, 2023YFD1302004), the Shandong Provincial Natural Science Foundation (ZR2022QC130), the Shandong Province Modern Agricultural Technology System Donkey Industrial Innovation Team (SDAlT-27), the Support Program for Innovation and Technology in Universities of Shandong province (2023KJ354), and the Livestock and Poultry Breeds Project of Ministry of Agriculture and Rural Affairs (19211162).
Conflict of interest
The authors declare that the research was conducted in the absence of any commercial or financial relationships that could be construed as a potential conflict of interest.
Correction note
This article has been corrected with minor changes. These changes do not impact the scientific content of the article.
Generative AI statement
The author(s) declare that no Gen AI was used in the creation of this manuscript.
Any alternative text (alt text) provided alongside figures in this article has been generated by Frontiers with the support of artificial intelligence and reasonable efforts have been made to ensure accuracy, including review by the authors wherever possible. If you identify any issues, please contact us.
Publisher's note
All claims expressed in this article are solely those of the authors and do not necessarily represent those of their affiliated organizations, or those of the publisher, the editors and the reviewers. Any product that may be evaluated in this article, or claim that may be made by its manufacturer, is not guaranteed or endorsed by the publisher.
References
1. Derdak R, Sakoui S, Pop O L, Muresan C I, Vodnar D C, Addoum B, et al. Insights on health and food applications of equus asinus (donkey) milk bioactive proteins and peptides—an overview. Foods. (2020) 9:1302. doi: 10.3390/foods9091302
2. Li Y, Ma Q, Liu G, Wang C. Effects of donkey milk on oxidative stress and inflammatory response. J Food Biochem. (2022) 46:e13935. doi: 10.1111/jfbc.13935
3. Khan M Z, Chen W, Li M, Ren W, Huang B, Kou X, et al. Is there sufficient evidence to support the health benefits of including donkey milk in the diet? Front Nutr. (2024) 11:1404998. doi: 10.3389/fnut.2024.1404998
4. Živkov Baloš M, Ljubojević Pelić D, Jakšić S, Lazić S. Donkey milk: an overview of its chemical composition and main nutritional properties or human health benefit properties. J Equine Vet Sci. (2023) 121:104225. doi: 10.1016/j.jevs.2023.104225
5. Malissiova E, Arsenos G, Papademas P, Fletouris D, Manouras A, Aspri M, et al. Assessment of donkey milk chemical, microbiological and sensory attributes in greece and cyprus. Int J Dairy Technol. (2016) 69:143–6. doi: 10.1111/1471-0307.12245
6. Yang G, Zhang J, Dai R, Ma X, Huang C, Ren W, et al. Comparative study on nutritional characteristics and volatile flavor substances of yak milk in different regions of gannan. Foods. (2023) 12:2172. doi: 10.3390/foods12112172
7. Cheng H. Volatile flavor compounds in yogurt: a review. Crit Rev Food Sci. (2010) 50:938–50. doi: 10.1080/10408390903044081
8. Chi X, Zhang Y, Zheng N, Wang J, Liu H. Hs-gc-ims and hs-spme/gc-ms coupled with e-nose and e-tongue reveal the flavors of raw milk from different regions of china. Curr Res Food Sci. (2024) 8:100673. doi: 10.1016/j.crfs.2023.100673
9. Diez-Simon C, Mumm R, Hall R D. Mass spectrometry-based metabolomics of volatiles as a new tool for understanding aroma and flavour chemistry in processed food products. Metabolomics. (2019) 15:41. doi: 10.1007/s11306-019-1493-6
10. Schwendel B H, Wester T J, Morel P C H, Tavendale M H, Deadman C, Shadbolt N M, et al. Invited review: organic and conventionally produced milk—an evaluation of factors influencing milk composition. J Dairy Sci. (2015) 98:721–46. doi: 10.3168/jds.2014-8389
11. Kilcawley K N, Faulkner H, Clarke H J. O Sullivan M G, Kerry J P. Factors influencing the flavour of bovine milk and cheese from grass based versus non-grass based milk production systems. Foods. (2018) 7:37. doi: 10.3390/foods7030037
12. Broderick G A, Walgenbach R P, Sterrenburg E. Performance of lactating dairy cows fed alfalfa or red clover silage as the sole forage1. J Dairy Sci. (2000) 83:1543–51. doi: 10.3168/jds.S0022-0302(00)75026-0
13. Khan N A, Yu P, Ali M, Cone J W, Hendriks W H. Nutritive value of maize silage in relation to dairy cow performance and milk quality. J Sci Food Agr. (2015) 95:238–52. doi: 10.1002/jsfa.6703
14. Clarke H J, Griffin C, Rai D K. O Callaghan T F, O Sullivan M G, Kerry J P, Kilcawley K N. Dietary compounds influencing the sensorial, volatile and phytochemical properties of bovine milk. Molecules. (2020) 25:26. doi: 10.3390/molecules25010026
15. Ma C, Nie H, Liu L, Wang F, Chen Y, Zhang W, et al. Gas chromatography-ion mobility spectrometry (gc-ims) technique and its recent applications in grain research. J Sci Food Agr. (2024) 104:9093–101. doi: 10.1002/jsfa.13622
16. Wang S, Chen H, Sun B. Recent progress in food flavor analysis using gas chromatography–ion mobility spectrometry (gc–ims). Food Chem. (2020) 315:126158. doi: 10.1016/j.foodchem.2019.126158
17. Li H, Xi B, Yang X, Wang H, He X, Li W, et al. Evaluation of change in quality indices and volatile flavor components in raw milk during refrigerated storage. LWT. (2022) 165:113674. doi: 10.1016/j.lwt.2022.113674
18. Gou Y, Han Y, Li J, Niu X, Ma G, Xu Q. Discriminant analysis of aroma differences between cow milk powder and special milk powder (donkey, camel, and horse milk powder) in xinjiang based on gc-ims and multivariate statistical methods. Foods. (2023) 12:4036. doi: 10.3390/foods12214036
19. Feng D, Wang J, Ji X, Min W, Yan W. Hs-gc-ims detection of volatile organic compounds in yak milk powder processed by different drying methods. LWT. (2021) 141:110855. doi: 10.1016/j.lwt.2021.110855
20. Bertuzzi A S, McSweeney P L H, Rea M C, Kilcawley K N. Detection of volatile compounds of cheese and their contribution to the flavor profile of surface-ripened cheese. Compr Rev Food Sci F. (2018) 17:371–90. doi: 10.1111/1541-4337.12332
21. Jia W, Zhang R, Shi L, Zhang F, Chang J, Chu X. Accurate determination of volatile-flavor components in bos grunniens milk by high-throughput dynamic headspace gas chromatographic-mass spectrometry. J Chromatogr A. (2019) 1603:67–82. doi: 10.1016/j.chroma.2019.06.058
22. Wang W, Sun B, Deng J, Ai N. Addressing flavor challenges in reduced-fat dairy products: a review from the perspective of flavor compounds and their improvement strategies. Food Res Int. (2024) 188:114478. doi: 10.1016/j.foodres.2024.114478
23. Cheng Z, Mannion D T, O'Sullivan M G, Miao S, Kerry J P, Kilcawley K N. The impact of pasture and non-pasture diets on the sensory and volatile properties of whole milk powder. J Dairy Res. (2022) 89:302–15. doi: 10.1017/S0022029922000589
24. Ning M, He K, Zhang D, Liu S, Zhang Y, Min J, et al. Hs-spme-gc-ms combined with multivariate statistical analysis reveals off-flavor composition and biomarker generation mechanism of whole milk powder. J Food Compos Anal. (2025) 137:106962. doi: 10.1016/j.jfca.2024.106962
25. Qi H, Ding S, Pan Z, Li X, Fu F. Characteristic volatile fingerprints and odor activity values in different citrus-tea by hs-gc-ims and hs-spme-gc-ms. Molecules. (2020) 25:6027. doi: 10.3390/molecules25246027
26. Li M, Sun L, Du X, Zhao Y, Ren W, Man L, et al. Characterization and discrimination of donkey milk lipids and volatiles across lactation stages. Food Chem X. (2024) 23:101740. doi: 10.1016/j.fochx.2024.101740
27. Yan H, Huang W, Zhao X, Ge C, Shen Y, Liu L. Effect of fatty acid composition on the volatile compounds of pasteurized milk during low-temperature storage. Food Res Int. (2024) 195:114990. doi: 10.1016/j.foodres.2024.114990
28. Ren W, Sun M, Shi X, Wang T, Wang Y, Wang X, et al. Effects of roughage on the lipid and volatile-organic-compound profiles of donkey milk. Foods. (2023) 12:2231. doi: 10.3390/foods12112231
29. Mowete S Y, Santschi D, Kwiatkowski K, Azevedo P A, De Neve N, Fievez V, et al. Animal and farm factors affecting the fatty acid profile and amyloid a concentration of milk on quebec dairy farms. Can J Anim Sci. (2024) 105:1–11. doi: 10.1139/cjas-2024-0013
30. Wei M, Liu X, Xie P, Lei Y, Yu H, Han A, et al. Characterization of volatile profiles and correlated contributing compounds in pan-fried steaks from different chinese yellow cattle breeds through gc-q-orbitrap, e-nose, and sensory evaluation. Molecules. (2022) 27:3593. doi: 10.3390/molecules27113593
31. Nomi Y, Anazawa T, Shinzawa K, Tamura M, Matsumoto H. Identification of lactose-derived α-dicarbonyl compounds in dairy products and elucidation of their formation mechanism. J Agr Food Chem. (2024) 73:781–9. doi: 10.1021/acs.jafc.4c08966
32. Kowsar R, Ghorbani G R, Alikhani M, Khorvash M, Nikkhah A. Corn silage partially replacing short alfalfa hay to optimize forage use in total mixed rations for lactating cows. J Dairy Sci. (2008) 91:4755–64. doi: 10.3168/jds.2008-1302
33. Tornambé G, Cornu A, Pradel P, Kondjoyan N, Carnat A P, Petit M, et al. Changes in terpene content in milk from pasture-fed cows. J Dairy Sci. (2006) 89:2309–19. doi: 10.3168/jds.S0022-0302(06)72302-5
34. Sun Y, Wu Y, Liu B, Chen R, Qiao Y, Zhang Q, et al. Analysis for different flavor compounds in mature milk from human and livestock animals by gc × gc-tofms. Food Chem X. (2023) 19:100760. doi: 10.1016/j.fochx.2023.100760
35. Faulkner H. O‘Callaghan T F, McAuliffe S, Hennessy D, Stanton C, O'Sullivan M G, Kerry J P, Kilcawley K N. Effect of different forage types on the volatile and sensory properties of bovine milk. J Dairy Sci. (2018) 101:1034–47. doi: 10.3168/jds.2017-13141
36. Vialloninsta C, Martin B, Metz I V, Pradel P, Garel J P, Coulon J B, et al. Transfer of monoterpenes and sesquiterpenes from forages into milk fat. Dairy Sci. Technol. (2000) 80:635-641. 2000150 doi: 10.1051/lait:2000150
37. Spitzer J, Buettner A. Characterization of aroma changes in human milk during storage at −19 °C. Food Chem. (2010) 120:240–6. doi: 10.1016/j.foodchem.2009.10.015
38. Valero E, Villamiel M, Miralles B, Sanz J, Martinez-Castro I. Changes in flavour and volatile components during storage of whole and skimmed uht milk. Food Chem. (2001) 72:51–8. doi: 10.1016/S0308-8146(00)00203-X
39. Gioacchini A M, De Santi M, Guescini M, Brandi G, Stocchi V. Characterization of the volatile organic compounds of italian ‘fossa' cheese by solid-phase microextraction gas chromatography/mass spectrometry. Rapid Commun Mass Sp. (2010) 24:3405–12. doi: 10.1002/rcm.4782
40. Shan Q, Wan Y, Liang J, He W, Zeng J, Liang W, et al. Liu F. Hs–spme combined with gc–ms and gc–o for characterization of key aroma-active compounds in fruity and grassy peppers (capsicum chinense jacq). Food Chem X. (2024) 24:101944. doi: 10.1016/j.fochx.2024.101944
41. Niu Y, Wang P, Xiao Z, Zhu J, Sun X, Wang R. Evaluation of the perceptual interaction among ester aroma compounds in cherry wines by gc-ms, gc-o, odor threshold and sensory analysis: an insight at the molecular level. Food Chem. (2019) 275:143–53. doi: 10.1016/j.foodchem.2018.09.102
42. Zheng J, Zhang F, Zhou C, Lin M, Kan J. Comparison of flavor compounds in fresh and pickled bamboo shoots by gc-ms and gc-olfactometry. Food Sci Technol Res. (2014) 20:129–38. doi: 10.3136/fstr.20.129
43. Li F, Li Z, Li S, Ferguson J D, Cao Y, Yao J, et al. Effect of dietary physically effective fiber on ruminal fermentation and the fatty acid profile of milk in dairy goats. J Dairy Sci. (2014) 97:2281–90. doi: 10.3168/jds.2013-6895
44. Jiao C, Cui C, Qi Y, Zhang M, Zhao P, Chen S, et al. Effects of partial silage replacement with corn stover pellets on the rumen microbiota and serum metabolome of breeding cows. Front Microbiol. (2025) 16:1533851. doi: 10.3389/fmicb.2025.1533851
45. Zhang Z, Wang Y, Zhu M, Wang C. The in vitro digestion and fermentation characteristics of feedstuffs inoculated with cecal or colic fluid of dezhou donkey. J Equine Vet Sci. (2022) 110:103864. doi: 10.1016/j.jevs.2022.103864
46. Majeed F, Ahmed S, Rashid M A, Shahid M Q, Mohsin I. Effects of replacement of wheat straw with corn stover-based tmr on growth performance, behavioral characteristics, selected blood metabolites, and nutrient digestibility in beetal bucks. Trop Anim Health Pro. (2022) 54:115. doi: 10.1007/s11250-022-03114-w
47. Zheng A, Wei C, Wang M, Ju N, Fan M. Characterization of the key flavor compounds in cream cheese by gc-ms, gc-ims, sensory analysis and multivariable statistics. Curr Res Food Sci. (2024) 8:100772. doi: 10.1016/j.crfs.2024.100772
48. Du H, Chen W, Lei Y, Li F, Li H, Deng W, et al. Discrimination of authenticity of fritillariae cirrhosae bulbus based on terahertz spectroscopy and chemometric analysis. Microchem J. (2021) 168:106440. doi: 10.1016/j.microc.2021.106440
49. Jiang P, Miao X, Li J, Qi H, Shang S, Dong X. Volatile flavor characteristics of scallops (chlamys farreri) with different drying methods were analyzed based on gc-ims and gc-o-qtof. Food Chem X. (2024) 24:101960. doi: 10.1016/j.fochx.2024.101960
50. Liu M, Yang Y, Zhao X, Wang Y, Li M, Wang Y, et al. Classification and characterization on sorghums based on hs-gc-ims combined with opls-da and ga-pls. Curr Res Food Sci. (2024) 8:100692. doi: 10.1016/j.crfs.2024.100692
51. Yang X, Chen Q, Liu S, Hong P, Zhou C, Zhong S. Characterization of the effect of different cooking methods on volatile compounds in fish cakes using a combination of gc–ms and gc-ims. Food Chem X. (2024) 22:101291. doi: 10.1016/j.fochx.2024.101291
Keywords: donkeys, roughages, donkey milk, volatile compounds, GC-IMS
Citation: Du X, Zhao Y, Ding L, Huang F, Ren W, Ma Z, Zhu M, Liu G, Khan MZ, Wang C, Zhou M and Li M (2025) Characterization and discrimination of milk volatiles from donkey fed different roughages using GC-IMS. Front. Nutr. 12:1652665. doi: 10.3389/fnut.2025.1652665
Received: 24 June 2025; Accepted: 18 September 2025;
Published: 14 October 2025; Corrected: 17 October 2025.
Edited by:
Photis Papademas, Cyprus University of Technology, CyprusReviewed by:
Agnieszka Pluta-Kubica, University of Agriculture in Krakow, PolandYaxi Zhou, Chinese Academy of Agricultural Sciences, China
Copyright © 2025 Du, Zhao, Ding, Huang, Ren, Ma, Zhu, Liu, Khan, Wang, Zhou and Li. This is an open-access article distributed under the terms of the Creative Commons Attribution License (CC BY). The use, distribution or reproduction in other forums is permitted, provided the original author(s) and the copyright owner(s) are credited and that the original publication in this journal is cited, in accordance with accepted academic practice. No use, distribution or reproduction is permitted which does not comply with these terms.
*Correspondence: Miaomiao Zhou, emhvdW1tMDMyOUAxNjMuY29t; Mengmeng Li, bW1saUBsY3UuZWR1LmNu