 Zelin Zhang
 Limin Lai
 Ziping Liu
 Liping Qu
 Wenjun Zou
by Zhang, Z., Lai, L., Liu, Z., Liu, S., Qu, L., and Zou, W. (2025). Front. Nutr. 12:1650536. doi: 10.3389/fnut.2025.1650536
There was a mistake in Figure 1 as published. The Figure 1 part label images C & D were missing. The corrected figure and its caption appear below.
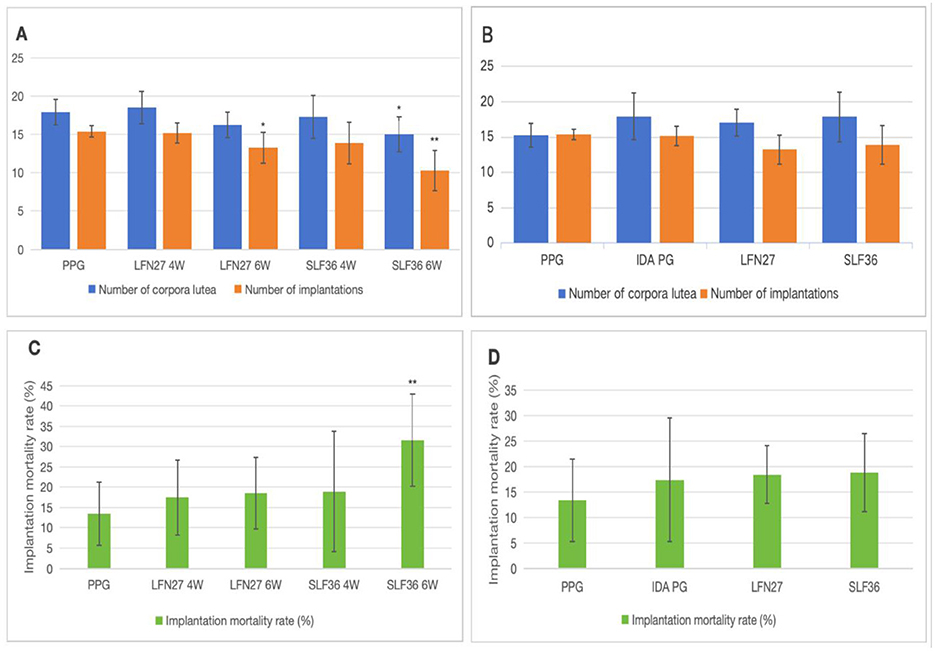
Figure 1. Effects of iron supplements on the fertility of pregnant anemia rats. (A, C) Physiological pregnancy anemia model. (B, D) Pregnancy anemia model after IDA. Compared with the physiological pregnancy group, *P < 0.05; **P < 0.01.
There was a mistake in Figure 2 as published. The Figure 2 part label images C and D were missing. The corrected figure and its caption appear below.
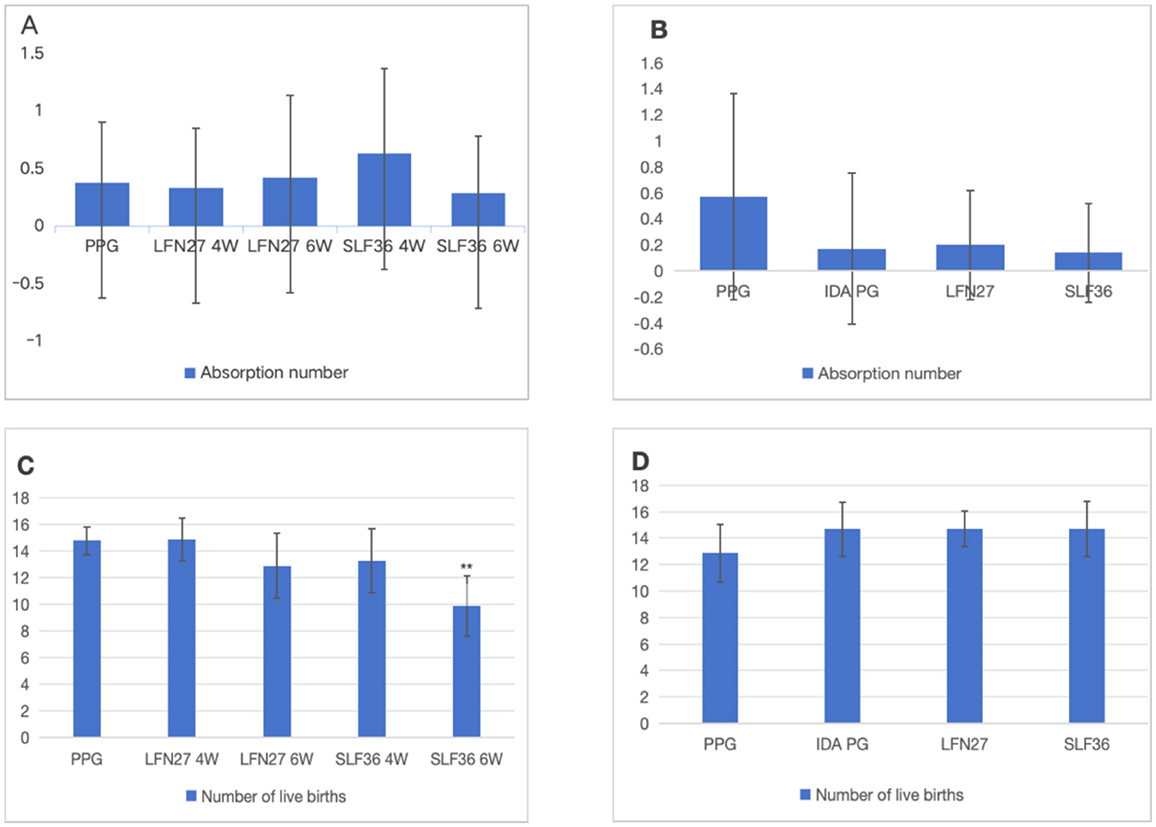
Figure 2. Effect of iron supplements on the number of embryos in pregnant anemic rats. (A, C) Physiological pregnancy anemia model. (B, D) Pregnancy anemia model after IDA. Compared with the physiological pregnancy group, **P < 0.01.
There was a mistake in Figure 3 as published. In Figures 3C, D images, the symbol “#” should have been used in the pregnancy anemia model after IDA. The corrected Figure 3 appears below.
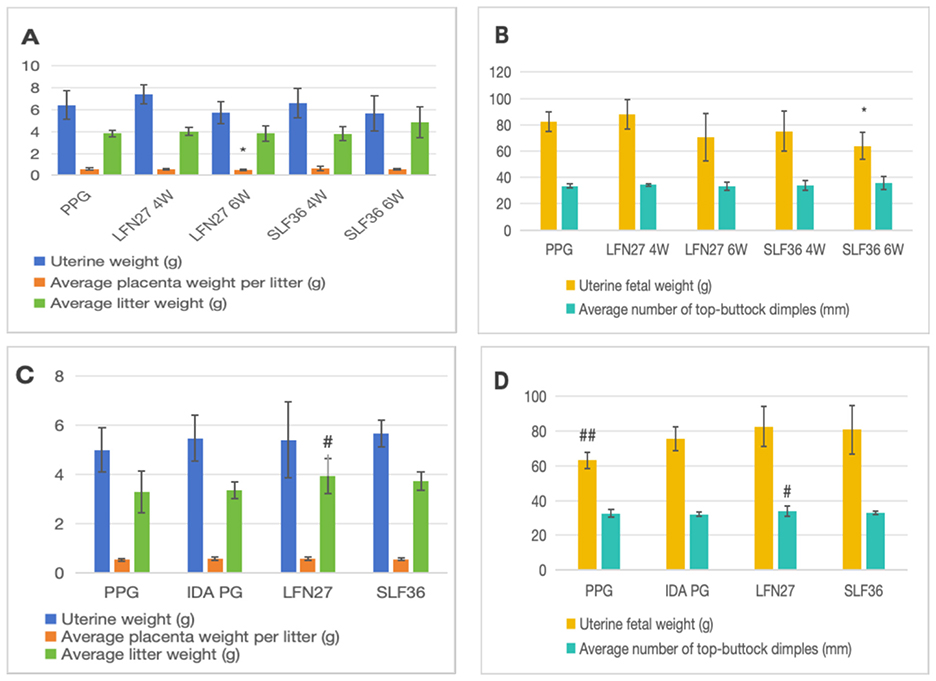
Figure 3. Effects of iron supplements on embryo and offspring development in pregnant anemia rats. (A, B) Physiological pregnancy anemia model. (C, D) Pregnancy anemia model after IDA. Compared with the physiological pregnancy group, *P < 0.05; compared with the IDA pregnancy group, #P < 0.05; ##P < 0.01.
There was a mistake in Figure 6 as published. In Figures 6C, D images, the symbol “#” should have been used in the pregnancy anemia model after IDA. The corrected Figure 6 appears below.
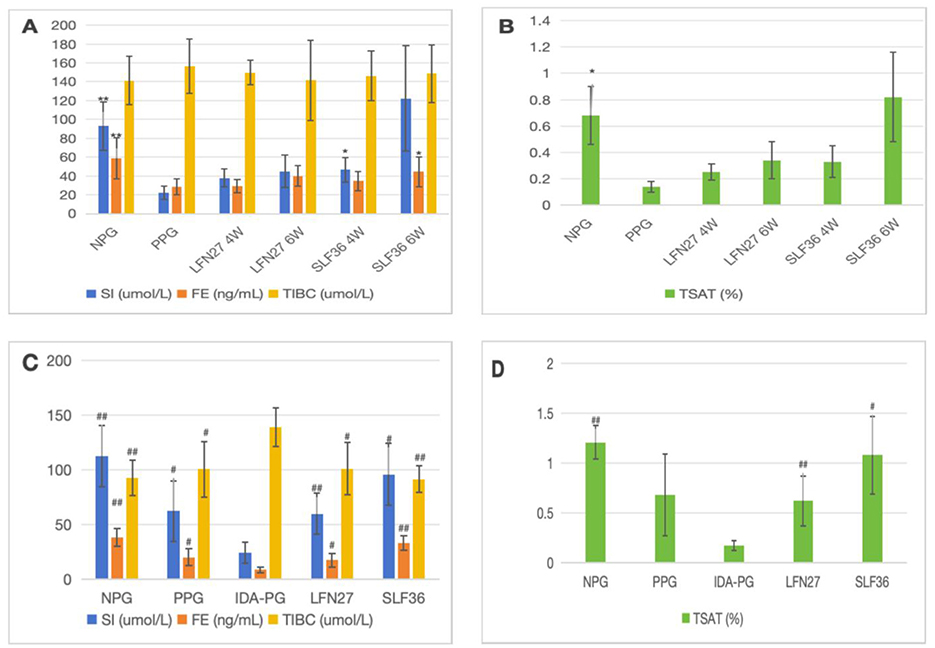
Figure 6. Effects of GD20 iron supplement on serum iron-related indicators in pregnant anemia rats. (A, B) Physiological pregnancy anemia model. (C, D) Pregnancy anemia model after IDA. Compared with the physiological pregnancy group, *P < 0.05; **P < 0.01. Compared with the IDA pregnancy group, #P < 0.05; ##P < 0.01.
There was a mistake in Figure 7 as published. In Figure 7B image, the symbol “#” should have been used in the pregnancy anemia model after IDA. The corrected Figure 7 appears below.
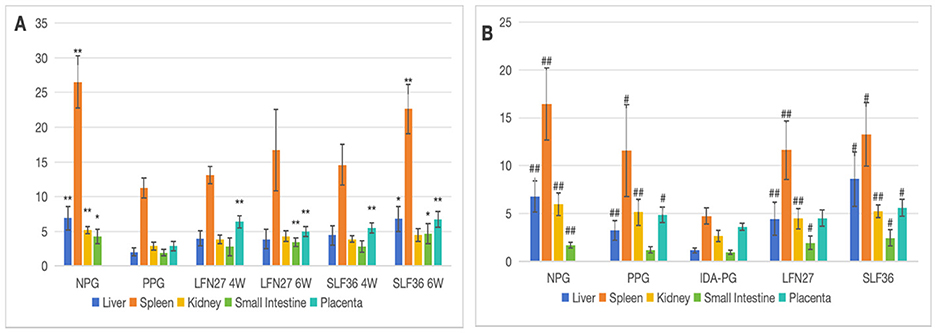
Figure 7. Effect of GD20 iron supplement on tissue iron content in pregnant anemic rats. (A) Physiological pregnancy anemia model. (B) Pregnancy anemia model after IDA. Compared with the physiological pregnancy group, *P < 0.05; **P < 0.01. Compared with the IDA pregnancy group, #P < 0.05; ##P < 0.01.
There was a mistake in Figure 8 as published. In Figure 8D, CPXI on the vertical axis should be GPX1. The corrected Figure 8 appears below.
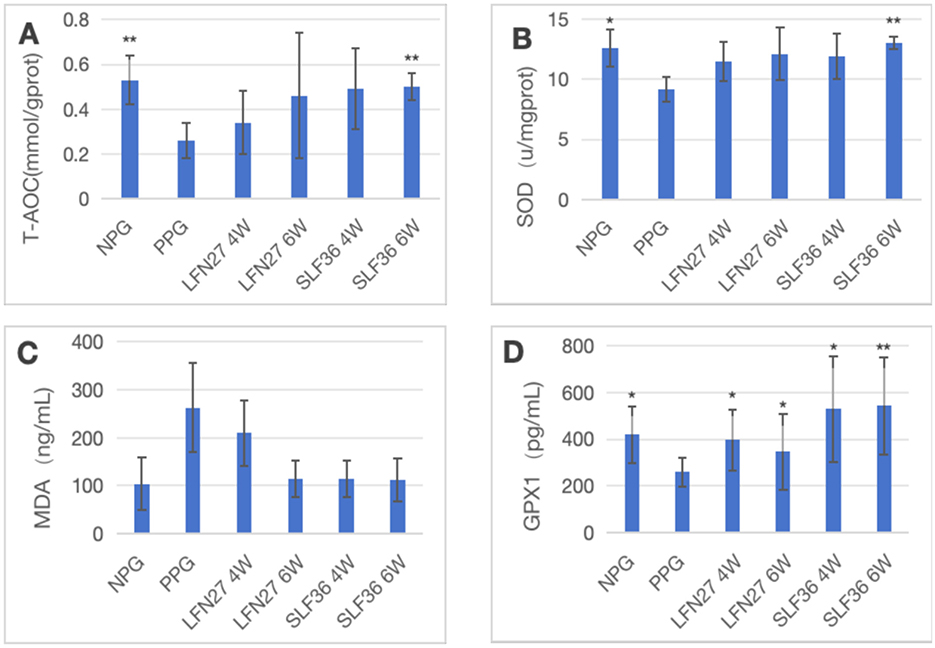
Figure 8. Effects of GD20 iron supplement on liver oxidative stress related indicators in physiological pregnancy group. (A) T-AOC; (B) SOD; (C) MDA; (D) GPX1. Compared with the physiological pregnancy group, *P < 0.05; **P < 0.01.
There was a mistake in Figure 9 as published. In Figure 9D, CPXI on the vertical axis should be GPX1. The corrected Figure 9 appears below.
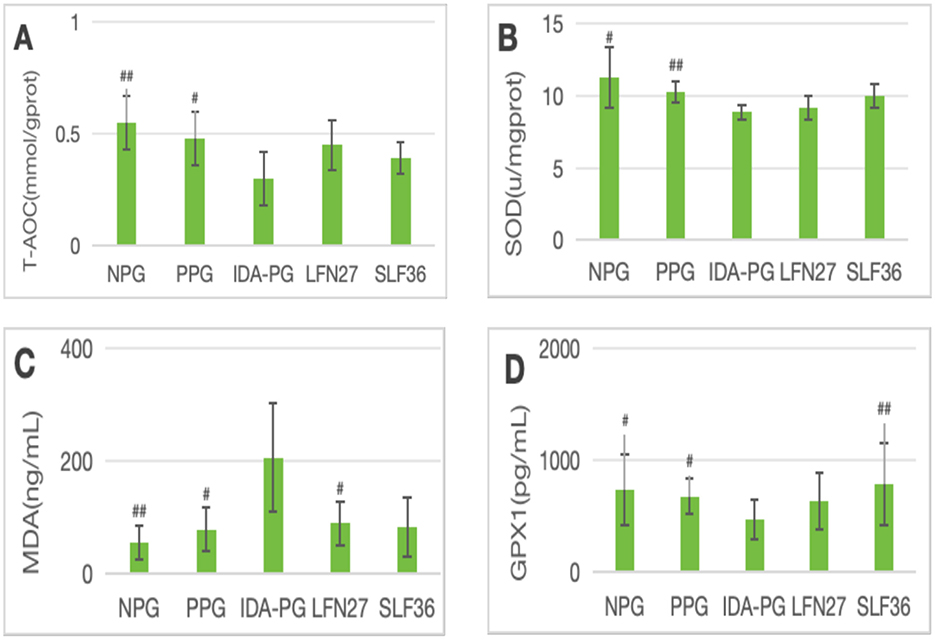
Figure 9. Effects of GD20 iron supplement on liver oxidative stress related indicators in pregnancy anemia model after IDA. (A) T-AOC; (B) SOD; (C) MDA; (D) GPX1. Compared with the IDA pregnancy group, #P < 0.05; ##P < 0.01.
There was a mistake in Figure 11 as published. In Figure 11B image, the symbol “#” should have been used in the pregnancy anemia model after IDA. The corrected Figure 11 appears below.
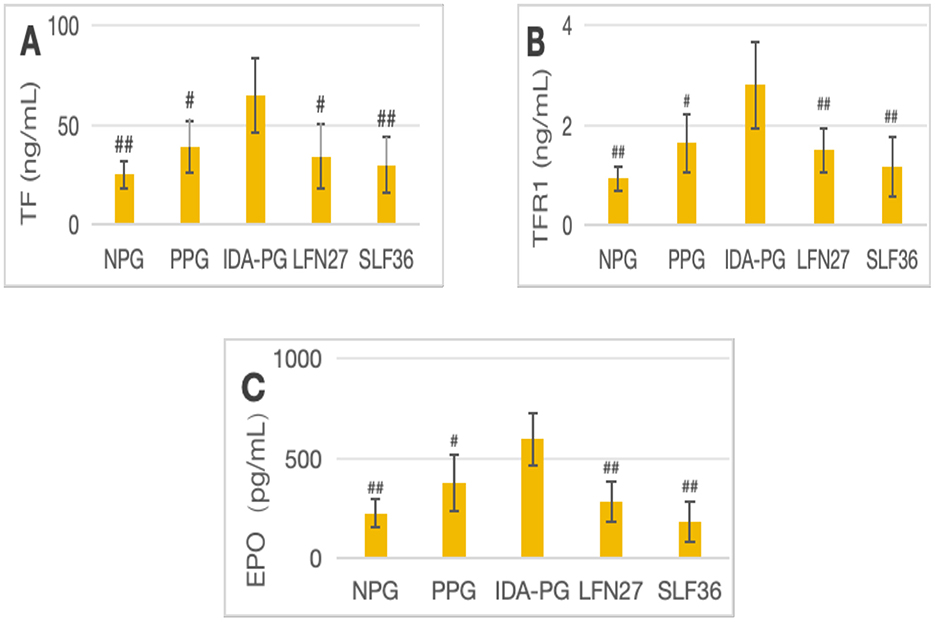
Figure 11. Effects of LFN and SLF on serum iron metabolism-related indicators in pregnancy anemia model after IDA. (A) TF; (B) TFR1; (C) EPO. Compared with the IDA pregnancy group, #P < 0.05; ##P < 0.01.
There was a mistake in Figure 12 as published. In Figure 12B image, the symbol “#” should have been used in the pregnancy anemia model after IDA. The corrected Figure 12 appears below.
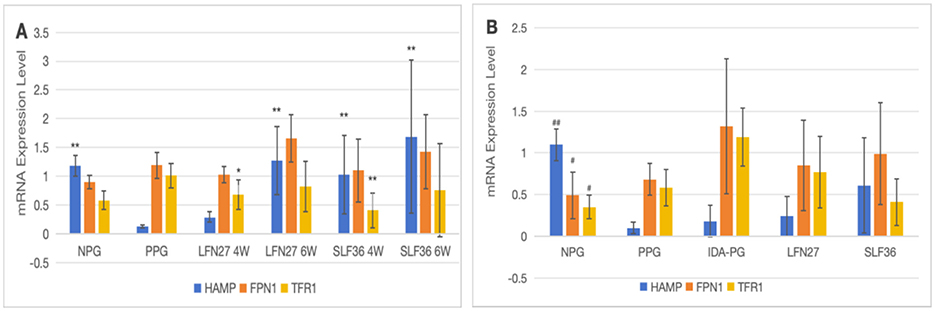
Figure 12. Effects of iron supplements on mRNA expression of liver iron metabolism-related indicators in pregnant anemic rats. (A) Physiological pregnancy anemia model; (B) pregnancy anemia model after IDA. Compared with the physiological pregnancy group, *P < 0.05; **P < 0.01; compared with the IDA pregnancy group, #P < 0.05; ##P < 0.01.
There was a mistake in Figure 13 as published. In Figure 13B image, the symbol “#” should have been used in the pregnancy anemia model after IDA. The corrected Figure 13 appears below.
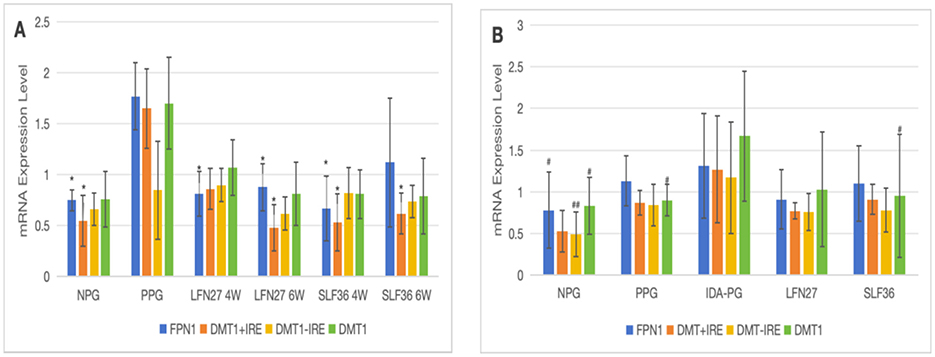
Figure 13. Effects of iron supplements on mRNA expression of iron metabolism-related indicators in the small intestine of pregnant anemia rats. (A) Physiological pregnancy anemia model; (B) pregnancy anemia model after IDA. Compared with the physiological pregnancy group, *P < 0.05; **P < 0.01; compared with the IDA pregnancy group, #P < 0.05; ##P < 0.01.
There was a mistake in Figure 14 as published. In Figure 14B image, the symbol “#” should have been used in the pregnancy anemia model after IDA. The corrected Figure 14 appears below.
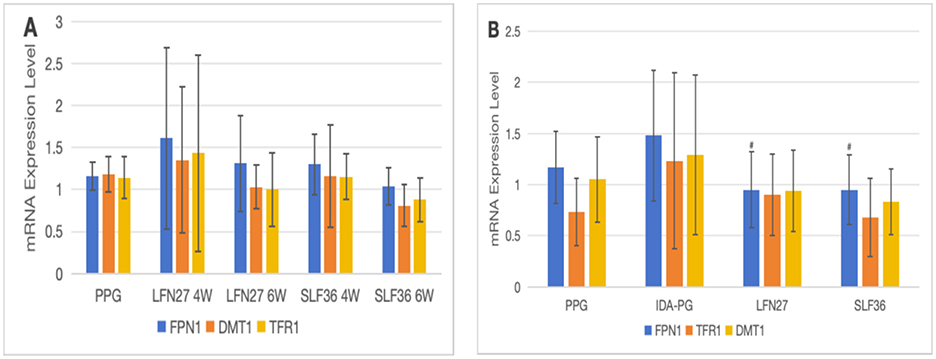
Figure 14. Effects of iron supplements on mRNA expression of iron metabolism-related indicators in the placenta of pregnant anemic rats. (A) Physiological pregnancy anemia model; (B) pregnancy anemia model after IDA. Compared with the IDA pregnancy group, #P < 0.05.
Supplementary Table 1 was erroneously published with the original version of this paper. The file has now been replaced.
The original version of this article has been updated.
Generative AI statement
Any alternative text (alt text) provided alongside figures in this article has been generated by Frontiers with the support of artificial intelligence and reasonable efforts have been made to ensure accuracy, including review by the authors wherever possible. If you identify any issues, please contact us.
Publisher's note
All claims expressed in this article are solely those of the authors and do not necessarily represent those of their affiliated organizations, or those of the publisher, the editors and the reviewers. Any product that may be evaluated in this article, or claim that may be made by its manufacturer, is not guaranteed or endorsed by the publisher.
Keywords: pregnancy anemia, iron deficiency anemia, iron metabolism, iron supplements, fertility
Citation: Zhang Z, Lai L, Liu Z, Liu S, Qu L and Zou W (2025) Correction: Differential effects of prophylactic iron supplementation on physiological gestational anemia and post IDA gestational anemia: a study based on a rat model. Front. Nutr. 12:1704849. doi: 10.3389/fnut.2025.1704849
Received: 26 September 2025; Accepted: 13 October 2025;
Published: 17 November 2025.
Edited by:
Xinran Liu, Peking University People's Hospital, ChinaReviewed by:
Ameer Shwayel, Health Researcher, United StatesSukhraj Dhillon, Government Medical College, Amritsar, India
Copyright © 2025 Zhang, Lai, Liu, Liu, Qu and Zou. This is an open-access article distributed under the terms of the Creative Commons Attribution License (CC BY). The use, distribution or reproduction in other forums is permitted, provided the original author(s) and the copyright owner(s) are credited and that the original publication in this journal is cited, in accordance with accepted academic practice. No use, distribution or reproduction is permitted which does not comply with these terms.
*Correspondence: Liping Qu, cXVsaXBpbmcyMDE4QDE2My5jb20=; Wenjun Zou, em91d2VuanVuQDE2My5jb20=