 Kalina T. Haas
 Maximilian W. Fries1
 Alessandro Esposito
- 1The Medical Research Council Cancer Unit, University of Cambridge, Cambridge, United Kingdon
- 2Institut Jean-Pierre Bourgin, INRAE, AgroParisTech, Université Paris-Saclay, Versailles, France
Revealing mechanisms underpinning cell function requires understanding the relationship between different biochemical reactions in living cells. However, our capabilities to monitor more than two biochemical reactions in living cells are limited. Therefore, the development of methods for real-time biochemical multiplexing is of fundamental importance. Here, we show that data acquired with multicolor (mcFLIM) or spectrally resolved (sFLIM) fluorescence lifetime imaging can be conveniently described with multidimensional phasor transforms. We demonstrate a computational framework capable of demixing three Forster resonance energy transfer (FRET) probes and quantifying multiplexed biochemical activities in single living cells. We provide a comparison between mcFLIM and sFLIM suggesting that sFLIM might be advantageous for the future development of heavily multiplexed assays. However, mcFLIM—more readily available with commercial systems—can be applied for the concomitant monitoring of three enzymes in living cells without significant losses.
Introduction
The fluorescence lifetime (τ) is the average time a fluorescent molecule spends in the excited state before returning to the ground state with the emission of a photon [5, 44]. Often, τ depends on the physicochemical characteristics of the environment surrounding the fluorophore but does not depend on the fluorophore concentration; thus, fluorescence lifetime sensing has been applied successfully to probe cell biochemistry (e.g., pH, analyte concentration, enzymatic activities, protein–protein interactions, and conformational changes). Fluorescence lifetime imaging microscopy (FLIM) is commonly used to map cell biochemistry in a quantitative and low-invasive way [18, 28, 45, 46].
Genetically expressed (e.g., using fluorescent proteins) biosensors permit researchers to probe diverse biochemical reactions exploiting the use of Forster resonance energy transfer (FRET). FRET is the non-radiative transfer of energy from a donor fluorophore to an acceptor molecule that can occur when the two molecules are sufficiently close, typically <10 nm [13, 37]. FRET causes a loss in fluorescence intensity (quenching) and a decrease of the donor’s fluorescence lifetime, both of which are directly proportional to the fraction of energy transferred from the donor to the acceptor. Thus, FRET can be exploited to quantify interactions at the nanometer scale via using a diffraction-limited microscope [75]. This property makes FRET an excellent tool for minimally invasive assays to probe molecular interactions, signal transduction, and biochemical activity in living cells [2, 48].
Historically, the estimation of fluorescence lifetime relied on the iterative fitting of the experimental decays [4, 31] or simple analytical relations between signals integrated in a few time-windows (e.g., [65]). Over the last decade, however, nonparametric data analysis using frequency-domain techniques [20, 33, 41], phasor-based representation [10, 18, 25, 35, 68], and extended phasors [8] have become very popular in the community. This strategy is simple, computationally efficient, and, more importantly, does not require model assumptions (e.g., mono or bi-exponential) that in complex, multiplexing assays might easily break down (e.g., because of background, cross-talks, and spurious signals). This is especially important at the low photon budget we must operate instrumentations to minimize phototoxicity.
With a large palette of fluorescent proteins that can be used to construct FRET biosensors of different colors (from the UV/blue to near infrared [3, 16, 27, 40, 53, 54, 66]), we can monitor multiple signaling events in living cells. Dual FRET biosensing was demonstrated with different experimental configurations and demixing analysis frameworks: multichannel ratiometric detection [1, 30, 57, 67], simultaneous homo-FRET and hetero-FRET detected with time-resolved anisotropy and global analysis [74], and dual-color FRET–FLIM to follow two biosensors using time-domain analysis [17]. However, the simultaneous detection of three and more FRET pairs remains challenging. Previously three-protein interaction was measured using “triple fluorophore” three-way FRET sensing [7, 29, 64, 69].
Recently, we have shown that the rational design of FRET pairs aimed to optimize the utilization of the visible spectrum enables multi-color FLIM (mcFLIM) to multiplex at least three FRET probes with a single excitation laser [27] at the speed and resolution necessary for live cell imaging [71]. The utilization of additional excitation wavelengths and hyperspectral detection might extend this strategy to the integration of a higher number of markers, biosensors, or optogenetic tools [39, 67, 71].
However, computational frameworks for the robust and sensitive multiplexing of FRET are at their infancy, and further work is necessary to improve our multiplexing capabilities. Phasor analysis of time decays has often been applied to quantify FRET for single probes by separating the two states of a typical sensor (low/high FRET) [10, 14, 18, 26, 35, 36, 38, 41, 47, 49, 50, 55, 60, 70, 72, 73]. Similarly, the integration of spectrally resolved FLIM (sFLIM) [34] and multidimensional phasor analysis has been successfully applied to the quantification of single FRET probes [25]. In Fries et al. [27], we have illustrated how to utilize multicolor FLIM and multidimensional phasors for demixing three FRET probes. However, to our knowledge, the demixing of multiple fluorescent species (donor, acceptors, and FRET for several probes simultaneously) has not been sufficiently explored.
In this work, first we briefly illustrate the development of a photon-efficient spectrally resolved FLIM based on off-the-shelf components. Second, we demonstrate the generalization of the NyxSense computational framework which we had first introduced for mcFLIM applications [27]. Most importantly, we provide a detailed comparison of various algorithms aimed to provide efficient dimensionality reduction by multidimensional phasors that can be used for demixing three FRET pairs by spectral FLIM (either multicolor or spectrally resolved FLIM).
We show that phasors of higher dimensionality significantly improve demixing algorithms for both mcFLIM and sFLIM. We demonstrate that while spectrally resolved FLIM could provide advantages in demixing of more than three FRET probes, state-of-the-art fast time-correlated single-photon counting (TCSPC) still attains very high performances with significant implications for future developments of multiplexing time-resolved platforms.
Materials and Methods
Microscopy
We have developed a simple spectrally resolved FLIM (sFLIM) setup built with off-the-shelf components, including a 16-channel multi-anode GaAsP photomultiplier tube (PML-16-GASP16, Becker&Hick GmbH) placed at the de-scanned port of a SP5 Leica Confocal Microscope (Leica Microsystems United Kingdom, Ltd.). Spectral dispersion was achieved with a direct vision prism (G331120000, LINOS, GmbH) to provide a simple alignment and low optical losses. Notably, GaAsP photomultiplier tubes provide very high quantum efficiencies (45% at 500 nm) compared to the previous generation of photocathodes available (<20% for the bialkali PML-16-1), without compromising the instrument response function of the system significantly (220 vs 200 ps, nominal values provided by the manufacturer). The electrical signals from the photomultiplier assembly were routed to time-correlated single-photon counting electronics (SPC-150 by Becker & Hick GmbH) utilizing a single arm of the hyperdimensional imaging microscopy electronics we have described previously [19]. Single confocal plane images were acquired with a 40x oil objective (Leica HCX PL APO CS 40.0 × 1.25 OIL UV), 256 × 256 pixel image size, and 120 s acquisition time. A simultaneous two-photon excitation of the FRET pairs was achieved with a Ti:Sapphire Laser Chameleon Vision II (Coherent Inc.) tuned at 860 nm.
Cell Culture And Time-Lapse Imaging
For time-lapse imaging, we used HeLa-CCL2 cell lines (European Collection of Cell Cultures #93021013) expressing the three sensors with the plasmid described in [27]. The sensors have been fully characterized in our former publication: TagBFP-sREACh, mAmetrine-msCP576, and mKeima-tdNirFP, fused with the flexible linkers containing the sequences VDTTD, DEVDR, and LEHD that are cleaved preferentially by caspase 2, caspase 3, and caspase 9, respectively. Cells were periodically mycoplasma-tested and STR profiled using the services of the CRUK Cambridge Institute. Cells were treated with the genotoxic drug cisplatin to induced cell death and imaged for 8 h at 1 h intervals in LabTek II glass-bottom chambered slides (Nunc, #1.5) containing a 400 µl Leibovitz (L-15) medium supplemented with 10% FCS, 100 μM Cisplatin, and 0.9% NaCl. Multidimensional phasor fingerprinting of individual components was performed just before the time-lapse experiment, with HeLa-CCL2 cells transiently transfected with donor fluorophores not fused with an acceptor, and a donor–acceptor fusion pair (known FRET), as shown in [27].
Data Analysis
All the analyses were performed with custom-written Matlab script package freely available at https://github.com/inatamara/NyxSense. Segmentation, tracking, and application of NyxSense to mcFLIM have been described previously [27]. Briefly, cell segmentation was performed on the intensity images (decay curves and spectral channels were integrated) with the combination of an active contour algorithm [9] and a manual curation of the mask. Subsequently, cells were tracked between two consecutive images using a nearest neighbor approach, and mis-tracked cells were manually reassigned. A spectrally and time-resolved measurement for each cell was then achieved by summing the two-dimensional TCSPC histograms within the cell mask. The latest version of NyxSense (used here) also provides the capability to analyze spectrally resolved FLIM data. The performance of NyxSense for spectrally resolved or multicolor FLIM was evaluated using the same datasets. mcFLIM was generated by binning to the sFLIM spectral channels 1–6, 7–13, and 14–16, for channels 1, 2, and 3, respectively.
Multidimensional Phasor-Based Demixing of Spectrally Resolved Fluorescence Lifetime Imaging Microscopy Data
In the phasor space, single exponential decays are mapped to points on a semicircle described by the equation (x-0.5)2 + y2 = 0.52 (Figure 1A) [12, 18].
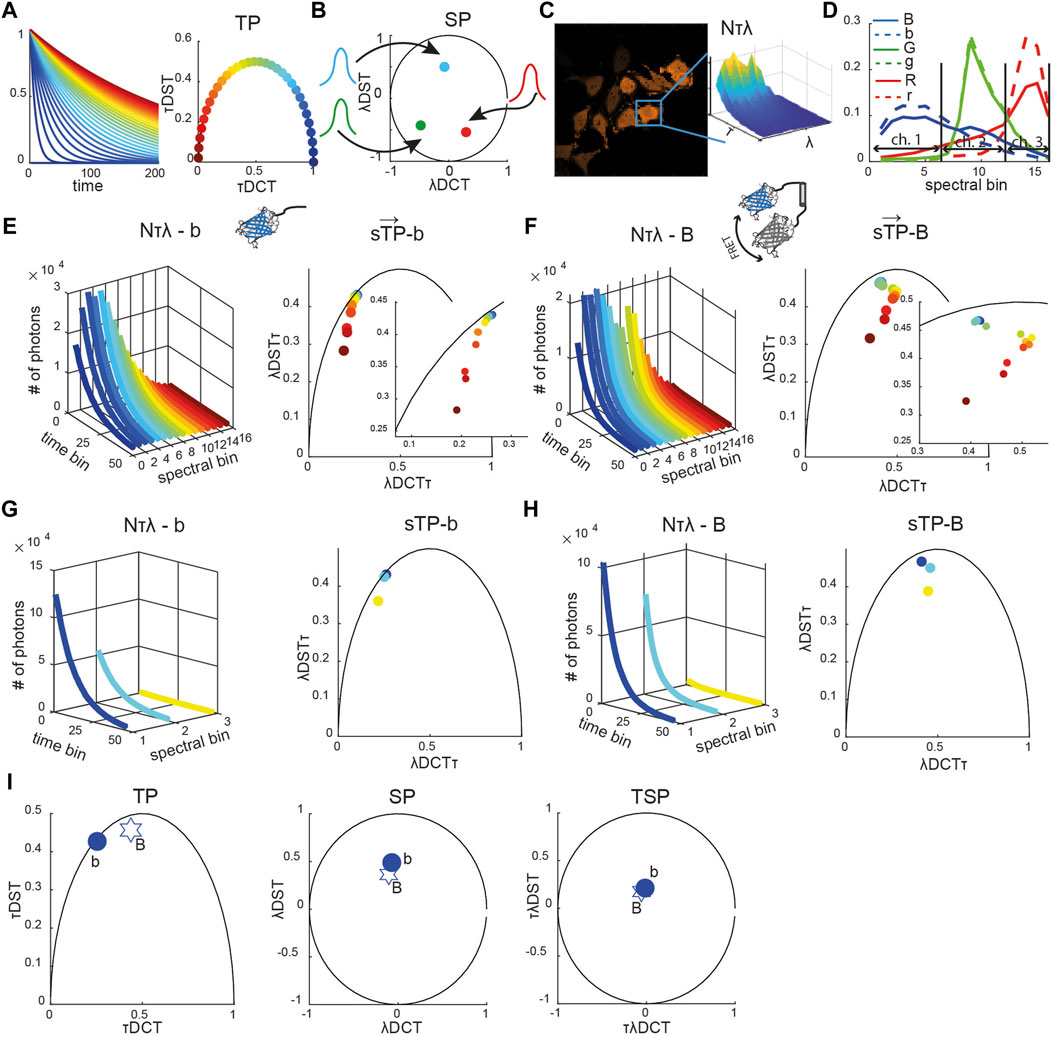
FIGURE 1. Reference spectrally resolved fingerprint. (A) Diagrammatic representation of exponential decay curves (τ from ∼0 ns in blue to 240 ns in crimson) shown in the time-domain (left) and time phasor space (circles, right panel). (B) Diagrammatic representation of Gaussian spectra (colored curves) and their representation as spectral phasors (solid circles). (C) Representative image of HeLa cells expressing a blue caspase-2 sensor (see Supplemetary Figure S1 for green and red sensors) with the spectrally resolved time decay N (τ, λ) integrated over the mask of a single segmented cell is shown (inset). (D) Spectra of the blue (blue solid line), green (green solid line), and red (red solid line) positive controls (fusion constructs) and of the corresponding negative controls (only donors, dashed lines). Each curve was normalized to the total number of counts. The horizontal arrows indicate which spectral bins were used to emulate three-channel (ch.) multicolor FLIM (mcFLIM) data. Spectrally resolved time-decay N (τ, λ) (left panels in (E–H)) and corresponding spectrally resolved phasors (
The time phasor coordinates are defined by the real and imaginary parts of the Fourier transform of the exponential decay function, and calculated as a discrete cosine (DCT) and a discrete sine (DST) transform, respectively. Points lying inside this semicircle correspond to mixed exponentials, being either inherently multi-exponential or a mixture of single-lifetime components. Similarly, all possible spectral phasors lie on arcs bounded by a circle x2 + y2 = 1, resulting from the Fourier transform of pure Gaussian spectra (Figure 1B) [22, 23, 23, 25]. The two-dimensional time-spectral phasor (TSP) is a two-dimensional Fourier transform, in which values are also bounded by a circle x2 + y2 = 1.
The phasor transform key advantage is additivity: a mixture of the spectral or lifetime components corresponding to a linear combination of phasors. This permits rapid demixing using a system of algebraic equations. A point in a phasor space corresponding to the combination of two lifetimes or spectra lies on the line connecting these two pure components. The distance to each pure component along connecting line segments translates directly to its fractional contribution within the mixture. In general, a phasor representing a mixture of n components is enclosed by a polygon with n vertices defined by the phasors of elementary components [23].
For every cell at each time point, we calculated multidimensional phasors: spectrally resolved time phasors (sTPs), spectrally integrated time phasors (TPs), spectral phasors (SPs), and time-spectral phasors (TSPs). The time-spectral phasor is a two-dimensional transformation along the time dimension followed by the transform along the spectral dimension.
Spectrally integrated time phasors (TPs) were obtained as TP = τDCT + i*τDST, where τDCT and τDST are discrete cosine and sine transforms, respectively (Eqs. 1,2).
where
Time-integrated spectral phasors (SPs) were obtained as SP = λDCT + i*λDST, where λDCT and λDST are the discrete cosine and sine transforms, respectively (Eqs. 3,4).
where
Time-spectral phasors (TPs) were obtained as TSP = τλDCT + i*τλDST, where τλDCT and τλDST are discrete cosine and sine transforms, respectively (Eqs. 5,6).
Spectrally resolved time phasors (sTPs) were obtained as sTP = λDCTτ + i*λDSTτ, where λDCTτ and λDSTτ are discrete cosine and sine transforms for each spectral channel, respectively (Eqs. 7,8).
The fluorescence signatures of cells or reference samples were then characterized by the multidimensional phasors defined by the complex vector
Demixing of sFLIM can be achieved by minimization of a complex nonlinear multivariable constrained function (CF) with respect to fractional contributions of the six control signatures (C). At each minimization step, CF is computed as a squared residual between experimental phasors (
The minimization procedure was achieved using fmincon Matlab solver. The lower (LB) and upper bonds (UB) for the fractional contributions were constrained to 0 and 1, respectively. The initial values for the fractional contributions were typically 0 for all the control signatures.
The relative enzymatic activity (REA) for each FRET sensor (caspase) was calculated using the following equations:
where fd and func are the fractional contribution of the donor-only and uncleavable sensor control signatures, respectively, E is FRET efficiency, and division by (1 − E) compensates for the change in brightness. To avoid the division by a very small number leading to large errors, REA was set to 0 for fd and func typically below 0.01–0.02. We note that in the specific case of proteolytic sensor, REA represents the cumulative enzymatic activity of the proteases as cleavage is irreversible (until new sensors are expressed de novo).
The standardized phasor residuals were calculated as a difference between experimental phasors and phasors calculated using the unmixed fractional contributions.
where
The root mean square deviation (RMSD) for the REA was computed as follows:
where P is a FRET pair (B, G, R), Nt = 8 is the number of the experimental time points, REA0 is the known enzymatic activity (the ground truth), and REA is obtained from the demixing.
Simulating Spectrally Resolved Fluorescence Lifetime Imaging Microscopy Data
The following equation was used to generate time- and spectrally resolved emission for each FRET pair (n):
where
where
Results
Multidimensional Phasor Fingerprint Provides an Efficient Method for Dimensionality Reduction
To test the capabilities of the computational framework presented in the Methods section, we used the NyxBits sensor platform we have described recently to sense cleavage of different substrates (the peptides VDTTD, DEVDR, and LEHD) that are preferentially cleaved by caspase 2, caspase 3, and caspase 9, respectively [27]. In our former work, we demonstrated the capability of mcFLIM to demix the blue (labeled as B in all figures, caspase 2), green (G, caspase 3), and red (R, caspase 9) FRET pairs excited at the same wavelength (Figure 1). Upon cleavage, each sensor yields two principal components with different lifetimes and spectra: an unquenched donor (labeled with the small b, g, and r letters in all figures) and the uncleaved donor–acceptor undergoing FRET (B, G, and R). Thanks to the large Stokes shifts of the probes and acceptor chromophores of a very low quantum yield, the free acceptors are excited with low efficiency and have a minor impact on our experiments. Here, we characterize the three FRET sensors and compare the performance of mcFLIM and sFLIM using a simple and optically efficient spectrally resolved FLIM (see Materials and Methods).
Each sFLIM image has two spatial dimensions (x, y–here 256 × 256), the time-resolved fluorescence decay histogrammed in 64 time bins (τ) and a spectral dimension represented with 16 spectral bins (λ). The spectrally and time-resolved fluorescence decay of each pixel can therefore be represented in an abstract space of high dimensionality (64 × 16 = 1,024 numbers, or photon-counts). Multidimensional phasor transforms permitted us to project this space onto a space of lower dimensionality where the fluorescence characteristics detected in each pixel are described by a vector
The reference phasors were obtained by imaging cells expressing only one control signature, that is, only a donor or a sensor rendered non-cleavable by substituting the substrates with a proteolytically stable sequence. Figures 1E,F show the unquenched blue donor (b) and a blue uncleavable FRET pair (B) fingerprints, respectively, including spectrally resolved lifetime, decays (N[λτ]), spectrally resolved time phasors (sTPs), spectrally integrated time phasors (TPs), time-integrated spectral phasor (SP), and time-spectral phasors (TSPs) (see also Supplementary Figure S1). We compare the biochemical sensitivity of spectral FLIM to multicolor FLIM by binning the 16 spectral bins into three channels that numerically emulate multicolor detection (Figures 1D,G,I, Supplementary Figure S1, see also Material and Methods). This strategy permitted us to compare the computational performance of the two methods, without having to account for differences in the detection efficiency of two detection systems that would be otherwise difficult to control experimentally.
Multidimensional Phasor-Based Demixing Minimizes Cross-Talks Between Sensors
Subsets of the components of
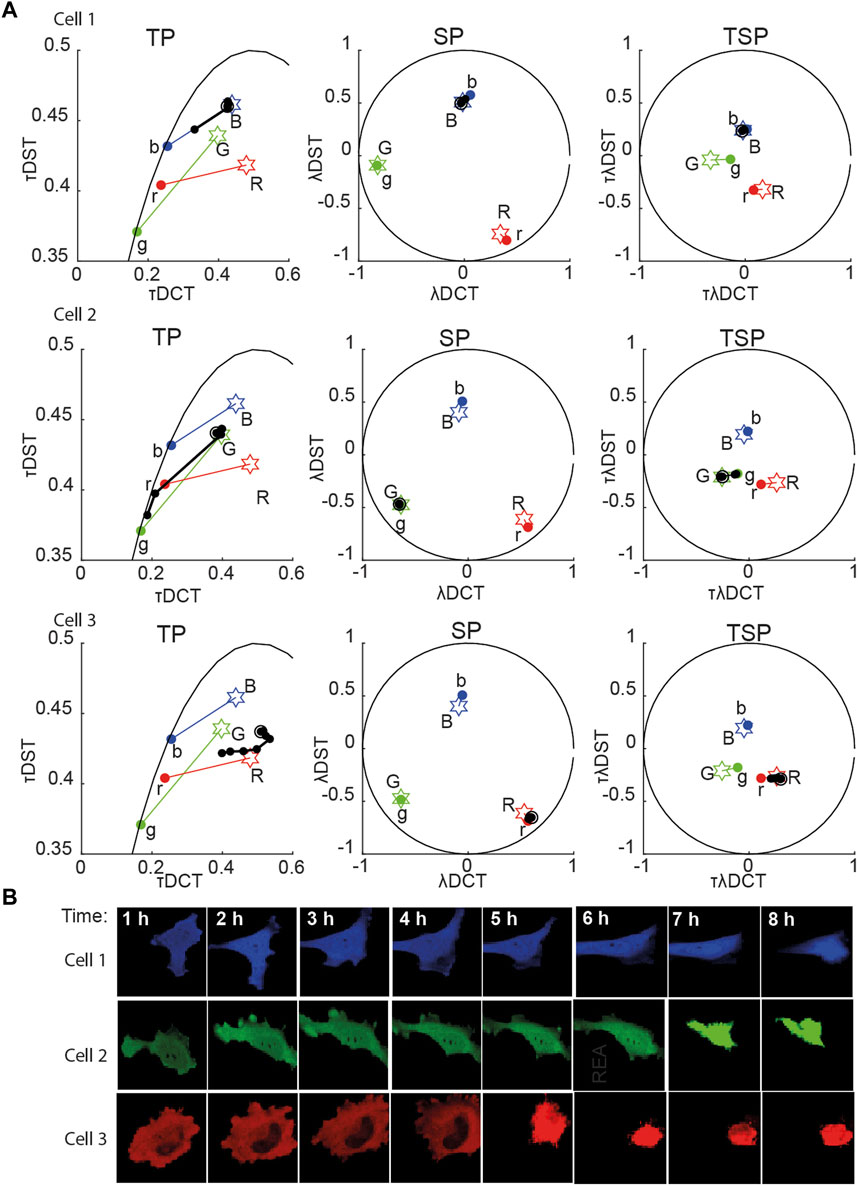
FIGURE 2. Multidimensional phasor representation of time-lapse sFLIM of single FRET pairs. (A) Multidimensional phasor transforms (here, only TP, SP, and TSP are shown) of the representative cells expressing blue-only sensor (top row, cell 1), green-only sensor (middle row, cell 2), and red-only sensor (bottom row, cell 3). Cells were treated with cisplatin and imaged for 8 h. The black circles (experimental measurements taken every hour) and lines represent the biochemical trajectory of a cell projected on the different phasor spaces that should span from the negative control fingerprints (stars labeled B, G, and R, uncleavable sensors) to the donor-only references (colored circles labeled b, g, and r). (B) Intensity images (total photon-counts/pixel of sFLIM images) of the cells analyzed in (A). In panel (A), DCT-discrete cosine transform, DST-discrete sine transform; λ-marks spectral domain or spectral transformation (λDCT/λDST); τ-marks time-domain or time phasor transformation (τDCT/τDST).
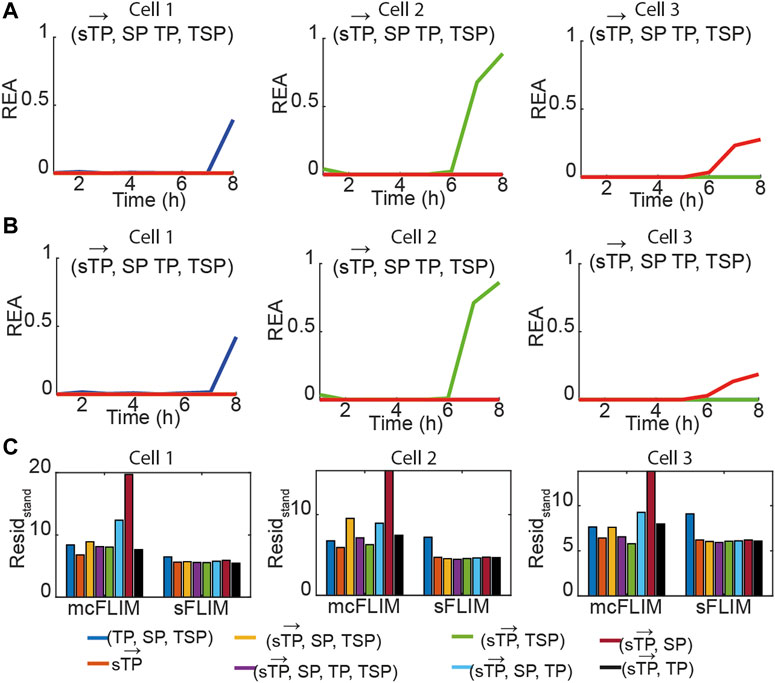
FIGURE 3. Multiplexing biochemical reactions using multidimensional phasor-based demixing. (A,B) Results of the multidimensional phasor-based demixing of the time-lapse data shown in Figure 2 using (
For the single FRET pairs (demixing of two components), we observed that the different combinations of
Multidimensional Phasor-Based Demixing Achieves Efficient Multiplexing of Forster Resonance Energy Transfer Biosensors
Next, we validated the proposed methodology by summing photon counts recorded from cells expressing the individual FRET pairs. This strategy permitted us to test the demixing algorithms in the presence of typical cross-talks, providing an experimentally valid ground truth (the known fractional contributions, calculated in Figure 3). For example, Figure 4 shows the same data displayed in Figure 3, summed, and then demixed either using sFLIM or mcFLIM. With this validation dataset and the analysis of the residuals, we observe that both spectrally resolved and multicolor FLIM provide efficient and comparable demixing, see also Supplementary Figure S4. Most importantly, the residual analysis of both mcFLIM and sFLIM showed that the smallest fitting errors were observed for the largest
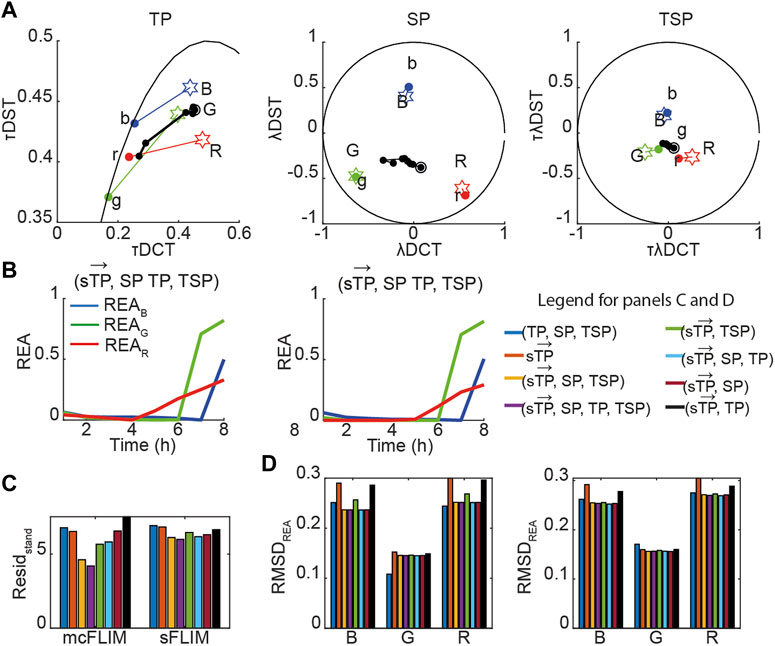
FIGURE 4. Validation of the demixing algorithms. The experimental data shown in Figures 2, 3 were summed to generate a synthetic mixed signal (i.e., a cell expressing three sensors) of known ground truth. (A) The mixed signals are shown as different phasor subspaces. The black circles and lines represent the biochemical trajectory of a cell projected on the different phasor spaces. Stars represent the fingerprints of the uncleavable sensors (labeled B, G, and R), and the colored circles the donor-only fingerprints (labeled b, g, and r). (B) These data were demixed using (
As phasor residuals do not determine the accuracy in the estimation of relative enzymatic activities, we also estimated the root mean square deviation (RMSD) of the REA values when a ground truth can be estimated (see Eq. 11, Materials and Methods) by subtracting REA obtained with a single FRET pair denoted as REA0 (Figure 3) from the REA obtained with triple FRET demixing (REA, Figure 4B). In Figure 4D, we show that the RMSD of sFLIM and mcFLIM is very similar.
Next, we applied the proposed methodology to the analysis of the experimental data with cells co-expressing all three sensors. Figure 5A shows the time evolution of biochemical traces of two cells (Cell-1 and 2) that exemplify the different responses we have described previously [27]. Cell-1 exhibits a robust activation of all three caspases, while Cell-2 does not. Figures 5B, C show the demixing results using
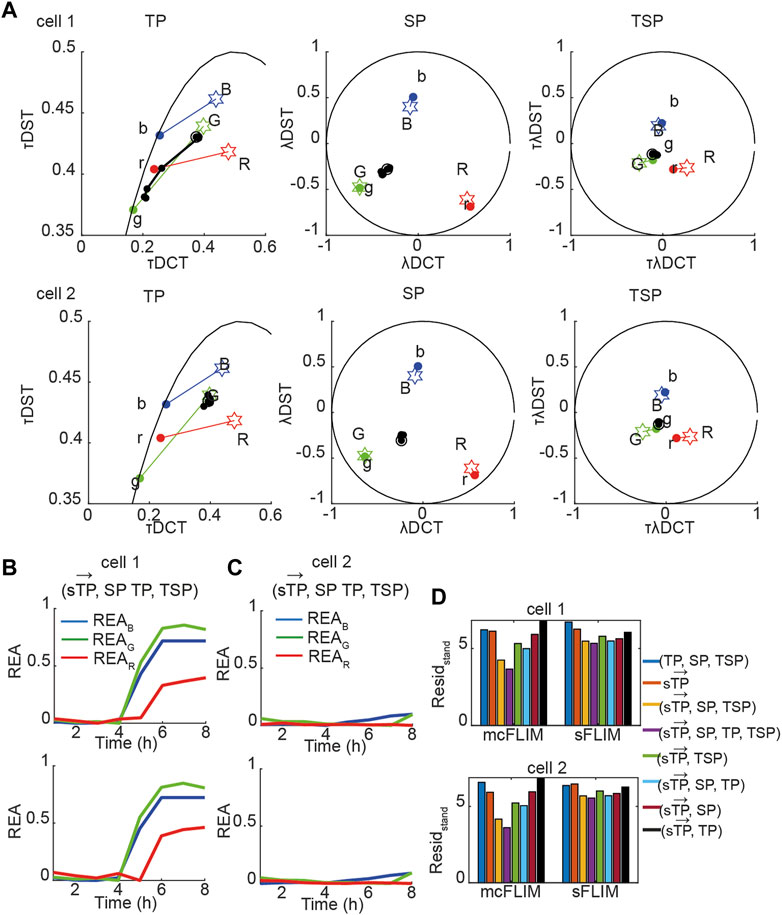
FIGURE 5. Multidimensional phasor-based demixing of three biochemical reactions. (A) Time-lapse experiment showing two representative cells expressing all three sensors. Data are represented in the TP, SP, and TSP phasor subspaces. The black circles and lines represent the biochemical trajectory of a cell. Cells were treated with cisplatin and then imaged for 8 h every 1 h. Stars represent the reference fingerprints of the uncleavable sensors (labeled B, G, and R), and colored circles show the donor-only references (labeled b, g, and r). (B,C) The results of demixing using (
Multidimensional Phasor-Based Demixing is Necessary for Demultiplexing High Cross-Talk Data
Taken together, the results shown suggest that multicolor FLIM is already an efficient technique for demix of three FRET pairs when analyzed with multidimensional phasors although it requires optimized FRET pairs. With the engineering of faster and efficient spectral FLIM system, we envisage that sFLIM might provide a significant advantage for demixing, for example, with FRET pairs not specifically designed for heavily multiplexed detection. We therefore investigated how more significant spectral overlaps might affect the performance of mcFLIM and sFLIM. We generated a fully synthetic triple FRET pair images (see Eqs. 12,13, Material and Methods, Figure 6, Supplementary Figure S6). In the presence of higher overlap, the spectrally resolved time phasors
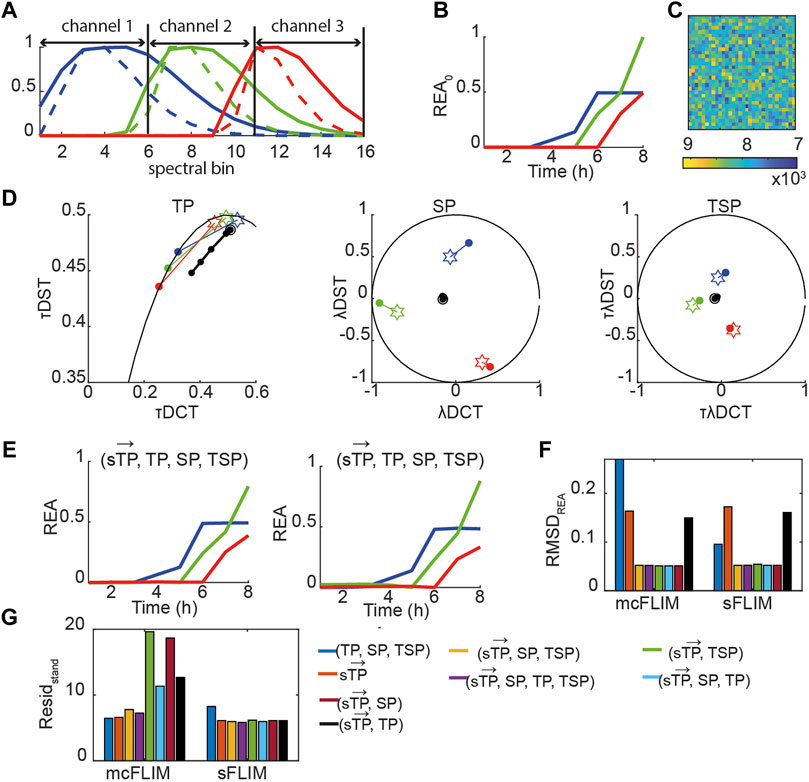
FIGURE 6. Multidimensional phasor-based demixing of high multiplexed synthetic data. (A) Spectra of the simulated blue (blue solid line), green (green solid line), and red (red solid line) positive controls (uncleavable sensors) and of the corresponding negative controls (only donors, dashed lines). Each curve was normalized to the maximum. Data were simulated as 16 spectral bins, and channel 1–3 show which bins were summed to obtain three-channel mcFLIM. (B) A simulated REA0 curves. (C) A simulated noisy image. (D) Time-lapse simulated data combining three sensors. Data are represented in the TP, SP, TSP phasor subspaces. The black circles and lines represent the biochemical trajectory of a simulated data. Stars represent the reference fingerprints of the uncleavable sensors (labeled B, G, and R), and colored circles show the donor-only references (labeled b, g, and r). (E) The results of demixing using (
Once again, multidimensional phasors provided more robust demixing performing optimally in all the tested conditions. With low-to-medium spectral overlap, mcFLIM performs almost as well as spectral FLIM, but sFLIM (both supported by the open-source NyxSense code we provide) is more robust to the choice of algorithm and—intuitively—to increasing spectral overlaps.
Discussion
Time- or spectrally resolved imaging has become very accessible, thanks to commercial confocal microscopes frequently installed in core facilities that can support these applications. Such technologies offer opportunities to match the increasing demands for enhanced multiplexing of fluorescent markers. The quantitative characterization of biochemical network dynamics is an invaluable application of multiplexed fluorescence to formulate or test hypotheses at the interface between cell and systems biology. Nevertheless, this application is comparatively immature, at least concerning more quantitative approaches extended to small biochemical networks. Demultiplexing several biochemical activities from complex photophysical datasets is still a challenge that requires breaking new grounds to enable the robust characterization of biochemical networks at single-cell resolution [7, 15, 30, 62]. This challenge is made harder by the nonideal conditions necessary to image living cells. For example, the need to minimize photon toxicity leads to low photon counts and spurious signals. In addition, the use of several fluorescent proteins that are determined by the need for multiplexing constraints (spacing between excitation/emission spectra) might exacerbate issues such as improper maturation of acceptor chromophores and brightness, photobleaching, and photochromism.
Therefore, here we contribute to this endeavor with a framework based on multidimensional phasor transforms, representing efficient and intuitive methods for demixing three FRET pairs excited at a single wavelength. Building on work published by us and others (e.g., [21–23, 25, 27, 61]) we extended this computational framework, including higher phasor dimensionality. We demonstrate its efficacy to demix three FRET pairs imaged at a single excitation wavelength that we previously optimized for the multiplexing and by simulating synthetic triple FRET pair images with more spectral overlap. We provide a description of our methodology and the extension to spectrally resolved FLIM of the NyxSense computational platform that we had briefly described only for mcFLIM [27]. This platform is available in the public domain (https://github.com/inatamara/NyxSense) and could be used by the community to test, further improve, or simply use the methodology we proposed. Spectrally resolved FLIM is readily available commercially, and several bespoke implementations aimed to make available cost-effective and user-friendly solutions have been also published (e.g., [6, 42, 43, 51, 56, 58, 61, 63, 76], promising increased availability of such sophisticated assays in the near future. We showed that the combination of spectrally resolved time phasors (
However, we suggest that readily available equipment dedicated to multicolor FLIM, particularly instruments capable of fast detection, can already perform such complex experiments efficiently. Therefore, the innovation of detection technologies of both scanning and wide-field microscopes can make biochemical multiplexing a routine technique in the future [11, 32, 47, 59, 60]. We show that excellent demixing results can be achieved with the open-source toolbox NyxSense for both sFLIM and mcFLIM. NyxSense implements the multidimensional phasor transforms that facilitate the projection of complex multidimensional photophysical data onto biochemical spaces of lower dimensionality to represent the biochemical trajectory of single cells in response to stimuli.
Data Availability Statement
The original contributions presented in the study are included in the article/Supplementary Material; further inquiries can be directed to the corresponding author.
Author Contributions
AE, KH, and MF designed the experiments; KH and MF executed the experiments; AE built the microscope; KH and AE wrote the manuscript; KH analyzed the data and wrote the programs.
Funding
MF was funded by the Gates Foundation studentship. We acknowledge funding from the Medical Research Council core grants (MC_UU_12022/1 and MC_UU_12022/8) and the Wellcome Trust (090340/Z/09/Z) to AV, and from the Cancer Research UK (C54674/A27487) to AE.
Conflict of Interest
The authors declare that the research was conducted in the absence of any commercial or financial relationships that could be construed as a potential conflict of interest.
Supplementary Material
The Supplementary Material for this article can be found online at: https://www.frontiersin.org/articles/10.3389/fphy.2021.637123/full#supplementary-material
References
1. Ai H-w., Hazelwood KL, Davidson MW, Campbell RE. Fluorescent Protein FRET Pairs for Ratiometric Imaging of Dual Biosensors. Nat Methods (2008) 5(5):401–3. doi:10.1038/nmeth.1207
2. Algar WR, Hildebrandt N, Vogel SS, Medintz IL. FRET as a Biomolecular Research Tool - Understanding its Potential while Avoiding Pitfalls. Nat Methods (2019) 16(9):815–29. doi:10.1038/s41592-019-0530-8
3. Bajar B, Wang E, Zhang S, Lin M, Chu J. A Guide to Fluorescent Protein FRET Pairs. Sensors (2016) 16(9):1488–24. doi:10.3390/s16091488
4. Barber PR, Ameer-Beg SM, Gilbey J, Carlin LM, Keppler M, Ng TC, et al. Multiphoton Time-Domain Fluorescence Lifetime Imaging Microscopy: Practical Application to Protein-Protein Interactions Using Global Analysis. J R Soc Interf (2009) 6, S93–S105. doi:10.1098/rsif.2008.0451.focus
5. Berezin MY, Achilefu S. Fluorescence Lifetime Measurements and Biological Imaging. Chem Rev (2010) 110(5):2641–84. doi:10.1021/cr900343z
6. Bruschini C, Homulle H, Antolovic IM, Burri S, Charbon E. Single-photon SPAD Imagers in Biophotonics: Review and Outlook. ArXiv (2019).
7. Bunt G, Wouters FS. FRET from Single to Multiplexed Signaling Events. Biophys Rev (2017) 9(2):119–29. doi:10.1007/s12551-017-0252-z
8. Campos-Delgado DU, Navarro OG, Arce-Santana ER, Jo JA. Extended Output Phasor Representation of Multi-Spectral Fluorescence Lifetime Imaging Microscopy. Biomed Opt Express (2015) 6(6):2088. doi:10.1364/boe.6.002088
9. Chan TF, Vese LA. Active Contours without Edges. IEEE Trans Image Process (2001) 10(2):266–77. doi:10.1109/83.902291
10. Chen W, Avezov E, Schlachter SC, Gielen F, Laine RF, Harding HP, et al. A Method to Quantify FRET Stoichiometry with Phasor Plot Analysis and Acceptor Lifetime Ingrowth. Biophysical J (2015) 108(5):999–1002. doi:10.1016/j.bpj.2015.01.012
11. Chen H, Holst G, Gratton E. Modulated CMOS Camera for Fluorescence Lifetime Microscopy. Microsc Res Tech (2015a) 78(12):1075–81. doi:10.1002/jemt.22587
12. Clayton AHA, Hanley QS, Verveer PJ. Graphical Representation and Multicomponent Analysis of Single-Frequency Fluorescence Lifetime Imaging Microscopy Data. J Microsc (2004) 213(1):1–5. doi:10.1111/j.1365-2818.2004.01265.x
13. Clegg RM Chapter 1 Förster Resonance Energy Transfer-FRET what Is it, Why Do it, and How It's Done, Laboratory Techniques in Biochemistry and Molecular Biology, 33 (2009). p. 1–57. doi:10.1016/S0075-7535(08)00001-6
14. Colyer R, Siegmund O, Tremsin A, Vallerga J, Weiss S, Michalet X. Phasor-based Single-Molecule Fluorescence Lifetime Imaging Using a Wide-Field Photon-Counting Detector. Single Molecule Spectrosc Imaging (2009) (71850T) 7185. doi:10.1117/12.809496
15. Dagher M, Kleinman M, Ng A, Juncker D. Ensemble Multicolour FRET Model Enables Barcoding at Extreme FRET Levels. Nat Nanotech (2018) 13(10):925–32. doi:10.1038/s41565-018-0205-0
16. Dean KM, Palmer AE. Advances in Fluorescence Labeling Strategies for Dynamic Cellular Imaging. Nat Chem Biol (2014) 10(7):512–23. doi:10.1038/nchembio.1556
17. Demeautis C, Sipieter F, Roul J, Chapuis C, Padilla-Parra S, Riquet FB, et al. Multiplexing PKA and ERK1&2 Kinases FRET Biosensors in Living Cells Using Single Excitation Wavelength Dual Colour FLIM. Sci Rep (2017) 7(December):1–14. doi:10.1038/srep41026
18. Digman MA, Caiolfa VR, Zamai M, Gratton E. The Phasor Approach to Fluorescence Lifetime Imaging Analysis. Biophysical J (2008) 94(2):L14–L16. doi:10.1529/biophysj.107.120154
19. Esposito A, Venkitaraman AR. Enhancing Biochemical Resolution by Hyperdimensional Imaging Microscopy. Biophysical J (2019) 116(10):1815–22. doi:10.1016/j.bpj.2019.04.015
20. Esposito A, Gerritsen HC, Wouters FS. Fluorescence Lifetime Heterogeneity Resolution in the Frequency Domain by Lifetime Moments Analysis. Biophysical J (2005) 89(6):4286–99. doi:10.1529/biophysj.104.053397
21. Esposito A, Popleteeva M, Venkitaraman AR. Maximizing the Biochemical Resolving Power of Fluorescence Microscopy. PLoS ONE (2013) 8(10):e77392. doi:10.1371/journal.pone.0077392
22. Fereidouni F, Bader AN, Gerritsen HC. Spectral Phasor Analysis Allows Rapid and Reliable Unmixing of Fluorescence Microscopy Spectral Images. Opt Express (2012) 20(12):12729. doi:10.1364/oe.20.012729
23. Fereidouni F, Blab GA, Gerritsen HC. Blind Unmixing of Spectrally Resolved Lifetime Images. J Biomed Opt (2013) 18(8):086006. doi:10.1117/1.jbo.18.8.086006
24. Fereidouni F, Reitsma K, Gerritsen HC. High Speed Multispectral Fluorescence Lifetime Imaging. Opt Express (2013) 21(10):11769. doi:10.1364/oe.21.011769
25. Fereidouni F, Blab GA, Gerritsen HC. Phasor Based Analysis of FRET Images Recorded Using Spectrally Resolved Lifetime Imaging. Methods Appl Fluoresc (2014) 2(3):035001. doi:10.1088/2050-6120/2/3/035001
26. Forde TS, Hanley QS. Spectrally Resolved Frequency Domain Analysis of Multi-Fluorophore Systems Undergoing Energy Transfer. Appl Spectrosc (2006) 60(12):1442–52. doi:10.1366/000370206779321544
27. Fries MW, Haas KT, Ber S, Saganty J, Richardson EK, Venkitaraman AR, et al. Multiplexed Biochemical Imaging Reveals Caspase Activation Patterns Underlying Single Cell Fate. BioRxiv (2018). doi:10.1101/427237
28. Gadella TW, Jovin TM. Oligomerization of Epidermal Growth Factor Receptors on A431 Cells Studied by Time-Resolved Fluorescence Imaging Microscopy. A Stereochemical Model for Tyrosine Kinase Receptor Activation. J Cel Biol (1995) 129(6):1543–58. doi:10.1083/jcb.129.6.1543
29. Galperin E, Verkhusha VV, Sorkin A. Three-chromophore Fret Microscopy to Analyze Multiprotein Interactions in Living Cells. Nat Methods (2004) 1(3):209–17. doi:10.1038/nmeth720
30. Grant DM, Zhang W, McGhee EJ, Bunney TD, Talbot CB, Kumar S, et al. Multiplexed FRET to Image Multiple Signaling Events in Live Cells. Biophysical J (2008) 95(10):L69–L71. doi:10.1529/biophysj.108.139204
31. Grecco HE, Roda-Navarro P, Verveer PJ. Global Analysis of Time Correlated Single Photon Counting FRET-FLIM Data. Opt Express (2009) 17(8):6493. doi:10.1364/oe.17.006493
32. Guerrieri F, Tisa S, Tosi A, Zappa F. Two-dimensional SPAD Imaging Camera for Photon Counting. IEEE Photon J. (2010) 2(5):759–74. doi:10.1109/JPHOT.2010.2066554
33. Hanley QS, Clayton AHA. AB-plot Assisted Determination of Fluorophore Mixtures in a Fluorescence Lifetime Microscope Using Spectra or Quenchers. J Microsc (2005) 218(1):62–7. doi:10.1111/j.1365-2818.2005.01463.x
34. Hanley QS. Spectrally Resolved Fluorescent Lifetime Imaging. J R Soc Interf (2009) 6. doi:10.1098/rsif.2008.0393.focus
35. Hinde E, Digman MA, Welch C, Hahn KM, Gratton E. Biosensor Förster Resonance Energy Transfer Detection by the Phasor Approach to Fluorescence Lifetime Imaging Microscopy. Microsc Res Tech (2012) 75(3):271–81. doi:10.1002/jemt.21054
36. Hinde E, Digman MA, Hahn KM, Gratton E. Millisecond Spatiotemporal Dynamics of FRET Biosensors by the Pair Correlation Function and the Phasor Approach to FLIM. Proc Natl Acad Sci (2013) 110(1):135–40. doi:10.1073/pnas.1211882110
37. Jares-Erijman EA, Jovin TM. FRET Imaging. Nat Biotechnol (2003) 21(11):1387–95. doi:10.1038/nbt896
38. Kaufmann T, Herbert S, Hackl B, Besold JM, Schramek C, Gotzmann J, et al. Direct Measurement of Protein-Protein Interactions by FLIM-FRET at UV Laser-Induced DNA Damage Sites in Living Cells. Nucleic Acids Res (2020) 48(21):e122. doi:10.1093/nar/gkaa859
39. Kim J, Heo WD. Synergistic Ensemble of Optogenetic Actuators and Dynamic Indicators in Cell Biology. Mol Cell (2018) 41(9):809–17. doi:10.14348/molcells.2018.0295
40. Kogure T, Karasawa S, Araki T, Saito K, Kinjo M, Miyawaki A. A Fluorescent Variant of a Protein from the Stony Coral Montipora Facilitates Dual-Color Single-Laser Fluorescence Cross-Correlation Spectroscopy. Nat Biotechnol (2006) 24(5):577–81. doi:10.1038/nbt1207
41. Kremers G-J, Van Munster EB, Goedhart J, Gadella TWJ. Quantitative Lifetime Unmixing of Multiexponentially Decaying Fluorophores Using Single-Frequency Fluorescence Lifetime Imaging Microscopy. Biophysical J (2008) 95(1):378–89. doi:10.1529/biophysj.107.125229
42. Krstajić N, Levitt J, Poland S, Ameer-Beg S, Henderson R. 256 × 2 SPAD Line Sensor for Time Resolved Fluorescence Spectroscopy. Opt Express (2015) 23(5):5653–69. doi:10.1364/oe.23.005653
43. Lagarto JL, Villa F, Tisa S, Zappa F, Shcheslavskiy V, Pavone FS, et al. Real-time Multispectral Fluorescence Lifetime Imaging Using Single Photon Avalanche Diode Arrays. Sci Rep (2020) 10(1):1–10. doi:10.1038/s41598-020-65218-3
44. Lakowicz JR. Principles of Fluorescence Spectroscopy. Boston, MA: Springer. (2006). doi:10.1007/978-0-387-46312-4
45. Le Marois A, Shuling K. Multi-Parametric Live Cell Microscopy of 3D Tissue Models. Advances in Experimental Medicine and Biology. Russia. Springer International Publishing. (2017). doi:10.1007/978-3-319-67358-5
46. Levitt JA, Matthews DR, Ameer-Beg SM, Suhling K. Fluorescence Lifetime and Polarization-Resolved Imaging in Cell Biology. Curr Opin Biotechnol (2009) 20(1):28–36. doi:10.1016/j.copbio.2009.01.004
47. Levitt JA, Poland SP, Krstajic N, Pfisterer K, Erdogan A, Barber PR, et al. Quantitative Real-Time Imaging of Intracellular FRET Biosensor Dynamics Using Rapid Multi-Beam Confocal FLIM. Sci Rep (2020) 10(1):1–9. doi:10.1038/s41598-020-61478-1
48. Li IT, Pham E, Truong K. Protein Biosensors Based on the Principle of Fluorescence Resonance Energy Transfer for Monitoring Cellular Dynamics. Biotechnol Lett (2006) 28(24):1971–82. doi:10.1007/s10529-006-9193-5
49. Liang Z, Lou J, Scipioni L, Gratton E, Hinde E. Quantifying Nuclear Wide Chromatin Compaction by Phasor Analysis of Histone Förster Resonance Energy Transfer (FRET) in Frequency Domain Fluorescence Lifetime Imaging Microscopy (FLIM) Data. Data in Brief (2020) 30:105401. doi:10.1016/j.dib.2020.105401
50. Lou J, Scipioni L, Wright BK, Bartolec TK, Zhang J, Masamsetti VP, et al. Phasor Histone FLIM-FRET Microscopy Quantifies Spatiotemporal Rearrangement of Chromatin Architecture during the DNA Damage Response. Proc Natl Acad Sci USA (2019) 116(15):7323–32. doi:10.1073/pnas.1814965116
51. Mai H, Poland SP, Mattioli Della Rocca F, Treacy C, Aluko J, Nedbal J, et al. Flow Cytometry Visualization and Real-Time Processing with a CMOS SPAD Array and High-Speed Hardware Implementation Algorithm. Proc.SPIE (2020) 11243. doi:10.1117/12.2544759
52. Malacrida L, Jameson DM, Gratton E. A Multidimensional Phasor Approach Reveals LAURDAN Photophysics in NIH-3T3 Cell Membranes. Sci Rep (2017) 7(1):1–11. doi:10.1038/s41598-017-08564-z
53. Mastop M, Bindels DS, Shaner NC, Postma M, Gadella TWJ, Goedhart J. Characterization of a Spectrally Diverse Set of Fluorescent Proteins as FRET Acceptors for mTurquoise2. Sci Rep (2017) 7(1):1–18. doi:10.1038/s41598-017-12212-x
54. Miyawaki A, Shcherbakova DM, Verkhusha VV. Red Fluorescent Proteins: Chromophore Formation and Cellular Applications. Curr Opin Struct Biol (2012) 22(5):679–88. doi:10.1016/j.sbi.2012.09.002
55. Molina-Guijarro JM, García C, Macías Á, García-Fernández LF, Moreno C, Reyes F, et al. Elisidepsin Interacts Directly with Glycosylceramides in the Plasma Membrane of Tumor Cells to Induce Necrotic Cell Death. PLoS ONE (2015) 10(10):e0140782–18. doi:10.1371/journal.pone.0140782
56. Niehörster T, Löschberger A, Gregor I, Krämer B, Rahn H-J, Patting M, et al. Multi-target Spectrally Resolved Fluorescence Lifetime Imaging Microscopy. Nat Methods (2016) 13(3):257–62. doi:10.1038/nmeth.3740
57. Niino Y, Hotta K, Oka K. Simultaneous Live Cell Imaging Using Dual FRET Sensors with a Single Excitation Light. PLoS ONE (2009) 4(6):e6036–9. doi:10.1371/journal.pone.0006036
58. Pian Q, Yao R, Sinsuebphon N, Intes X. Compressive Hyperspectral Time-Resolved Wide-Field Fluorescence Lifetime Imaging. Nat Photon (2017) 11(7):411–4. doi:10.1038/nphoton.2017.82
59. Poland SP, Krstajić N, Monypenny J, Coelho S, Tyndall D, Walker RJ, et al. A High Speed Multifocal Multiphoton Fluorescence Lifetime Imaging Microscope for Live-Cell FRET Imaging. Biomed Opt Express (2015) 6(2):277. doi:10.1364/boe.6.000277
60. Poland SP, Chan GK, Levitt JA, Krstajić N, Erdogan AT, Henderson RK, et al. Multifocal Multiphoton Volumetric Imaging Approach for High-Speed Time-Resolved Förster Resonance Energy Transfer Imaging In Vivo. Opt Lett (2018) 43(24):6057. doi:10.1364/ol.43.006057
61. Popleteeva M, Haas KT, Stoppa D, Pancheri L, Gasparini L, Kaminski CF, et al. Fast and Simple Spectral FLIM for Biochemical and Medical Imaging. Opt Express (2015) 23(18):23511. doi:10.1364/oe.23.023511
62. Qiu X, Guo J, Xu J, Hildebrandt N. Three-Dimensional FRET Multiplexing for DNA Quantification with Attomolar Detection Limits. J Phys Chem Lett (2018) 9(15):4379–84. doi:10.1021/acs.jpclett.8b01944
63. Rück A, Hauser C, Mosch S, Kalinina S. Spectrally Resolved Fluorescence Lifetime Imaging to Investigate Cell Metabolism in Malignant and Nonmalignant Oral Mucosa Cells. J Biomed Opt (2014) 19(9):96005–9. doi:10.1117/1.JBO.19.9.096005
64. Scott BL, Hoppe AD. Three-dimensional Reconstruction of Three-Way FRET Microscopy Improves Imaging of Multiple Protein-Protein Interactions. PLoS ONE (2016) 11(3):e0152401–17. doi:10.1371/journal.pone.0152401
65. Sharman KK, Periasamy A, Ashworth H, Demas JN, Snow NH. Error Analysis of the Rapid Lifetime Determination Method for Double-Exponential Decays and New Windowing Schemes. Anal Chem (1999) 71(5):947–52. doi:10.1021/ac981050d
66. Shcherbakova DM, Hink MA, Joosen L, Gadella TWJ, Verkhusha VV. An orange Fluorescent Protein with a Large Stokes Shift for Single-Excitation Multicolor FCCS and FRET Imaging. J Am Chem Soc (2012) 134(18):7913–23. doi:10.1021/ja3018972
67. Shcherbakova DM, Cox Cammer N, Huisman TM, Verkhusha VV, Hodgson L. Direct Multiplex Imaging and Optogenetics of Rho GTPases Enabled by Near-Infrared FRET. Nat Chem Biol (2018) 14(6):591–600. doi:10.1038/s41589-018-0044-1
68. Stringari C, Cinquin A, Cinquin O, Digman MA, Donovan PJ, Gratton E. Phasor Approach to Fluorescence Lifetime Microscopy Distinguishes Different Metabolic States of Germ Cells in a Live Tissue. Proc Natl Acad Sci (2011) 108(33):13582–7. doi:10.1073/pnas.1108161108
69. Sun Y, Wallrabe H, Booker CF, Day RN, Periasamy A. Three-color Spectral FRET Microscopy Localizes Three Interacting Proteins in Living Cells. Biophysical J (2010) 99(4):1274–83. doi:10.1016/j.bpj.2010.06.004
70. Szmacinski H, Toshchakov V, Lakowicz JR. Application of Phasor Plot and Autofluorescence Correction for Study of Heterogeneous Cell Population. J Biomed Opt (2014) 19(4):046017. doi:10.1117/1.jbo.19.4.046017
71. Trinh AL, Ber S, Howitt A, Valls PO, Fries MW Europe PMC Funders Group Fast Single-Cell Biochemistry : Theory, open source Microsc Appl (2020), 7. doi:10.1088/2050-6120/ab3bd2.Fast
72. Ulku A, Ardelean A, Antolovic M, Weiss S, Charbon E, Bruschini C, et al. Wide-field Time-Gated SPAD Imager for Phasor-Based FLIM Applications. Methods Appl Fluoresc (2020) 8(2):024002. doi:10.1088/2050-6120/ab6ed7
73. Wang S, Shen B, Ren S, Zhao Y, Zhang S, Qu J, et al. Implementation and Application of FRET-FLIM Technology. J Innov Opt Health Sci (2019) 12(5):1930010–2. doi:10.1142/S1793545819300106
74. Warren S, Margineanu A, Katan M, Dunsby C, French P. Homo-FRET Based Biosensors and Their Application to Multiplexed Imaging of Signalling Events in Live Cells. Ijms (2015) 16(7):14695–716. doi:10.3390/ijms160714695
75. Zeug A, Woehler A, Neher E, Ponimaskin EG. Quantitative Intensity-Based FRET Approaches-A Comparative Snapshot. Biophysical J (2012) 103(9):1821–7. doi:10.1016/j.bpj.2012.09.031
Keywords: sFLIM, FRET biosensors, TCSPC, spectral demixing, biochemical multiplexing
Citation: Haas KT, Fries MW, Venkitaraman AR and Esposito A (2021) Single-Cell Biochemical Multiplexing by Multidimensional Phasor Demixing and Spectral Fluorescence Lifetime Imaging Microscopy. Front. Phys. 9:637123. doi: 10.3389/fphy.2021.637123
Received: 02 December 2020; Accepted: 07 May 2021;
Published: 27 May 2021.
Edited by:
Klaus Suhling, King’s College London, United KingdomReviewed by:
Jianming Wen, Kennesaw State University, United StatesMarc Tramier, UMR6290 Institut de Genetique et de Developpement de Rennes (IGDR), France
Copyright © 2021 Haas, Fries, Venkitaraman and Esposito. This is an open-access article distributed under the terms of the Creative Commons Attribution License (CC BY). The use, distribution or reproduction in other forums is permitted, provided the original author(s) and the copyright owner(s) are credited and that the original publication in this journal is cited, in accordance with accepted academic practice. No use, distribution or reproduction is permitted which does not comply with these terms.
*Correspondence: Kalina T. Haas, a2FsaW5hLmhhYXNAaW5yYWUuZnI=