- 1Zhejiang Climate Center, Meteorological Bureau of Zhejiang Province, Hangzhou, China
- 2Ankang Meteorological Bureau of Shaanxi Province, Ankang, China
Since preindustrial times, atmospheric CO2 content increased continuously, leading to global warming through the greenhouse effect. Oceanic carbon sequestration mitigates global warming; on the other hand, oceanic CO2 uptake would reduce seawater pH, which is termed ocean acidification. We perform Earth system model simulations to assess oceanic CO2 uptake, surface temperature, and acidification for Zhejiang offshore, one of the most vulnerable areas to marine disasters. In the last 40 years, atmospheric CO2 concentration increased by 71 ppm, and sea surface temperature (SST) in Zhejiang offshore increased at a rate of 0.16°C/10a. Cumulative oceanic CO2 uptake in Zhejiang offshore is 0.3 Pg C, resulting in an increase of 20% in sea surface hydrogen ion concentration, and the acidification rate becomes faster in the last decade. During 2020–2040, under four RCP scenarios, SST in Zhejiang offshore increases by 0.3–0.5°C, whereas cumulative ocean carbon sequestration is 0.150–0.165 Pg C. Relative to RCP2.6, the decrease of surface pH in Zhejiang offshore is doubled under RCP8.5. Furthermore, simulated results show that the relationship between CO2 scenario and oceanic carbon cycle is nonlinear, which hints that deeper reduction of anthropogenic CO2 emission may be needed if we aim to mitigate ocean acidification in Zhejiang offshore under a higher CO2 concentration scenario. Our study quantifies the variation characteristics of oceanic climate and carbon cycle fields in Zhejiang offshore, and provides new insight into the responses of oceanic carbon cycle and the climate system to oceanic carbon sequestration.
Introduction
Atmospheric CO2 concentration has reached 410.07 ± 0.10 ppm (parts per million) by 2019, and increased by 46% since preindustrial time, which is primarily resulting from human activities of fossil fuel burning and land use changes [1]. Observational-based estimates showed that during 1750–2019, total anthropogenic CO2 emissions were 700 ± 75 Pg C (1 Pg C = 1015 g of carbon) [1]. About 41% of these emissions stayed in the atmosphere, whereas about 24% of these emissions were absorbed by the ocean, which is considered as a main sink of atmospheric CO2 [1]. Besides, the ocean also plays an important role in regulating climate by key air–sea interaction processes [2–6].
Increased atmospheric CO2 causes global warming (GW) through the greenhouse effect. Global warming has become one of the most challenging global issues and the core issue of global change [7–11]. Carbon capture and sequestration is a major player in reducing atmospheric CO2 concentrations and the resultant global warming. However, the absorption of anthropogenic CO2 by the ocean would also decrease seawater pH, causing ocean acidification and having important effects on the oceanic carbon cycle and ecosystem [12]. Therefore, it is important to investigate the response mechanisms of oceanic carbon cycle and climate system to oceanic CO2 sequestration. In addition, owing to the inhomogeneous physical and biogeochemical features in different oceanic basins or areas, vulnerability assessment of different oceanic areas under the impacts of climate change has become a forefront topic of international scientific research [13–16].
Besides GW, ocean acidification is another significant impact induced by greenhouse gas emissions [12, 17, 18]. With the increased annual CO2 emissions, ocean acidification has been exacerbated in recent years [19]. The main concern of ocean acidification originates from its potentially adverse effects of CaCO3 saturation state (Ω) reductions on marine calcifying organisms. Reduced Ω would decrease the calcification rate and increase the CaCO3 dissolution rate of calcifying organisms, making their skeletons or shells vulnerable [20–23]. For instance, aragonite is the main constituent of corals’ calcareous endoskeleton; therefore, corals surrounded by seawater which is undersaturated with respect to aragonite (ΩA < 1) could encounter adverse effects. There are intriguing evidences that CaCO3 could also dissolve even in supersaturated seawater [24, 25].
Marine organisms in the China seas are ecologically and economically important. China is known as one of the most important countries of ocean aquaculture industry, where more than 70% of the major cities and 50% of the populations are concentrated in the eastern and southern coastal regions. Maintaining sustainable development of resources and environment in offshore and coastal regions is an urgent strategic requirement for the future development of the country [26, 27]. Zhejiang is a highly developed province in East China, which takes a leading position in the national marine economic development strategy. Therefore, it is necessary to assess the variation characteristics of oceanic climate, carbon cycle, and acidification in Zhejiang offshore. However, due to the lack of historical observational data in oceanic physical and chemical fields, uncertainties exist in assessing changes in oceanic climate, acidification, and biogeochemical processes in regional areas.
In this study, the variation characteristics of oceanic CO2 uptake, SST, and ocean acidification in historical times and future trends in Zhejiang offshore are quantified. In order to acquire reasonable assessments, reanalysis data and numerical simulated results are used. The data and model used are introduced in Data and Method section, changes in oceanic carbon cycle and climate system are analyzed in Results section, and the summary and advice for adapting to climate change and ocean acidification are in Conclusion and Discussion section.
Data and Modeling
Data and Method
The historical SST data used in this article are from ERA-Interim high-precision reanalysis data published by the ECMWF (European Center for Medium-Range Weather Forecasts) [28]. The time span is 1980–2019, and the resolution is 0.125° × 0.125°.
Seawater pH is a measurement to quantify the degree of ocean acidification [29]. The increased hydrogen ion concentration tended to reduce carbonate ion concentration (
Model and Simulations
The University of Victoria Earth System Climate Model (UVic ESCM) version 2.9 used in this study is an intermediate complexity Earth system model [30]. The UVic model is composed of an energy–moisture balance atmospheric model, a 3-D ocean general circulation model, a thermodynamic/dynamic sea ice model, and land and ocean carbon cycle models [31–34]. The model’s horizontal resolution is 1.8° (latitude)×3.6° (longitude), which is similar to most coupled atmosphere–ocean general circulation models (AOGCMs). The ocean model of UVic is the modular ocean model (MOM) version 2.2 developed by the Geophysical Fluid Dynamics Laboratory (GFDL), which has a vertical resolution of 19 levels [35].
First, the UVic model was spun up for 10,000 model years with a fixed preindustrial CO2 concentration of 280 ppm to reach a quasi-equilibrium state of carbon cycle and the climate system. Then, this preindustrial state was used as an initial condition for the calendar year of 1800, 300-years transient simulations were performed (i.e., from 1800 to 2100) [36, 37]. From 1800 to 2019, atmospheric CO2 concentration data were taken from observation-based estimates [38], and after 2019, CO2 concentrations were taken from the Representation Concentration Pathway scenarios (RCPs) and their extensions up to 2100. The four scenarios used are RCP2.6, RCP4.5, RCP6.0, and RCP8.5, based on different mitigation policies for greenhouse gases [39, 40]. The numbers after “RCP” represent that by 2100, the radiative forcing reaches 2.6, 4.5, 6.0, and 8.5 W m−2, respectively.
Analysis of Marine Chemistry Fields
In this study, we calculate ocean carbonate chemistry fields, such as pH, based on equations in the Ocean Carbon-Cycle Model Intercomparison Project phase 3 (OCMIP-3, http://ocmip5.ipsl.jussieu.fr/OCMIP/). UVic-simulated ocean temperature, salinity, DIC (dissolved inorganic carbon), ALK (alkalinity), and data-based estimates of ocean silicate and phosphate concentrations from the GLODAP (Global Ocean Data Analysis Project) [41] are used. The calculations are shown as follows [42].
Thermodynamic carbonate chemistry fields generally include the following six variables: DIC, ALK, [H+], [CO2], [CO32-], and [HCO3−]. Here, [CO2] represents the sum of aqueous carbon dioxide concentrations and H2CO3 (carbonate acid); [HCO3−] denotes bicarbonate ion concentration. Equilibrium expressions for H2CO3 dissociation are as follows:
Expressions for DIC and ALK are as follows:
Based on the above six variables (DIC, ALK, [H+], [CO2], [CO32-], and [HCO3−]) and four equations (Eqs 2–5), and given two known variables, we can calculate the rest of the four variables [43].
Regions of Interest
This study investigates historical and future variation characteristics of oceanic CO2 uptake, SST, and ocean acidification in Zhejiang offshore, China. Our regions of interest include the oceanic area of 27.0°–31.0° latitude and 120.0°–124.2° longitude (Figure 1). Zhejiang offshore locates in North West of the East China Sea, the subtropical humid climate zone [44]. In addition to the atmospheric circulation system, including East Asian monsoon, the climate system in Zhejiang offshore could also be affected by the continental climate system and oceanic currents, such as the Kuroshio and coastal upwelling currents [45]. Zhejiang is a highly developed province in East China, which takes a leading position in national marine economic development strategy. Changes in oceanic carbon cycle and climate system in Zhejiang offshore could have drastic effects on millions of people who depend on marine resources.
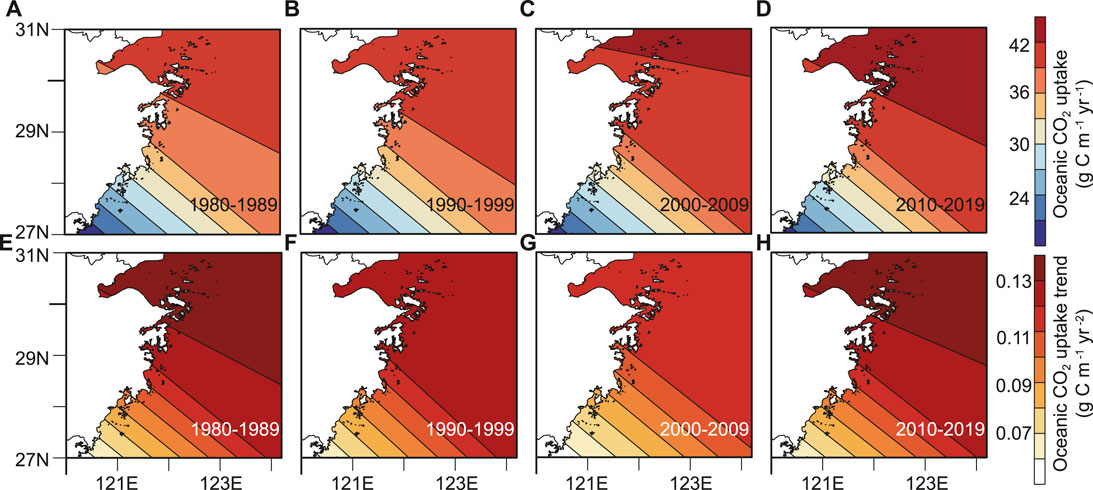
FIGURE 1. Spatial distributions of simulated decadal mean (A–D) oceanic CO2 uptake and (E–H) trends of oceanic CO2 uptake in Zhejiang offshore. Results are shown for (A,E) 1980–1989, (B,F) 1990–1999, (C,G) 2000–2009, and (D,H) 2010–2019.
Results
Model-simulated historical oceanic CO2 uptake for the global ocean is consistent with observation-based estimates reported by IPCC AR5 (Intergovernmental Panel on Climate Change Fifth Assessment Report) [46]. For example, UVic-simulated cumulative oceanic CO2 uptake during preindustrial time to 2011 was 147 Pg C, which compares well with the observational range of 155 ± 30 Pg C reported by IPCC AR5 (Table 1). Model-simulated averaged oceanic CO2 uptake during 2002 to 2011 was 2.4 Pg C yr−1, within the observed value of 2.4 ± 0.7 Pg C yr−1 (Table 1).
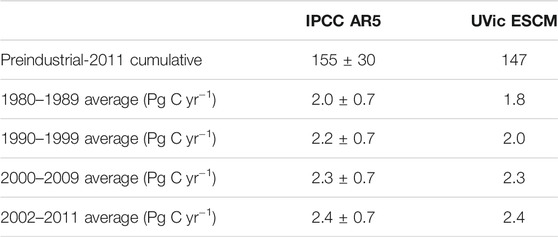
TABLE 1. Model-simulated global oceanic CO2 uptake compared with observation-based estimates reported by IPCC AR5, which show uncertainties as 90% confidence intervals [46].
Model-simulated key carbon-related tracers are also compared with observation-based estimates from the GLODAP [46]. As shown in Figure 2, simulated vertical profiles of DIC and ALK for Zhejiang offshore largely agree with observed estimates. In addition, UVic-simulated large-scale distributions of key variables in the oceanic carbon cycle [45–47], climate [48–50], and historical oceanic uptake of carbon and its isotopes [42] also compare well with observation-based estimates.
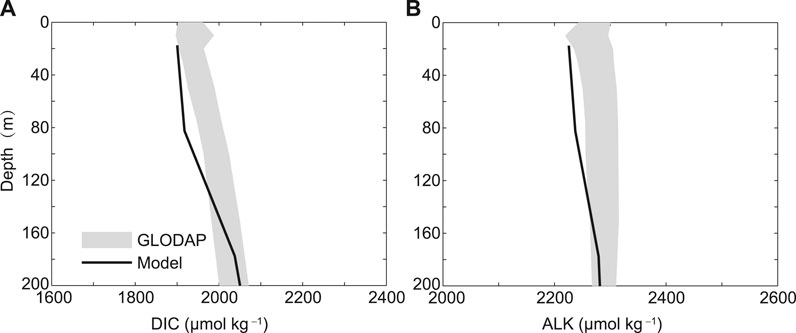
FIGURE 2. Modeled mean vertical profiles for Zhejiang offshore of (A) dissolved inorganic carbon (DIC) and (B) alkalinity (ALK) (1990–1999 average) compared with observed estimates from GLODAP data (gray shaded areas denote estimated uncertainties) [41].
SST and Ocean Acidity of Zhejiang Offshore in the Last 40 Years
Zhejiang offshore SST ranges from 19 to 22°C, with higher SST farther offshore at the same latitude. From 1980 to 2019, the hottest season in Zhejiang offshore sea surface is summer, with SST mainly in the range of 25–28°C, whereas the coldest season is winter, with SST in the 13–17°C range. Across the four seasons, SST spatial gradient is larger in spring and winter, and the smallest in summer.
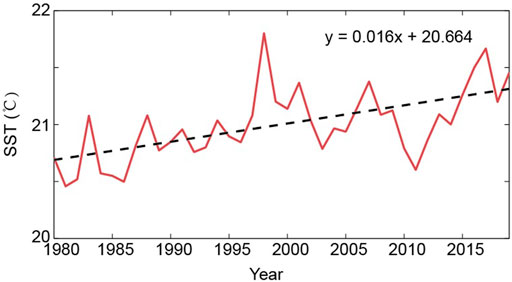
Observation-based estimates show that during 1980–2019, atmospheric CO2 concentration increased from 339 to 410 ppm. The increment of atmospheric CO2 concentration led to rising SST through the enhanced greenhouse effect (Figure 3). During 1980–2019, SST of Zhejiang offshore increased at a rate of 0.16°C/10a, which reached its highest level in 1998 (21.8°C), and the lowest in 1981 (20.5°C) (Figure 3). From the perspective of interdecadal change, SST of Zhejiang offshore mainly increased from 1980s to late 1990s, decreased at the beginning of the 21st century, and increased again in the 2010s. Annual mean SST of Zhejiang offshore reached 21.5°C in 2019.
In addition to rising seawater temperatures, another important impact of CO2 emissions on marine environment is ocean acidification. With the increasing of atmospheric CO2 concentration, the ocean, as an important carbon sink, continuously absorbs anthropogenic CO2 from the atmosphere (Figures 1, 4). For instance, simulated results show that during 1980–2019, cumulative oceanic CO2 uptake in Zhejiang offshore is 0.3 Pg C. The increase of annual oceanic CO2 uptake in Zhejiang offshore is largely related to the rise of atmospheric CO2 concentration. Continuous oceanic CO2 uptake would lead to ocean acidification, resulting in the rise of seawater hydrogen ion concentration, reducing the calcification rate of marine organisms, making their skeletons or shells vulnerable, and consequently, having adverse impacts on the marine ecosystem.
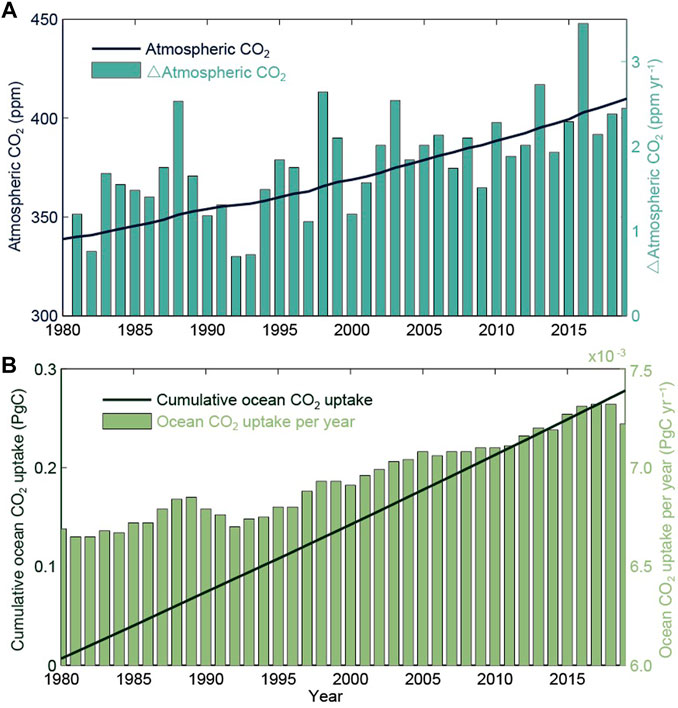
FIGURE 4. (A) Prescribed atmospheric CO2 concentration and (B) model-simulated time series of annual cumulative oceanic CO2 uptake in Zhejiang offshore (lines). Changes of atmospheric CO2 concentration relative to the previous year and oceanic CO2 uptake per year are also shown by the boxes.
In the last 40 years, atmospheric CO2 concentration increased by 21%. Simulated results show that the decrease rate of pH in Zhejiang sea surface is closely related to the increasing rate of atmospheric CO2 concentration and oceanic CO2 uptake. With the increase of atmospheric CO2, the ocean’s continuous absorption of CO2 leads to the exacerbation of ocean acidification in Zhejiang offshore (Figures 1, 4-6).
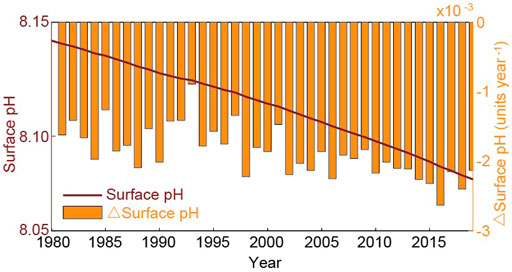
FIGURE 5. Model-simulated time series of annual mean sea surface pH in Zhejiang offshore (line). Changes of surface pH relative to the previous year are also shown by the boxes.
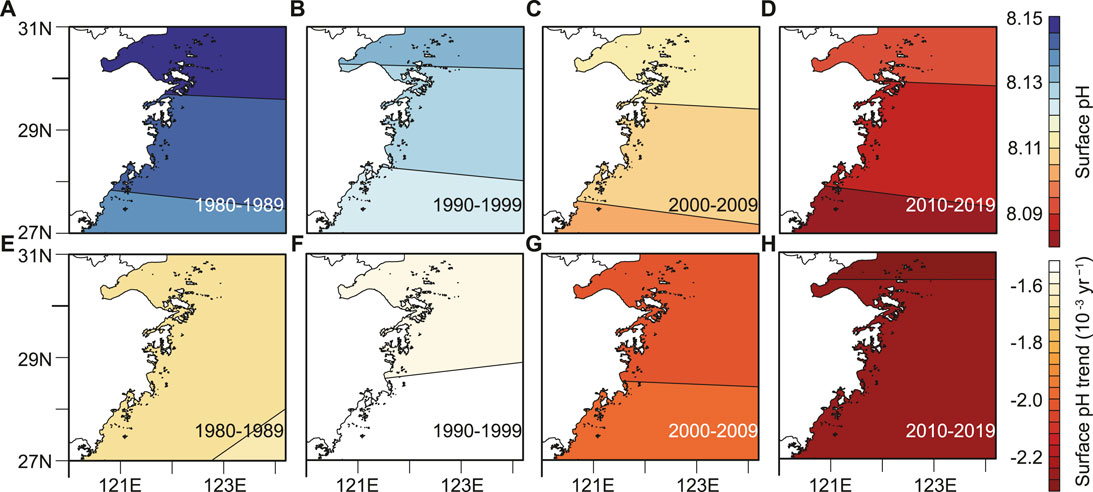
FIGURE 6. Spatial distributions of simulated decadal mean (A–D) sea surface pH and (E–H) trends of sea surface pH in Zhejiang offshore. Results are shown for (A,E) 1980–1989, (B,F) 1990–1999, (C,G) 2000–2009, and (D,H) 2010–2019.
Compared with low- and high-latitude sea surface, sea surface of Zhejiang offshore, which is located in the mid-latitude, suffered greater acidification. During 1980–2019, sea surface pH at low and high latitudes decreased by 0.06 units, while that at Zhejiang offshore decreased by 0.08 units, 23% greater than the decrease rate of sea surface pH in the global ocean. As atmospheric CO2 increases, the acidification rate of seawater also accelerates. For the past 20 years, especially the last 10 years (2010–2019), the reduction rate of Zhejiang offshore sea surface pH significantly accelerated compared to 1980–1999. The pH reduction rate increased from 0.017/10a in 1980–1989 to 0.023/10a in 2010–2019 (accelerated by 35%, Figure 6).
Zhejiang offshore is the habitat of a large number of marine organisms, where fisheries amount to about 220,000 km2. The main fishery products include fish, shrimp, crab, shellfish, and other calcified organisms. The total allowable catch in Zhejiang offshore ranks the first in China, and in recent years, the annual production all reached three million tons. By conducting pCO2/pH perturbation experiments, Wu and Gao concluded that, the effects of ocean acidification and solar UV changes would also suppress photosynthesis in the China seas [51]. Physiology, morphology, and behavior of some marine organisms (e.g., cnidarians and molluscs) would also be influenced by seawater acidification [52]. Therefore, ocean acidification would have important effects on the basic biochemical processes and ecosystem in Zhejiang offshore, leading to reductions in fisheries and aquaculture production, resulting in economic losses and important impacts on millions of people depending on seafood and other marine resources. Meanwhile, acidified seawater could accelerate the corrosion of building materials, having adverse impacts on the quality of marine constructions, causing economic losses.
SST Changes and Ocean Acidification of Zhejiang Offshore in the Next 20 Years
The UVic model was used to quantify changes in SST and ocean acidification in Zhejiang offshore from 2020 to 2040, under different greenhouse gas emission scenarios (RCP2.6, RCP4.5, RCP6.0, and RCP8.5). Under four RCP scenarios, atmospheric CO2 concentration would increase by 28–74 ppm in the next 20 years, resulting in a rise of 0.3–0.5°C in Zhejiang offshore SST (Figures 7A,C).
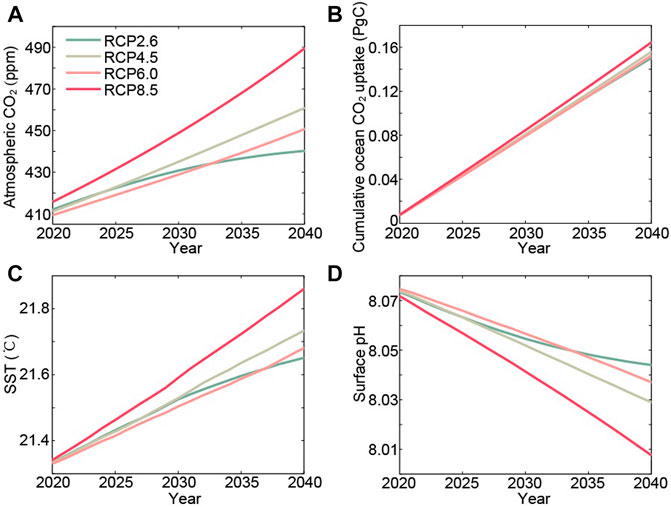
FIGURE 7. (A) Prescribed atmospheric CO2 concentration and model-simulated time series of annual mean (B) cumulative oceanic CO2 uptake, sea surface (C) temperature, and (D) pH in Zhejiang offshore. Results are shown for the four simulations using the four RCP scenarios depicted in the Data and Modeling section.
With the continuing increases in atmospheric CO2 content, Zhejiang offshore keeps absorbing atmospheric CO2, resulting in continuous acidification of seawater. During 2020–2040, under different RCP scenarios, simulated cumulative CO2 uptakes of Zhejiang offshore are 0.150–0.165 Pg C (Figure 7B). Under RCP8.5, from 2020 to 2040, Zhejiang sea surface pH decreases by 0.07, corresponding to an increase of 17% in hydrogen ion concentration, while under the RCP2.6 scenario, Zhejiang sea surface pH decreases by 0.03, corresponding to an increase of 7% in hydrogen ion concentration (Figure 7D). Therefore, in the next 20 years, resulting from the rises in atmospheric CO2 concentration, Zhejiang offshore SST would rise continuously, and risks of ocean acidification would further increase. Consequently, further studies would be needed to develop a better understanding of the effects of climate change on the marine ecosystem; meanwhile, the capacity of climate change adaptation in Zhejiang should be improved.
The Nonlinear Relationship Between Atmospheric CO2 Scenario and Oceanic Carbon Cycle
Simulated results under different scenarios show that the relationships among the atmospheric CO2 scenario used, oceanic climate, and carbon cycle fields in Zhejiang offshore are nonlinear (Figure 8). First, the RCP scenario of high CO2 emissions does not necessarily correspond to high atmospheric CO2 concentration. For example, during 2020–2040, atmospheric CO2 concentration of RCP4.5 is higher than that of RCP6.0. Therefore, the RCP scenario of higher CO2 emissions does not necessarily lead to larger oceanic CO2 uptake, higher SST, or lower surface pH. For instance, at 2040, simulated oceanic CO2 uptake in Zhejiang offshore is larger under RCP4.5 than that under RCP6.0 (0.0076 Pg C in RCP4.5 and 0.0074 Pg C in RCP6.0, respectively). In 2040, Zhejiang offshore seawater would experience greater warming and acidification under RCP4.5 than under RCP6.0 (Figures 8B,C). In addition, the RCP scenario of higher CO2 emissions not necessarily leads to faster change of oceanic CO2 uptake, SST, or surface pH. For example, at 2040, Δsurface pH/ΔCO2 is faster under RCP4.5 than that under RCP6.0 (−0.40 units/100 ppm in RCP4.5 versus −0.37 units/100 ppm in RCP6.0, Figure 9).

FIGURE 8. Prescribed atmospheric CO2 concentration against model-simulated (A) oceanic CO2 uptake, (B) sea surface temperature, and (C) sea surface pH in Zhejiang offshore at 2040. Results are shown for the four simulations using the four RCP scenarios depicted in the Data and Modeling section, revealing the nonlinearity relationships among the atmospheric CO2 scenario used, oceanic climate, and carbon cycle fields.

FIGURE 9. Model-simulated time series of (A) Δoceanic CO2 uptake/ΔCO2, (B) Δsea surface temperature/ΔCO2, and (C) Δsea surface pH/ΔCO2 in Zhejiang offshore. Results are shown for the four simulations using the four RCP scenarios depicted in the Data and Modeling section.
Second, the relationship among atmospheric CO2 concentration, ocean climate, and carbon cycle fields in Zhejiang offshore is nonlinear. For instance, at 2040, for Zhejiang offshore sea surface pH, ΔpH RCP8.5-RCP4.5/ΔCO2RCP8.5-RCP4.5 = -0.0749 units/100 ppm, ΔpH RCP4.5-RCP6.0/ΔCO2RCP4.5-RCP6.0 = -0.0796 units/100 ppm, while ΔpH RCP6.0-RCP2.6/ΔCO2RCP6.0-RCP2.6 = -0.0803 × 10⁻⁴ units/100 ppm, indicating faster acidification rates under scenarios of lower atmospheric CO2 concentration. In comparison, the relationships among atmospheric CO2 concentration, oceanic CO2 uptake, and SST are far more nonlinear (Figures 8A,B). For example, at 2040, for SST in Zhejiang offshore, ΔSST RCP8.5-RCP4.5/ΔCO2RCP8.5-RCP4.5 = -0.44°C/100 ppm, ΔSST RCP4.5-RCP6.0/ΔCO2RCP4.5-RCP6.0 = -0.52°C/100 ppm, while ΔSST RCP6.0-RCP2.6/ΔCO2RCP6.0-RCP2.6 = -0.35°C/100 ppm. The nonlinearity between atmospheric CO2 concentration and ocean acidification is noteworthy because it hints that if we aim to mitigate ocean acidification in Zhejiang offshore under a high emission scenario, deeper reductions of anthropogenic CO2 emission may be needed.
Conclusion and Discussion
Under the background of greenhouse gas emissions and GW, it is an important issue to analyze the variation characteristics in ocean climate and carbon cycle fields, which determines the capacity of the ocean to capture atmospheric CO2 [53–55]. In this article, changes of oceanic CO2 uptake, SST, and acidification in Zhejiang offshore in last 40 years are assessed. Future changes in the next 20 years are also simulated by the UVic Earth system model. In addition, we also quantify the differences of oceanic carbon cycle under different RCP scenarios, which contributes to develop a better understanding of oceanic carbon capture and climate adaptation.
Our results show that over the past 40 years, with the increasing atmospheric CO2 content, SST in Zhejiang offshore increased at a rate of 0.16°C/10a. Meanwhile, the increase of annual oceanic CO2 uptake in Zhejiang offshore is also closely related to the rise of atmospheric CO2 concentration, which results in an increase of 20% in sea surface hydrogen ion concentration over the past 40 years, and accelerated acidification over the past 10 years.
Previous projects and studies also reported data-based estimates of changes in oceanic climate and seawater acidity. For instance, Kennedy et al. announced an increase in global SST of 0.124 ± 0.030°C/10a in 1979–2012 by using observation-based HadSST3 data [56]. Smith et al. reported an increase in global SST of 0.105 ± 0.031°C/10a in 1979–2012 by using ERSSTv3b data [57]. These assessed SST growth rates are relatively slower than our result of 0.16°C/10a for Zhejiang offshore. Ishii et al. analyzed observations in the coast of western North Pacific, reporting a decrease rate of 0.020 ± 0.007 units/10a in surface pH during 1994–2008 [58], consistent with our simulated results, faster than central Pacific of 0.014 ± 0.002 units/10a in 1998–2007 [59] and Eastern North Atlantic Ocean of 0.015 ± 0.002 units/10a in 1995–2004 [60]. Therefore, Zhejiang offshore is one of the most vulnerable areas to climate change and ocean acidification.
Four CO2 emission scenarios are used to simulate oceanic CO2 uptake, SST, and pH in Zhejiang offshore during 2020–2040. By 2040, with the rise of atmospheric CO2 concentration under four RCP scenarios, SST in Zhejiang offshore increases by 0.3–0.5°C, whereas cumulative oceanic CO2 uptake is 0.150–0.165 Pg C, leading to a decrease of sea surface pH by 0.03–0.07. Compared to RCP2.6, the decrease of surface pH in Zhejiang offshore is doubled under RCP8.5. In addition, the relationship between the CO2 scenario used and oceanic carbon cycle is nonlinear, which is important because if we want to mitigate ocean acidification in Zhejiang offshore under a higher CO2 concentration scenario, more effective anthropogenic CO2 emission reductions may be needed.
This study has investigated the variation characteristics of oceanic climate and carbon cycle fields in Zhejiang offshore on timescales of decades by using an Earth system model. Some processes or feedbacks that are not considered in this study may also have impacts on the ocean carbon cycle and climate system. For instance, ocean acidification tends to decrease the calcification rate of some ocean calcifying organisms, increasing sea surface alkalinity, promoting oceanic CO2 sequestration, and mitigating ocean acidification. Moreover, this study has not included the interactive effects between ocean acidification and CaCO3 in the sediments, which is considered to mitigate the chemistry change in the deep ocean on millennia timescales.
Until now, although Zhejiang has taken steps to develop climate change adaptation and emission reduction policies, more meteorological and climatological measures still need to be adopted to reduce the impacts of extreme climate events on coastal regions, for example, 1) strengthening the monitoring and early warning system for marine disasters in Zhejiang province; 2) paying more attention to the adverse impacts of future climate change on marine fisheries, aquaculture, ecosystems, major infrastructure constructions, and city planning in coastal regions; and 3) investigating innovations to cope with the adverse effects of marine disasters, which is crucial for the sustainable development of the oceans. In addition, further observational and modeling studies would be required to develop a better understanding of the response of oceanic carbon cycle and the climate system to oceanic carbon sequestration, which is vital for more reliable projections of future climate and marine ecosystem changes.
Data Availability Statement
The original contributions presented in the study are included in the article/Supplementary Material; further inquiries can be directed to the corresponding author.
Author Contributions
All authors contributed to this research in collaboration. KW and HZ wrote the manuscript, GF proposed the conceptualization, ZL, ZY, and PL provided substantial help with the paper schedule and gave advice on the experiment and supervised. All authors have read and agreed to the published version of the manuscript.
Funding
This study was supported by the Natural Science Foundation of Zhejiang Province (LQ20D050003), the Natural Science Foundation of China (42005027 and 41605049), the Key R&D Program of Zhejiang Province (2021C02036), Fund for Meteorological Science and Technology of Zhejiang Province, China (2019YB03 and 2020YB04), the Natural Science Basic Research Program of Shaanxi (2021JQ-957), and the Talent Cultivation Project of Zhejiang Association for Science and Technology in 2020 (CTZB-2020080127).
Conflict of Interest
The authors declare that the research was conducted in the absence of any commercial or financial relationships that could be construed as a potential conflict of interest.
Publisher’s Note
All claims expressed in this article are solely those of the authors and do not necessarily represent those of their affiliated organizations, or those of the publisher, the editors, and the reviewers. Any product that may be evaluated in this article, or claim that may be made by its manufacturer, is not guaranteed or endorsed by the publisher.
References
1. Friedlingstein P, O'Sullivan M, Jones MW, Andrew RM, Hauck J, Olsen A, et al. Global Carbon Budget 2020. Earth Syst Sci Data (2020) 12(4):3269–340. doi:10.5194/essd-12-3269-2020
2. Cai W, Ng B, Geng T, Wu L, Santoso A, McPhaden MJ. Butterfly Effect and a Self-Modulating El Niño Response to Global Warming. Nature (2020) 585(7823):68–73. doi:10.1038/s41586-020-2641-x
3. Yin Z, Wang H, Ma X. Possible Relationship between the Chukchi Sea Ice in the Early Winter and the February Haze Pollution in the North China Plain. J Clim (2019) 32(16):5179–90. doi:10.1175/jcli-d-18-0634.1
4. Wang K, Feng G, Zeng Y, Li Z, Wang Y. Extraction of 10-30-day Stable Components from a Boreal Atmosphere during ENSO Phases. Discrete Dyn Nat Soc (2015) 2015:1–6. doi:10.1155/2015/919286
5. Guo Y, Tan Z. On the Sensitivity of the Relationship between Hadley Circulation Asymmetry and ENSO in CMIP5 Models. Geophys Res Lett (2018) 45(17):9253–9. doi:10.1029/2018gl079515
6. Hu D, Guan Z, Guo Y, Lu C, Jin D. Dynamical Connection between the Stratospheric Arctic Vortex and Sea Surface Temperatures in the North Atlantic. Clim Dyn (2019) 53(11):6979–93. doi:10.1007/s00382-019-04971-2
7. Hoegh-Guldberg O, Hughes L, McIntyre S, Lindenmayer DB, Parmesan C, Possingham HP, et al. ECOLOGY: Assisted Colonization and Rapid Climate Change. Science (2008) 321(5887):345–6. doi:10.1126/science.1157897
8. Dai A. Increasing Drought under Global Warming in Observations and Models. Nat Clim Change (2013) 3(1):52–8. doi:10.1038/nclimate1633
9. Huang J, Yu H, Guan X, Wang G, Guo R. Accelerated Dryland Expansion under Climate Change. Nat Clim Change (2016) 6(2):166–71. doi:10.1038/nclimate2837
10. Wang K, Feng G, Ye T, Wang X, Liu P. The Variation Characteristics of Asian Surface Temperature and Precipitation in the Early 21st century. Discrete Dyn Nat Soc (2016) 7929647. doi:10.1155/2016/7929647
11. Su T, Feng T, Feng G. Evaporation Variability under Climate Warming in Five Reanalyses and its Association with pan Evaporation over China. J Geophys Res Atmos (2015) 120(16):8080–98. doi:10.1002/2014jd023040
12. Caldeira K, Wickett ME. Anthropogenic Carbon and Ocean pH. Nature (2003) 425(6956):365. doi:10.1038/425365a
13. Yan P, Hou W, Feng G. Transition Process of Abrupt Climate Change Based on Global Sea Surface Temperature over the Past century. Nonlin Process. Geophys (2016) 23(3):115–26. doi:10.5194/npg-23-115-2016
14. Wang K, Feng G, Zhang H, Li Z, Fan G, Yu Z. Climate Change Characteristics and Adaptation in the Offshore East China Sea from 1979 to 2017. J Coastal Res (2020) 99(SI):54–9. doi:10.2112/si99-008.1
15. Cai R, Tan H, Kontoyiannis H. Robust Surface Warming in Offshore China Seas and its Relationship to the East Asian Monsoon Wind Field and Ocean Forcing on Interdecadal Time Scales. J Clim (2017) 30(22):8987–9005. doi:10.1175/jcli-d-16-0016.1
16. Guo Y, Tan Z. Westward Migration of Tropical Cyclone Rapid-Intensification over the Northwestern Pacific during Short Duration El Niño. Nat Commun (2018) 9(1). doi:10.1038/s41467-018-03945-y
17. McCulloch M, Falter J, Trotter J, Montagna P. Coral Resilience to Ocean Acidification and Global Warming through pH Up-Regulation. Nat Clim Change (2012) 2(8):623–7. doi:10.1038/nclimate1473
18. Zhai W. Exploring Seasonal Acidification in the Yellow Sea. Sci China Earth Sci (2018) 61(6):647–58. doi:10.1007/s11430-017-9151-4
19. Kwiatkowski L, Orr JC. Diverging Seasonal Extremes for Ocean Acidification during the Twenty-First century. Nat Clim Change (2018) 8(2):141–5. doi:10.1038/s41558-017-0054-0
20. Keir RS. The Dissolution Kinetics of Biogenic Calcium Carbonates in Seawater. Geochimica et Cosmochimica Acta (1980) 44(2):241–52. doi:10.1016/0016-7037(80)90135-0
21. Iglesias-Rodriguez MD, Halloran PR, Rickaby REM, Hall IR, Colmenero-Hidalgo E, Gittins JR, et al. Phytoplankton Calcification in a High-CO2 World. Science (2008) 320(5874):336–40. doi:10.1126/science.1154122
22. Lombard F, Da Rocha RE, Bijma J, Gattuso J. Effect of Carbonate Ion Concentration and Irradiance on Calcification in Planktonic Foraminifera. Biogeosciences (2010) 7(1):247–55. doi:10.5194/bg-7-247-2010
23. Subhas AV, Adkins JF, Rollins NE, Naviaux J, Erez J, Berelson WM. Catalysis and Chemical Mechanisms of Calcite Dissolution in Seawater. Proc Natl Acad Sci USA (2017) 114(31):8175–80. doi:10.1073/pnas.1703604114
24. Ning W, Liquan Z, Lin Y, Bing CH. Research into Vulnerability Assessment for Coastal Zones in the Context of Climate Change. Acta Ecologica Sinica (2012) 32(7):2248–58. doi:10.5846/stxb201109291437
25. Sarmiento JL, Gruber N. Ocean Biogeochemical Dynamics. Princeton University Press (2006). p. 73–394.
26. Gazeau F, Quiblier C, Jansen JM, Gattuso J, Middelburg JJ, Heip CHR. Impact of Elevated CO2 on Shellfish Calcification. Geophys Res Lett (2007) 34(7):L07603. doi:10.1029/2006gl028554
27. Wu T, Hou X, Xu X. Spatio-temporal Characteristics of the mainland Coastline Utilization Degree over the Last 70 Years in China. Ocean Coastal Manag (2014) 98:150–7. doi:10.1016/j.ocecoaman.2014.06.016
28. Dee D. The Climate Data Guide: ERA-Interim (2020). Available from: https://climatedata guide.ucar.edu/climate-data/era-interim.
29. Zhang H, Cao L. Simulated Effect of Calcification Feedback on Atmospheric CO2 and Ocean Acidification. Sci Rep (2016), United Kingdom 6:20284. doi:10.1038/srep20284
30. Schmittner A, Oschlies A, Matthews HD, Galbraith ED. Future Changes in Climate, Ocean Circulation, Ecosystems, and Biogeochemical Cycling Simulated for a Business-As-Usual CO2 emission Scenario until Year 4000 AD. Glob Biogeochem. Cycles (2008) 22(1):GB1013. doi:10.1029/2007gb002953
31. Hunke EC, Dukowicz JK. An Elastic-Viscous-Plastic Model for Sea Ice Dynamics. J Phys Oceanogr (1997) 27(9):1849–67. doi:10.1175/1520-0485(1997)027<1849:aevpmf>2.0.co;2
32. Bitz CM, Holland MM, Weaver AJ, Eby M. Simulating the Ice-Thickness Distribution in a Coupled Climate Model. J Geophys Res (2001) 106(C2):2441–63. doi:10.1029/1999jc000113
33. Fanning AF, Weaver AJ. An Atmospheric Energy-Moisture Balance Model: Climatology, Interpentadal Climate Change, and Coupling to an Ocean General Circulation Model. J Geophys Res (1996) 101(D10):15111–28. doi:10.1029/96jd01017
34. Meissner KJ, Weaver AJ, Matthews HD, Cox PM. The Role of Land Surface Dynamics in Glacial Inception: a Study with the UVic Earth System Model. Clim Dynam (2003) 21(7-8):515–37. doi:10.1007/s00382-003-0352-2
35. Pacanowski R. MOM 2 Documentation User's Guide and Reference Manual. In: GFDL Ocean Group Technical Report 3.2. Princeton: NOAA, GFDL (1995).
36. Cao L, Zhang H. The Role of Biological Rates in the Simulated Warming Effect on Oceanic CO2 Uptake. J Geophys Res Biogeosci (2017) 122(5):1098–106. doi:10.1002/2016jg003756
37. Zhang H, Wang K. Simulated CO2-induced Ocean Acidification for Ocean in the East China: Historical Conditions since Preindustrial Time and Future Scenarios. Sci Rep United Kingdom (2019) 9:18559. doi:10.1038/s41598-019-54861-0
38. Dlugokencky E, Tans P. Trends in atmospheric carbon dioxide. National Oceanic & Atmospheric Administration. USA: Earth System Research Laboratory (NOAA/ESRL) (2020). Available from: http://www.esrl.noaa.gov/gmd/ccgg/trends/global.html. [Accessed December 2, 2020].
39. Meinshausen M, Smith SJ, Calvin K, Daniel JS, Kainuma MLT, Lamarque J, et al. The RCP Greenhouse Gas Concentrations and Their Extensions from 1765 to 2300. Climatic Change (2011) 109(1-2):213–41. doi:10.1007/s10584-011-0156-z
40. Huang J, Yu H, Dai A, Wei Y, Kang L. Drylands Face Potential Threat under 2 °C Global Warming Target. Nat Clim Change (2017) 7(6):417–22. doi:10.1038/nclimate3275
41. Key RM, Kozyr A, Sabine CL, Lee K, Wanninkhof R, Bullister JL, et al. A Global Ocean Carbon Climatology: Results from Global Data Analysis Project (GLODAP). Glob Biogeochem Cy (2004) 18(4). doi:10.1029/2004gb002247
42. Zeebe RE, Wolf-Gladrow D. CO2 in Seawater: Equilibrium, Kinetics, Isotopes. Bremerhaven: Gulf Professional Publishing (2001).
43. Zeebe RE. History of Seawater Carbonate Chemistry, Atmospheric CO2, and Ocean Acidification. In: R Jeanloz, editor. Annual Review of Earth and Planetary Sciences, 40 (2012). p. 141–65. doi:10.1146/annurev-earth-042711-105521
44. Wei R, Zheng Y, Wu R, Xu X, Chen Y. Vertical Change of Simulated Wind Speed in Offshore Area of Zhejiang Province by Assimilating QuikSCAT Ocean Surface Winds. Sci Tech Eng (2016) 16(01):17–23+52. doi:10.1175/MWR-2861.1
45. Shen J, Zhou S, Dong Y, Cui X. Analysis on the winter Warm Currents in the East China Sea in the winter of 2003. J. Shanghai Fish. Univ. (2005). (1):51–4.
46. Ciais P, Sabine C, Bala G, Bopp L, Brovkin V, Canadell J, et al. Carbon and Other Biogeochemical Cycles. In: D Stocker TF, GK Qin, M Plattner, SK Tignor, J Allen, A Boschunget al. ,editors. Climate Change 2013: The Physical Science Basis. Contribution of Working Group I to the Fifth Assessment Report of the Intergovernmental Panel on Climate Change. Cambridge, United Kingdom and New York, NY, USA: Cambridge University Press (2013). p. 486.
47. Cao L, Wang S, Zheng M, Zhang H. Sensitivity of Ocean Acidification and Oxygen to the Uncertainty in Climate Change. Environ Res Lett (2014) 9(6):064005. doi:10.1088/1748-9326/9/6/064005
48. Zhang H, Cao L. Simulated Effects of Interactions between Ocean Acidification, marine Organism Calcification, and Organic Carbon export on Ocean Carbon and Oxygen Cycles. Sci China Earth Sci (2018) 61(6):804–22. doi:10.1007/s11430-017-9173-y
49. Schmittner A, Oschlies A, Giraud X, Eby M, Simmons HL. A Global Model of the marine Ecosystem for Long-Term Simulations: Sensitivity to Ocean Mixing, Buoyancy Forcing, Particle Sinking, and Dissolved Organic Matter Cycling. Glob Biogeochem Cycles (2005) 19(3):GB3004. doi:10.1029/2004gb002283
50. Weaver AJ, Eby M, Wiebe EC, Bitz CM, Duffy PB, Ewen TL, et al. The UVic Earth System Climate Model: Model Description, Climatology, and Applications to Past, Present and Future Climates. Atmosphere-Ocean (2001) 39(4):361–428. doi:10.1080/07055900.2001.9649686
51. Wu Y, Gao K. Combined Effects of Solar UV Radiation and CO2-induced Seawater Acidification on Photosynthetic Carbon Fixation of Phytoplankton Assemblages in the South China Sea. Chin Sci Bull (2010) 55(32):3680–6. doi:10.1007/s11434-010-4119-y
52. Ishimatsu A, Dissanayake A. Life Threatened in Acidic Coastal Waters. In: A Ishimatsu, and H Lie, editors. Coastal Environmental and Ecosystem Issues of the East China Sea. Tokyo: TERRAPUB and Nagasaki University (2010). p. 283–303.
53. Wei T, Yang S, Moore JC, Shi P, Cui X, Duan Q, et al. Developed and Developing World Responsibilities for Historical Climate Change and CO2 Mitigation. Proc Natl Acad Sci (2012) 109(32):12911–5. doi:10.1073/pnas.1203282109
54. Huang B, Su T, Wu Y, Feng G. The Interdecadal Reverse of the Relationship and Feedback Mechanism between Sea Surface Temperature and Evaporation over the Indian Ocean during Boreal Autumn. J Clim (2020) 33(23):10205–19. doi:10.1175/jcli-d-20-0009.1
55. Han Z, Su T, Zhang Q, Wen Q, Feng G. Thermodynamic and Dynamic Effects of Increased Moisture Sources over the Tropical Indian Ocean in Recent Decades. Clim Dyn (2019) 53(11):7081–96. doi:10.1007/s00382-019-04977-w
56. Kennedy JJ, Rayner NA, Smith RO, Parker DE, Saunby M. Reassessing Biases and Other Uncertainties in Sea Surface Temperature Observations Measured In Situ since 1850: 2. Biases and Homogenization. J Geophys Res (2011) 116(D14):D14104. doi:10.1029/2010jd015220
57. Smith TM, Reynolds RW, Peterson TC, Lawrimore J. Improvements to NOAA's Historical Merged Land-Ocean Surface Temperature Analysis (1880-2006). J Clim (2008) 21(10):2283–96. doi:10.1175/2007jcli2100.1
58. Ishii M, Kosugi N, Sasano D, Saito S, Midorikawa T, Inoue HY. Ocean Acidification off the South Coast of Japan: A Result from Time Series Observations of CO2 parameters from 1994 to 2008. J Geophys Res (2011) 116(C6):C06022. doi:10.1029/2010jc006831
59. Dore JE, Lukas R, Sadler DW, Karl DM. Climate-driven Changes to the Atmospheric CO2 Sink in the Subtropical North Pacific Ocean. Nature (2009) 424(6950):754–7. doi:10.1038/nature01885
Keywords: oceanic carbon sequestration, climate change, ocean acidification, UVic model, Zhejiang province
Citation: Wang K, Zhang H, Fan G-F, Li Z-Q, Yu Z-Y and Liu P-P (2021) Simulated Variation Characteristics of Oceanic CO2 Uptake, Surface Temperature, and Acidification in Zhejiang Province, China. Front. Phys. 9:718968. doi: 10.3389/fphy.2021.718968
Received: 01 June 2021; Accepted: 19 July 2021;
Published: 30 August 2021.
Edited by:
Yipeng Guo, Nanjing University, ChinaReviewed by:
Xuanze Zhang, Institute of Geographic Sciences and Natural Resources Research (CAS), ChinaTao Su, Yangzhou University, China
Copyright © 2021 Wang, Zhang, Fan, Li, Yu and Liu. This is an open-access article distributed under the terms of the Creative Commons Attribution License (CC BY). The use, distribution or reproduction in other forums is permitted, provided the original author(s) and the copyright owner(s) are credited and that the original publication in this journal is cited, in accordance with accepted academic practice. No use, distribution or reproduction is permitted which does not comply with these terms.
*Correspondence: Gao-Feng Fan, ZmFuZ2FvZmVuZ2NuQDE2My5jb20=
 Kuo Wang
 Han Zhang1