- School of Science, Shenyang Ligong University, Shenyang, China
In this paper, a calculation model is proposed for the optical parametric oscillation (OPO) process considering the crystal thermal effects. Based on existing models, we combine a set of three-wave coupled equations with the Sellmeier equation. In order to optimize the calculation of the nonlinear process, a temperature variable t is introduced to describe the heat generated by the laser crystal during operation. The waveforms under different pump powers are analyzed. The effects of the reflectivity of the output mirror on the OPO threshold and inverse conversion are investigated. In addition, the optimal reflectivity under different pump powers can be estimated. Based on the simulation results, experiments are also performed in the near-infrared 1.57 µm band and mid-infrared 3.15 µm band. The experimental results are compared with the results of this model and a model that does not consider crystal thermal effects. The experimental results are consistent with the improved theoretical results, affirming that the proposed theoretical model can simulate the energy conversion process of OPO. This provides a theoretical basis for optimizing the parameters of the OPO output mirror and improving the efficiency of the parametric wave conversion.
1 Introduction
The optical parametric oscillator based on periodically poled LiNbO3 crystals is an effective method to obtain coherent radiations in the eye-safe range of 1.5 µm and mid-infrared range of 3–5 μm, which has various applications in spectral analysis and remote sensing [1–4]. Optical parametric oscillation (OPO) uses the second-order nonlinear three-wave frequency mixing progress to realize the frequency conversion. During the conversion, each annihilation of a high-frequency photon simultaneously produces two low-frequency photons. The high-frequency wave is called “pump,” the higher low-frequency wave is called “signal,” and the other low-frequency wave is the “idler.” In an OPO process, when a strong pump beam is irradiated into the nonlinear crystal in the resonator, if the gain exceeds the loss, the signal and idler waves (parametric waves) are generated beyond the noise and amplified [5, 6]. When the power of the parametric waves reaches a certain value, the energy flows from the parametric waves to the pump wave, resulting in a decrease in the gain of the parametric wave. This phenomenon is called the inverse conversion [7]. Most of the current research focuses on how to improve the optical-to-optical conversion efficiency of OPO and beam quality.
In 2019, the Parsa S [8] team reported a continuously tunable laser with a tuning range of 2.198–4.028 μm, an average output power of 3.5 W, and a repetition rate of 80 MHz. In 2020, Guo et al. [9] used an acousto-optical Q-switched Tm:YAP laser, pumped by a PPLN-OPO, to obtain a laser with a wavelength of 3.87 μm. The pump source delivers a maximum output power of 6.17 W with a pulse duration of 45 ns and a repetition rate of 6 kHz. The maximum OPO output power is 1.2 W, corresponding to an optical–optical conversion efficiency of 19.4%.
Although OPO-related research has made rapid progress experimentally, there are not many theoretical models elucidating physical mechanisms related to OPO conversion efficiency. The first theoretical model was proposed by Brosnan et al. [10] and then improved by Guha [11] and Terry [12]. However, this model was based on the assumption that the pump power remained constant throughout the OPO process. As a result, some important OPO characteristics, such as optical-to-optical conversion efficiency and light intensity distribution, cannot be analyzed. Arlee et al. [13] added the consideration of group velocity and dispersion to the model, which further improved the theoretical model. Zhang et al. [14] considered the influence of the absorption of the idler wave on the conversion efficiency and ignored the lateral variation of the mixed wave to simplify the model calculation. Liu et al. [15] used a step-by-step integration to solve the five-wave coupling equations in their model and simulated the energy changes in the pump wave and parametric waves in the OPO process.
For the optical parametric oscillation model, the pump wave passes through the laser crystal continuously. The crystal accumulates heat in the laser-passing portion, which generates a temperature difference with the crystal edge position. This leads to different refractive indices at various points within the crystal, and the polarization period of the laser crystal drifts. It causes the optical parametric gain bandwidth spreading phenomenon [16], which affects the calculation of nonlinear processes in the optical parametric oscillator; thus, the influence of crystal thermal effects on the model results needs to be considered in the model.
In this paper, a calculation model is proposed for the optical parametric oscillation process considering the crystal thermal effects. It uses the step-by-step integration and Runge–Kutta methods to solve the linear and nonlinear terms in the three-wave coupling equation. Compared with the existing models, this model introduces the Sellmeier equation in the set of three-wave coupled equations. It is used to consider the influence of laser crystal thermal effects on the optical parametric oscillation process. The OPO output waveform and reflectivity of the output mirror under different pump powers are analyzed. The OPO threshold, inverse conversion, and the physical mechanism of the OPO conversion efficiency are discussed. Experiments are performed by pumping an MgO:PPLN crystal with different pump powers. The output powers of the near-infrared signal wave at a wavelength of 1.57 µm and the mid-infrared idler wave at a wavelength of 3.15 µm are measured. The effectiveness of the proposed improved OPO model in predicting energy conversion is verified by comparing theoretical and experimental results.
2 Theoretical analysis
The propagation process of the beam in the nonlinear crystal is simulated using the step-by-step integration method [17]. The pump laser source in an OPO is usually a paraxial Gaussian beam with a pulse duration in the order of nanoseconds. First, when a slow-varying envelope approximation and a paraxial approximation are applied to the nonlinear wave equation, a coupled wave equation of the nanosecond pulsed light can be obtained [18]. Consequently, in the split-step Fourier transform, the linear and nonlinear components of the wave equation are decoupled with a sufficiently small propagation step size. Each component can be solved independently with a relatively small error.
The three-wave coupling equation [19] is shown as follows:
where
When the pump wave passes through the crystal, the pump wave provides gain to the signal and idler waves. The interaction process obeys the three-wave coupled equations, in which the Sellmeier equation is introduced so that the phase mismatch quantity can be written as
where
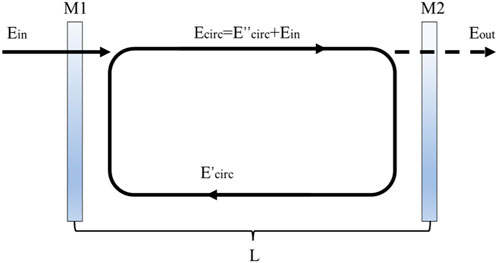
Figure 1 shows the schematic diagram of an optical parametric oscillator. Mirrors M1 and M2 form a resonant cavity, the cavity length is L, and an MgO:PPLN crystal is placed into the cavity. The input electric field strength is Ein. After the beam enters the cavity from the first mirror M1, the electric field strength becomes Ecirc(0). The electric field strength turns to Ecirc(L) after reaching the other side of the cavity and then is divided into transmitted part Eout(L) and reflected part E’circ(L) by the second mirror M2. After the reflected beam returns to M1, the electric field strength is E’circ(2L). The electric field strength is reflected again by M1 and changes to E’’circ(2L). In this way, the beam travels back and forth in the cavity. RM1 and RM2 are the reflectances of M1 and M2, respectively. The following formulas are used to express the coupling effect of the cavity mirror on the pump and parametric waves:
For the signal and idler waves, Ein = 0.
3 Numerical simulation and analysis
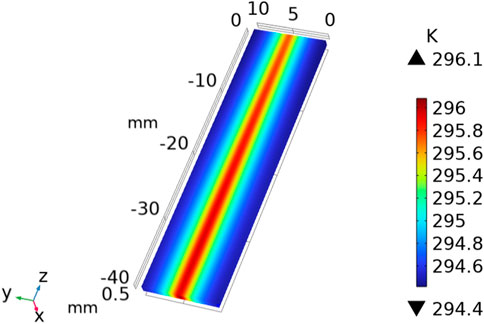
The thermal effects of the MgO:PPLN crystal during operation were investigated in a previous report, and the results of the simulation of the previous study are directly quoted here [20]. As shown in Figure 2, the difference between the center and edge temperatures of the PPLN crystal at a pump power of 8 W is 1.7°C. The crystal temperature rise affects the calculation of nonlinear processes in OPO. Therefore, the OPO model is to be optimized based on the previously established simulation of the thermal effects of the MgO:PPLN crystal.
The thermal effect model was established using finite element analysis. Moreover, the heat generated increases linearly as the pump power increases. In the low pump power range of 0–8 W, every 1 W increase can be approximated to correspond to a 0.21°C increase in crystal temperature. This is brought into the model as the crystal temperature rise coefficient ‘t’ for calculation.
The simulation parameters of OPO are as follows: the wavelength of the pump is 1,064 nm. The repetition rate is 30 kHz. The pulse duration is 50 ns. The cavity length is 70 mm. The effective nonlinear coefficient deff is 27.2 pm/V. The incident beam diameter is 1 mm.
Figure 3 shows the output waveforms of the optical parametric oscillator with an RM2 of 75% at 1,570 nm under different pump powers. When the input pump power is 1.7 W, the pulse energy density is low, and the parameter conversion process has not occurred. When the power is increased to 2.2 W, the pulse energy density reaches the threshold, and the optical parametric conversion process starts. As shown in Figure 3B, the signal and idler waves appear in the later stages of the pump pulse. This is because it takes time to accumulate enough energy to reach the threshold. When input pump power reaches 2.7 W, parameter conversion quickly occurs due to the high pump pulse energy. No inverse conversion phenomenon is observed. The optical-to-optical conversion efficiency reaches its maximum. Continuing to increase the pump power to 3.7 W (Figure 3D), the inverse conversion process occurs in the middle and late stages of the pump pulse, in which signal and idler waves convert to the pump wave. As we know, when OPO starts, the pump energy is dissipated rapidly. As a result, the optical energy density of the pump wave decreases, while the energy density of the signal and idler waves increases. As the OPO process continues to occur, the energy densities of the signal and idler waves exceed the optical energy density of the pump wave. Therefore, the inverse conversion phenomenon starts, in which the power of signal and idler waves decreases and the power of pump waves increases. It is worth noting that the inverse conversion phenomenon is dynamic throughout the nonlinear conversion process. There is an interconversion between the pump wave and the parametric waves. When the pump wave energy is higher than the parametric waves, the energy flows from the pump wave to the parametric waves. However, a small part of the energy flows from the parametric waves to the pump wave. However, because more energy is converted in the forward direction, the inverse conversion phenomenon is not observed. The inverse conversion phenomenon is observed when the parametric wave energy is higher than the pump wave, but the inverse conversion process happens through the whole nonlinear conversion.
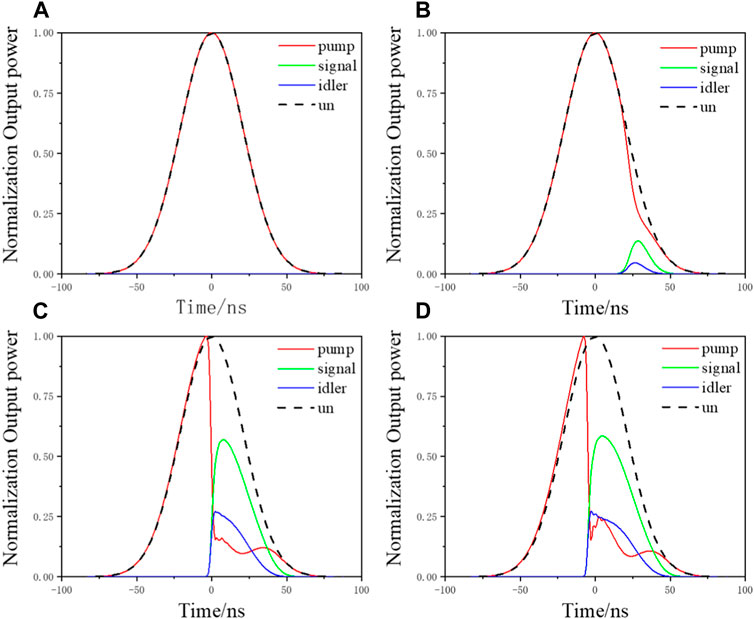
FIGURE 3. Output waveforms of the optical parametric oscillator under different pump powers: (A) 1.7 W, (B) 2.2 W, (C) 2.7 W, and (D) 3.7 W.
In order to study the influence of the reflectivity of M2 on the OPO threshold and the inverse conversion phenomenon, M2 with RM2 of 65%, 75%, 85%, and 95% (at 1,570 nm) are simulated. At RM2 of 65% (Figure 4A), the OPO threshold is 2.7 W and the inverse conversion threshold is 4.2 W. When RM2 increases to 95% (Figure 4D), the OPO occurs earlier, which means that increasing the reflectivity of the output mirror can effectively reduce the threshold of OPO. At the same time, the inverse conversion also happens earlier. When the pump power is 2.2 W, the inverse conversion has already appeared. As the pump power increases, inverse conversion becomes more and more obvious, and more parametric wave power is transferred to the pump wave power. As a result, the optical-to-optical conversion efficiency is rapidly decreased.
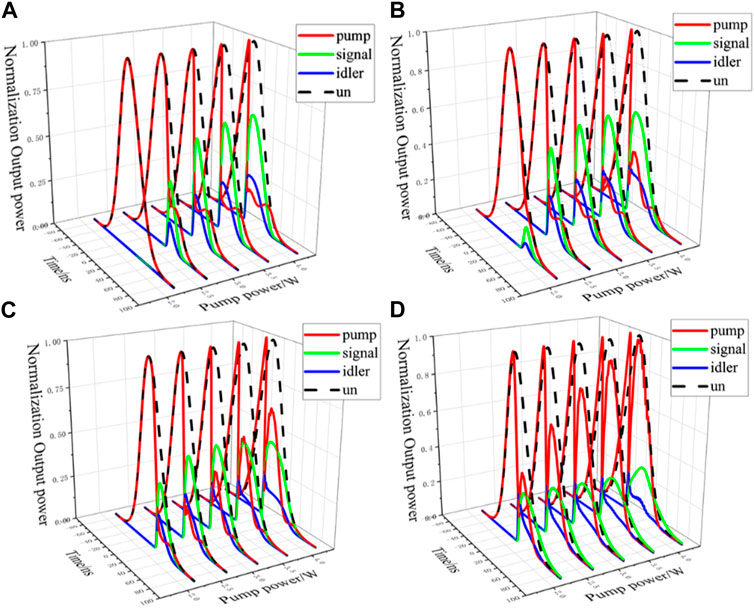
FIGURE 4. Energy distribution of the optical parametric oscillator under different input powers at RM2 of (A) 65%, (B) 75%, (C) 85%, and (D) 95%.
The simulation results show that an output mirror with higher reflectivity is beneficial in reducing the OPO threshold. However, it also increases the risk of the inverse conversion. In order to obtain high optical-to-optical conversion efficiency, it is necessary to perform numerical simulation through this model to optimize the reflectance value of the output mirror and obtain the optimal OPO design.
In order to find the optimal RM2 value of the signal wave band at a pump power of 4 W, the optical-to-optical conversion efficiency is simulated using this model and the model that does not consider crystal thermal effects. As shown in Figure 5, the optical-to-optical conversion efficiency does not simply increase with the increase in RM2. When the pump power is 4 W, the optical-to-optical conversion efficiency of the signal wave reaches the first peak at RM2 of 63% and then the second peak at RM2 of 95%. With low RM2, most of the signal wave exits the cavity from M2, which suppresses the occurrence of the inverse conversion. When RM2 is high, a large amount of the signal wave is accumulated in the resonator, which leads to the inverse conversion and reduces the optical-to-optical conversion efficiency. When the inverse conversion continues to happen, the energy density of the pump wave will be greater than that of the parametric wave, which weakens the inverse conversion phenomenon. Therefore, the optical-to-optical conversion efficiency reaches its second peak. However, the second peak value cannot be larger than the first peak value.
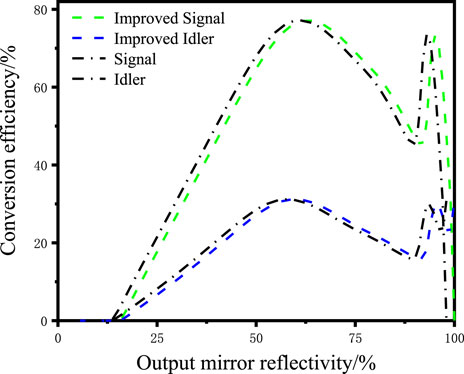
FIGURE 5. Relationship between RM2 of the signal wave band and conversion efficiency at a pump power of 4 W.
In addition, comparing the curves of the two models, it is found that the optimal transmittance of the improved curve is approximately 1% higher than that of the pre-improved curve. This is due to the fact that, considering the crystal thermal effects, the crystal period drift leads to a reduction in gain. Thus, higher output mirror reflectivity is required to achieve high conversion efficiency. This phenomenon becomes more pronounced at high pump power, where the crystal thermal effects intensify.
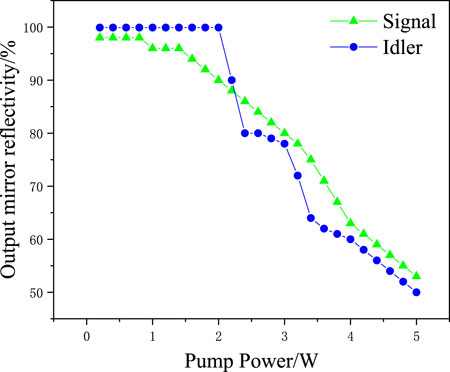
In order to study the optimal reflectivity of the signal wave band on different pump powers, the dependence of the optimal RM2 at 1.57 μm on different pump powers is analyzed, as shown in Figure 6. When the pump power is low, a high RM2 can easily reach the OPO threshold. With the increase in pump power, the optimal RM2 presents a downward trend. This is because a low RM2 can reduce the influence of the inverse conversion under high pump power.
4 Comparison of experimental results and simulation data
Based on the simulation results, external cavity OPO experiments are performed to research the signal wave at the near-infrared 1.57 µm band and the idler wave at the mid-infrared 3.15 µm band. A schematic diagram of the experimental setup is shown in Figure 7. The pump source is a Q-switched Nd:YVO4 laser with an adjustable pulse frequency. A half-wave plate, a polarizer, and an optical isolator are placed on the optical path to protect the pump laser from back reflections. A focus lens F (f = 75 mm) focuses the pump laser into the center of the MgO:PPLN crystal. OPO adopts a plano–plano cavity. A filter is placed outside the cavity. The length of the MgO:PPLN crystal is 40 mm, and the length of the OPO resonant cavity is 70 mm. In the research of the signal wave, a pump source with a repetition rate of 30 kHz is used. In the research of the idler wave, the pump source with a repetition rate of 20 kHz is adopted. The parameters of the laparoscopic film system are as follows: M1 Plano mirror (S1: AR@1064 nm and S2: HT@1064 nm and HR@1570 nm), M2 Plano mirror (HR@1064 nm and R = 75%@ 1570 nm), M3 Plano mirror (HR@1064 nm and R = 90%@ 1570 nm), M4 Plano mirror (HT@1064 nm and HR@1220–1600 nm), and M5 Plano mirror (HT@1064 nm, HR@1250–1530 nm, and HT@3000–8000 nm).
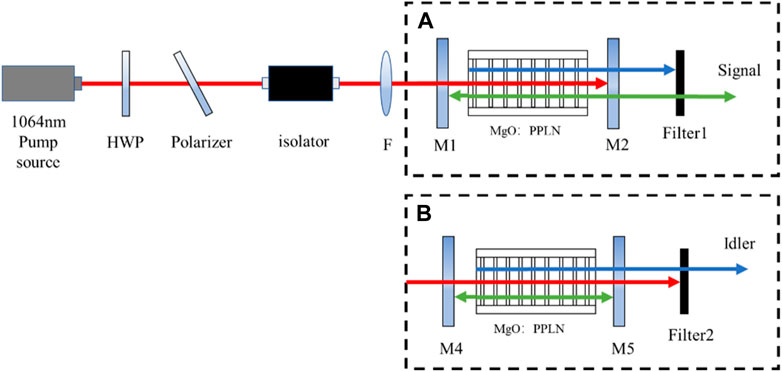
FIGURE 7. Schematic diagram of the experimental light path. HWP, half-wave plate. (A) Signal band, (B) Idler band.
Figure 8 shows the experimental results of the output power and optical-to-optical conversion efficiency under different pump powers. With the pump power increasing, the output power of the signal wave and the optical-to-optical conversion efficiency first increase, then tend to be stable, and finally show a slight decrease. Comparing the output mirror reflectance at 75% and 90%, it can be found that higher output mirror reflectance can lower the threshold value. However, the signal wave output power and the optical-to-optical conversion efficiency do not increase with the increase in output mirror reflectivity. Optimal output mirror reflectivity exists for highest optical-to-optical conversion efficiency and maximum signal wave output power. The conclusions are consistent with the theoretical analysis in the previous section. The output power and conversion efficiency of the idler wave initially increase, stabilize in the middle, then increase again, and finally show a slight downward trend.
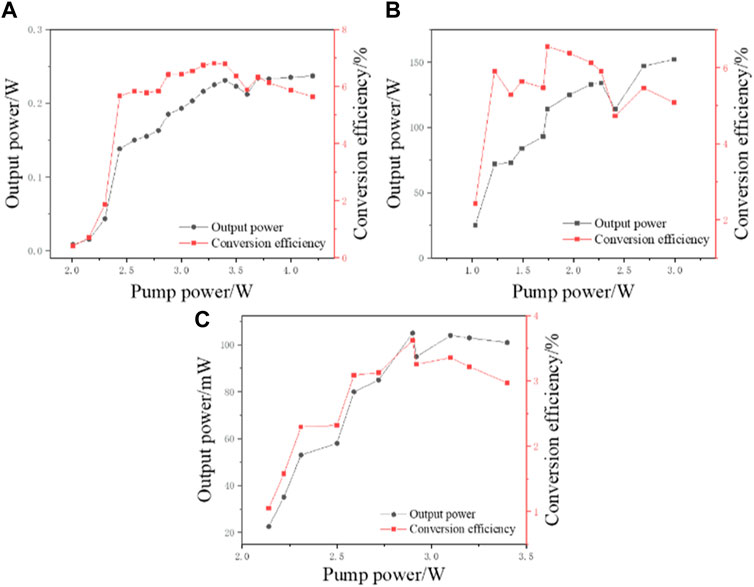
FIGURE 8. Dependence of the output power and conversion efficiency on pump power: (A) R = 75% signal wave band, (B) R = 90% signal wave band, and (C) idler wave band.
As shown in Figure 9, the experimental values are closer to the improved calculated results in both the signal and idler wave bands. Compared with the model that does not consider the crystal thermal effects, the improved model exhibits a higher threshold. This is because the increased crystal temperature changes the refractive index of the crystal. It causes the crystal polarization period to drift, resulting in the optical parametric gain bandwidth broadening phenomenon. This reduces the gain and increases the threshold. The calculation results that consider the crystal thermal effects agree with the trend of the experimental values, which proves that the model can calculate the optical parametric oscillation process more accurately after considering the crystal thermal effects.
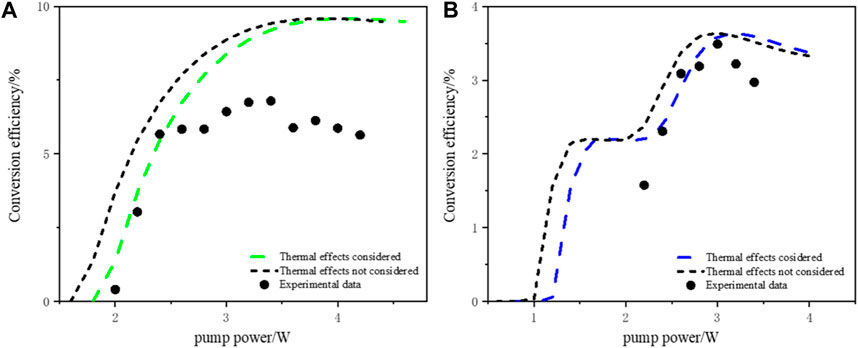
FIGURE 9. Comparison of theoretical results with experimental results: (A) signal wave band and (B) idler wave band.
5 Conclusion
In this paper, a calculation model is proposed for the optical parametric oscillation process considering the crystal thermal effects. The model solves the linear and nonlinear terms of the three-wave coupled equations using the step-by-step integration and Runge–Kutta methods. The energy conversion model of the pump wave and parametric waves is established. The waveforms under different input pump powers are analyzed. The influence of reflectivity of the output mirror on the OPO threshold and inverse conversion is investigated. The simulation results show that the higher the reflectivity of the output mirror, the lower the OPO threshold is, and the earlier the inverse conversion phenomenon occurs. In addition, the optical-to-optical conversion efficiency does not increase linearly with the increase in the reflectivity of the output mirror. The optimal reflectivity at different pump powers is estimated. Experiments are also performed in the near-infrared 1.57 µm band and mid-infrared 3.15 µm band. The corresponding output power is measured under different pump powers using three sets of near-infrared and mid-infrared cavity mirrors. The experimental results are compared with the results of this model and the model that does not consider crystal thermal effects. The experimental results are consistent with the improved theoretical results. It is proved that the model that considers the crystal thermal effects can predict the energy change more accurately in the optical parametric process and provide a theoretical basis for optimizing the parameters of the OPO output mirror and improving the parametric wave conversion efficiency.
Data availability statement
The original contributions presented in the study are included in the article/Supplementary Material; further inquiries can be directed to the corresponding author.
Author contributions
RW: data curation, investigation, methodology, software, validation, and writing–original draft. SW: supervision and writing–review and editing. JT: supervision and writing–review and editing. YL: conceptualization, funding acquisition, methodology, supervision, and writing–review and editing. QD: conceptualization, formal analysis, funding acquisition, methodology, supervision, and writing–review and editing.
Funding
The author(s) declare that financial support was received for the research, authorship, and/or publication of this article. This work was supported by the Basic Scientific Research Projects in Colleges and Universities of Liaoning Provincial Department of Education (LJKZ0262) and Shenyang Ligong University “Guangxuan Team” Program.
Conflict of interest
The authors declare that the research was conducted in the absence of any commercial or financial relationships that could be construed as a potential conflict of interest.
Publisher’s note
All claims expressed in this article are solely those of the authors and do not necessarily represent those of their affiliated organizations, or those of the publisher, the editors, and the reviewers. Any product that may be evaluated in this article, or claim that may be made by its manufacturer, is not guaranteed or endorsed by the publisher.
References
1. Yang Y, Lv G, Guo L, Xu H, Kong H, Wen J, et al. 1.55 μm narrow-linewidth pulsed laser based on MgO:PPLN. Photonics (2023) 10:77. doi:10.3390/photonics10010077
2. Liu H, Yu Y, Liu H, Wang Y, Zheng H, Liu H, et al. 1.5 μm Eye-safe self-optical parametric oscillator with composite resonator based on Nd3+-doped MgO:PPLN. Infrared Phys Tech (2021) 118:103870. doi:10.1016/j.infrared.2021.103870
3. Li X, Huang H, Guo X, Han Y, Guo X, Han Y. Recent progress on mid-infrared pulsed fiber lasers and the applications. Opt Laser Tech (2022) 2023:108898. doi:10.1016/j.optlastec.2022.108898
4. Jian X, Cheng D, Li Y, Cui J, Dai Q. Research on mid-infrared laser at 35 kHz based on optical parametric oscillator. Infrared Laser Eng (2022) 51(9):20210817. doi:10.3788/IRLA20210817
5. Ding X, Shang C, Shen Q, Li B, Fan C, Zhang H, et al. Continuous-wave tunable intra-cavity single resonance optical parametric oscillator under 880 nm in-band pumping and the inverse conversion. Chin J Lasers (2013) 40(6):0602008. doi:10.3788/cjl201340.0602008
6. Liu J, Liu Q, Gong M. Back conversion in optical parametric process. Acta Physica Sinica (2011) 60(2):024215. doi:10.7498/aps.60.024215
7. Zhang X, Wang C, Ye Z, Qi Y, Liu C, Xiang Z, et al. Numerical analysis for single-frequency nanosecond optical parametric oscillators and optical parametric amplifiers. , Optik, Volume (2015) 126(11–12):1128–32. doi:10.1016/j.ijleo.2015.03.010
8. Parsa S, Kumar SC, Nandy B, Ebrahim-Zadeh M. Yb-fiber-pumped, high-beam-quality, idler-resonant mid-infrared picosecond optical parametric oscillator. Opt Express (2019) 27(18):25436. doi:10.1364/OE.27.025436
9. Gou L, Yang Y, Zhao S, Li T, Qiao W, Ma B, et al. Room temperature watt-level 3.87 µm MgO:PPLN optical parametric oscillator under pumping with a Tm:YAP laser. Opt Express (2020) 28(22):32916–24. doi:10.1364/OE.409093
10. Brosnan S, Byer R. Optical parametric oscillator threshold and linewidth studies. IEEE J Quan Elect (1979) 15(6):415–31. doi:10.1109/JQE.1979.1070027
11. Guha S, Wu F, Falk J. The effects of focusing on parametric oscillation. IEEE J QuantumElectronics (1982) 18(5):907–12. doi:10.1109/JQE.1982.1071624
12. Terry JAC, Cui Y, Yang Y, Dunn MH. Low-threshold operation of an all-solid-state KTP optical parametric oscillator. J Opt Soc America B (1994) 11(5):758–69. doi:10.1364/JOSAB.11.000758
13. Smith AV. Bandwidth and group-velocity effects in nanosecond optical parametric amplifiers and oscillators. J Opt Soc Am B (2005) 22:1953–65. doi:10.1364/JOSAB.22.001953
14. Zhang X, Wang C, Ye Z, Qi Y, Liu C, Xiang Z, et al. Effect of idler absorption on efficiency of optical parametric oscillators. OPT REV (2014) 21:505–8. doi:10.1007/s10043-014-0079-9
15. Liu H, Yu Y, Wang Y, Li LJ, Jin GY. Energy conversion of multi-optical parametric oscillation based on time-dependent split-step integration methods in MgO:APLN. Acta Phys Sin (2019) 68(24):244202. doi:10.7498/aps.68.20190843
16. Cai X, Li X, Zhao G. Influence of axial temperature distribution to optical parametric gain in CW-OPO. In: Proceedings of the Applied Optics and Photonics China (AOPC2017); October 2017; Beijing, China (2017).
17. Powers PE, Haus JW. Fundamentals of nonlinear Optics. In: Appendix C. Boca Raton, Florida: CRC Press (2017). doi:10.1201/9781315116433
18. Sabaeian M, Jalil-Abadi FS, Rezaee MM, Motazedian A, Shahzadeh M. Temperature increase effects on a double-pass cavity type II second-harmonic generation: a model for depleted Gaussian continuous waves. Appl Opt (2015) 54:869–75. doi:10.1364/AO.54.000869
Keywords: optical parametric oscillation, three-wave coupled equations, split-step Fourier integration, inverse conversion, crystal thermal effects
Citation: Wang R, Wang S, Tan J, Li Y and Dai Q (2023) Numerical analysis and validation of an optical parametric oscillator considering crystal thermal effects. Front. Phys. 11:1333036. doi: 10.3389/fphy.2023.1333036
Received: 04 November 2023; Accepted: 29 November 2023;
Published: 15 December 2023.
Edited by:
Xinzhong Li, Henan University of Science and Technology, ChinaReviewed by:
Yongjun Liu, Harbin Engineering University, ChinaLi DeSheng, Dalian Polytechnic University, China
Yikun Bu, Xiamen University, China
Copyright © 2023 Wang, Wang, Tan, Li and Dai. This is an open-access article distributed under the terms of the Creative Commons Attribution License (CC BY). The use, distribution or reproduction in other forums is permitted, provided the original author(s) and the copyright owner(s) are credited and that the original publication in this journal is cited, in accordance with accepted academic practice. No use, distribution or reproduction is permitted which does not comply with these terms.
*Correspondence: Qin Dai, ZGFpcWluMjAwM0AxMjYuY29t
 Rui Wang
 Shuilan Wang