- 1School of Information Science and Engineering, Shenyang Ligong University, Shenyang, China
- 2College of Medicine and Biological Information Engineering, Northeastern University, Shenyang, China
- 3Department of Radiology, Shengjing Hospital of China Medical University, Shenyang, China
Background: Developmental dislocation of the hip joint (DDH) is a condition that severely threatens children’s healthy growth. Without timely and correct treatment, it will lead to osteoarthritis and hip dysfunction in the evolution of children.
Objective: It is essential to develop an intelligent model for diagnosing hip dislocation and performing accurate quantitative analysis.
Methods: In this paper, 46 cases of computed tomography (CT) images were retrospectively collected, including 19 cases of hip dislocation and 27 cases of healthy people. The experiment first uses ITK-SNAP to sketch the ilium and femoral head in the original image. Then, it uses 3D U-Net to send the label of the background, ilium, and femoral head into three channels, respectively, to realize the three-dimensional segmentation of the ilium and femoral head. Next, the extraction of the surface of the acetabulum and femoral head is performed. Subsequently, the erroneous points are eliminated, and the spherical surfaces of the acetabulum and femoral head are fitted using the least squares method. Ultimately, the spherical center distance is calculated quantitatively to predict whether the hip joint is dislocated.
Results: Under the independent test set, the segmentation average dice coefficients of the ilium and femoral head are 89% and 93%, respectively. The spherical center distance between the acetabulum and femoral head is calculated quantitatively. If the value exceeds 10 mm, it is considered a hip dislocation. Compared with the doctor’s diagnosis, the accuracy result is 94.4%.
Conclusion: This paper successfully implements a precise and automated intelligent diagnostic system for the identification of hip dislocation. Commencing with the development of a 3D segmentation algorithm for the ilium and femoral head, we further introduce a novel method that computes the spherical distance for the prediction of hip dislocation. This approach provides robust quantitative analysis, thereby facilitating more informed clinical decision-making.
1 Introduction
The developmental dislocation of the hip joint (DDH) is the most common hip condition in pediatric orthopedics [1, 2]. It refers to the position abnormality of the femoral head and acetabulum or the shape abnormality at birth or in the child’s later growth [3, 4]. It is generally divided into three manifestations of dislocation: internal, external, and central [5, 6]. The diagnosis method mainly involves imaging examinations, including X-ray and 3D-computed tomography (CT) [7, 8]. In clinical diagnosis, doctors mostly use subjective judgment and clinical experience to diagnose the lesion severity. Using multiple 2D sectional images in the CT image lacks an objective quantitative basis for a 3D geometric relationship, and the diagnostic accuracy is limited [9, 10]. After the advent of 3D CT reconstruction technology, doctors can more intuitively observe the patient’s hip joint and measure and analyze the data on different planes. Although 3D CT has provided many new ideas and methods for diagnosing and treating DDH, only some studies have focused on 3D quantitative analysis [11–13]. Nonetheless, it is necessary to use quantitative values to reflect the severity of hip dislocation to assist doctors in diagnosis.
There have been few research results in recent years related to hip dislocation. Most studies described hip joint segmentation [14–17]. [15] employed a method that automatically segments the femoral head and acetabular cartilage by marking the region of interest. This method can better extract the desired information. The disadvantage is that the user needs more experience in labeling the region of interest. At the same time, there is no effective treatment method for cases where the hip joint has not yet fully developed. [18] developed an automated method for 3D quantitative evaluation and measurement of the α-angle of the head and neck joint of the femoral head using the bone model from the magnetic resonance image (MRI) of the hip joint.
Recently, radiomics and machine learning have made great progress in the diagnosis of DDH. [19] established a model that can automatically generate parameters of the hip joint based on the radiographic image using the encoder–decoder convolutional neural network and obtained good results. [20] proposed an automatic segmentation algorithm based on edge detection and Hough transform. The results show that the segmentation accuracy of the acetabular angle is good. However, when calculating the central edge angle, segmentation accuracy is low, which may be due to the incomplete development of the femoral head of infants under 6 months, which makes it possible for the automatic algorithm to miscalculate the angle. [21] incorporated clinical knowledge into the random walk formula in the form of intensity prior and proposed a semi-automatic method to segment the acetabular surface model from MRI. This method reduces the impact of signal loss at the boundary by using pixel information from adjacent slices. However, the proposed method does not consider the changes caused by signal nonuniformity and geometric distortion. Moreover, the segmentation technology is semi-automatic, requiring the user to select an initial seed point, which is relatively cumbersome.
This study proposes a 3D self-starting segmentation method of the ilium and femoral head based on CT images. At the same time, it produces a computer-aided diagnosis algorithm to distinguish hip dislocation and calculate the distance the hip joint needs to move for restoration.
2 Materials and methods
2.1 Patients and CT parameters
The research data are provided by the Shengjing Hospital of China Medical University. The CT images used in this experiment have a size of 512 × 512, with a spatial resolution of 0.41–0.74 mm and a layer spacing of 1–1.5 mm, in DICOM format. In total, data on 46 cases, including 19 patients (17 girls and 2 boys) with dislocation of the hip joint (14 patients with unilateral dislocation and 5 patients with bilateral dislocation) were collected from 2013 to 2019. Because the incidence rate of this disease is low, about one thousandth, and most patients have no awareness of being ill, there are limited data for collection, so the period is extensive. Patients are between 13 months and 7 years old (DDH’s regulated range is 0–14 years old), and about 68% of patients are between 15 months and 23 months old. The data on 27 healthy people were collected from 2019 to 2020, all of which were retrospective. Among them, there are 20 women and 7 men. The age range is from 13 to 62 years old. The distribution of each age group is relatively uniform. Because CT radiation significantly impacts infants and young children, data collection on healthy people is not limited to 0–14 years old. Regardless of age, the structure of the hip joint is almost the same, and moreover, the difference in bone size does not affect the training of the deep learning network model. The images in this study are mainly cross-sectional images. Figure 1 shows the images of patients and healthy people. Table 1 provides the clinical characteristics of the data.
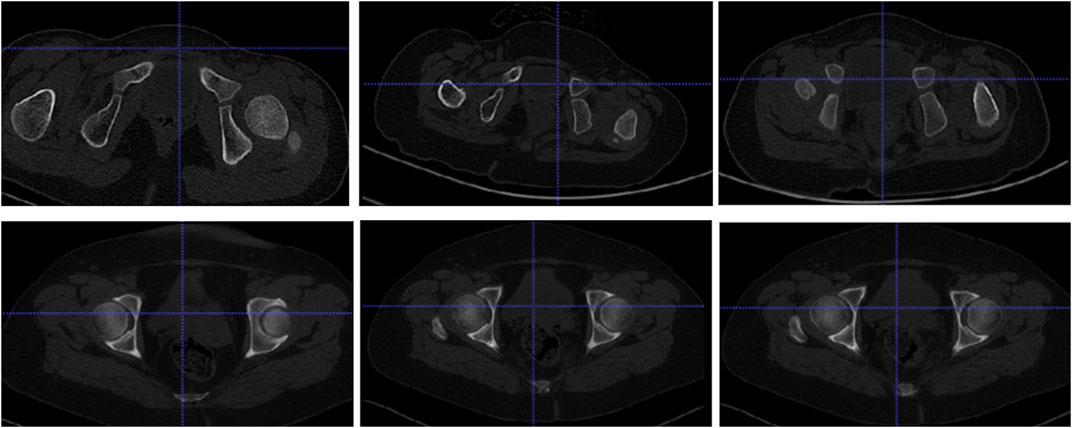
Figure 1. Cross-sectional images: the first row displays the hip joints of some patients, and the second row displays normal persons’ hip joints.
Figure 1 shows that the hip joint appearance of patients is significantly different from that of healthy people. Comparing the shape of the femoral head, healthy individuals have a regular, round shape, while some patients undergo significant changes. The ilium and femoral head of healthy people are closely positioned, with the ilium wrapping around the femoral head. In contrast, in patients, the ilium and femoral head are farther apart.
2.2 Methods
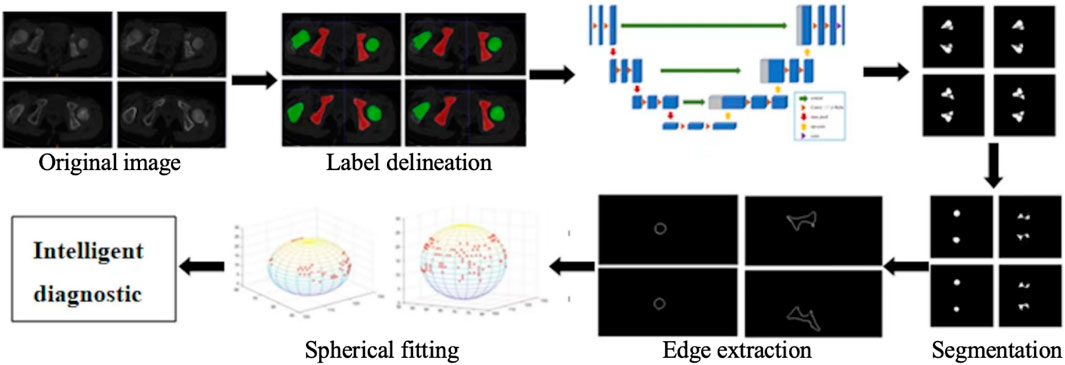
The research content of this paper is mainly divided into two parts. The first part focuses on the realization of 3D automatic segmentation of the ilium and femoral head [22–24], which lays the foundation for the subsequent quantitative analysis of hip dislocation. The second part involves extracting the boundary of the ilium and femoral head using the least squares method to fit the sphere, finding the spherical centers, calculating the distance between these two spherical centers, and quantifying the quantitative degree of hip dislocation. The overall process is shown in Figure 2.
2.2.1 3D segmentation method
2.2.1.1 Label making
In this study, ITK-SNAP is used to produce labels for deep learning segmentation. The specific drawing process of the hip joint label is to mark the femoral head (green) and the ilium (red), as shown in Figure 3. The 3D display of the labeled regions is shown in Figure 4, in which we can more clearly observe whether the marked area is correct. The label production process was conducted under the guidance and confirmation of Professor S. Pan, who has been engaged in clinical work for over 30 years.
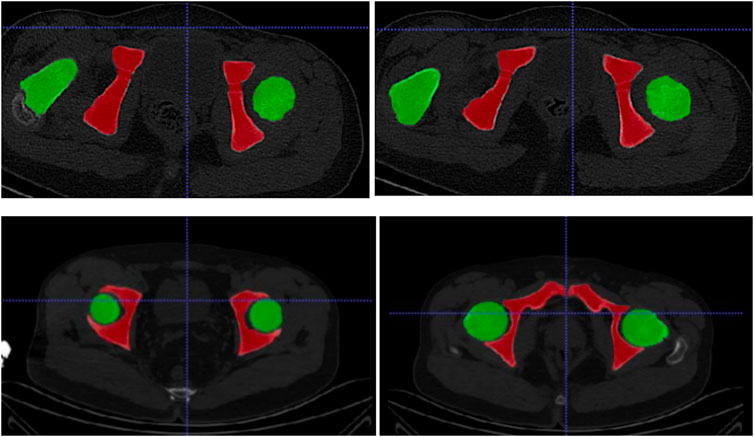
Figure 3. The first row is the annotation of the patient’s hip joint, and the second row is the annotation of the healthy person’s hip joint.
2.2.1.2 Dataset allocation
The image selections containing the regions of interest were used as the input of network training. Preliminarily, we converted the collected 46 groups of DICOM data into PNG format. The images containing the target area were chosen, and those without the target area were eliminated. A total of 282 images were collected. In the experiment, the data were randomly divided into training, verification, and test data sets according to the ratio of 6:2:2 to ensure that all images in each case were collected into the same group. Therefore, 222 images and the corresponding labels were randomly selected from 37 groups, including 177 images for training and 45 images for verification, and 60 images were taken from the remaining 9 groups for testing.
Due to the small amount of data, this experiment utilized a mirror image data augmentation method. Through this approach, 37 groups of training and validation images (177 images and 45 images) were increased to 74 groups of the learning set (354 images and 90 images). The segmentation model was obtained using the three-fold cross-validation method. The background pixels were marked as 0, the ilium pixels were marked as 1, and the femoral head pixels were marked as 2.
2.2.1.3 Segmentation model construction
This paper uses the 3D U-Net image segmentation network [25, 26]. In this experiment, the Keras library with TensorFlow was used as the backend. All calculations were performed on a 64-bit Windows 10 computer with an Intel (R) Core (TM) i7-8700 K CPU (3.70 GHz) processor and an NVIDIA GEFORCE GTX 1080Ti.
This experiment employs the classic 3D U-Net network architecture. The encoding part consists of a downsampling module, which includes two convolutional layers with 3 × 3 × 3 kernels and a stride of 1, followed by a max pooling layer with a 2 × 2 × 2 kernel and a stride of 2. The decoding part is composed of an upsampling convolutional layer (deconvolutional layer), a feature concatenation operation with a 2 × 2 × 2 kernel and a stride of 2, and two convolutional layers with 3 × 3 × 3 kernels and a stride of 1. The ReLU activation function is used throughout the process. In the final layer, a 1 × 1 × 1 convolutional layer reduces the number of output channels to the number of classes to be segmented in the labels.
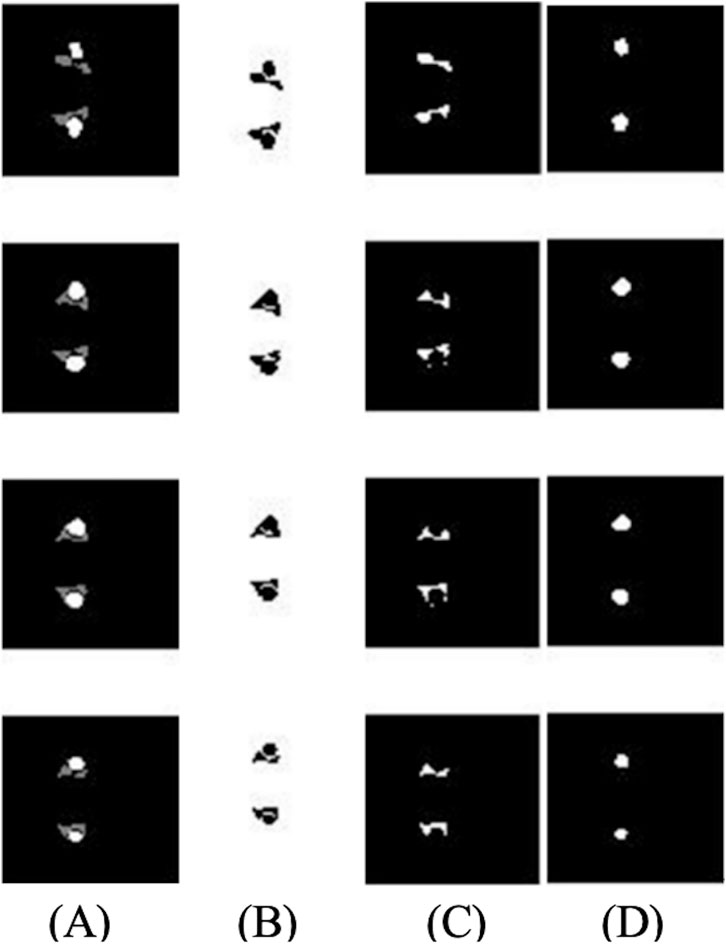
The input data were changed to three-channel type data, with channel 1 as the background, channel 2 as the ilium, and channel 3 as the femoral head, so that different labeling information could be put into training at the same time. In this experiment, one-hot encoding was used for image three-channel processing [27]. Figure 5 shows the tag images of the background, ilium, and femoral head in the second to fourth columns sent into the three-channel network.
2.2.2 Quantitative analysis of hip dislocation
The segmented images of the ilium and femoral head are used for quantitatively calculating hip dislocation. This method can provide accurate 3D spatial information to assist doctors in diagnosis.
2.2.2.1 Spherical center calculation
First, the Sobel operator is used to extract the edge of the femoral head and acetabulum [28]. Then, the data containing the boundary information on the femoral head can be extracted to form a spatial coordinate sampling point set. However, the meniscus of the acetabulum is incomplete, and there are depressions or protrusions. Therefore, the equidistant grid sampling method [29, 30] is selected to sample the spatial information on the acetabulum. The intersection of the equidistant grid lines and the target contour is the sampling point. Then, the least squares method is used to fit the sphere. In this process, the erroneous points need to be eliminated as follows:
Step 1: The previously extracted femoral head and hip joint data are processed, and the results obtained by fitting the data points with the once-received spherical surface are substituted into Formula 1. The femoral head and acetabular data are input separately, and the fitting residual
Step 2: The Bessel formula is used to calculate the standard deviation valuation:
Step 3: The Laiyite criterion is used to eliminate erroneous points: when
Step 4: The sampling point set is updated, the previously calculated culling points are deleted, steps 1 to 3 are repeated, and the process is stopped when the new spatial sampling point set does not contain gross error points.
2.2.2.2 DDH measurement
The coordinates and radius of the left and right spherical centers of the femoral head and acetabulum can be calculated using the above spherical fitting method to calculate the distance between the left and right spherical centers. After statistical analysis of all distance values, the optimal threshold was selected as the critical value of hip dislocation and compared with the diagnosis of doctors to evaluate the effectiveness of this method.
3 Results
3.1 3D segmentation of the ilium and femoral head
This experiment introduces three-fold cross-validation in the training set, and the initial learning rate is [1 × 10]^(-3). During training, the learning rate will automatically decline. Affected by GPU memory, the batch size is 2, and the number of training epochs is 200. The loss function curve is shown in Figure 6. The abscissa in the figure represents the number of iterations, and the ordinate represents the value of the loss, IoU (intersection and combination ratio), loss_val, and IoU_val. Loss and IoU are calculated in the network’s training process, indicating the network’s fitting degree on the training set. Loss_val and IoU_val are the evaluation indicators of the verification set after each round of network training, which shows the degree of network fitting in the test set. In Figures 6A–C, the second fold is the best, so it is selected for training again. Figure 6D shows the final index change chart of the training network model.
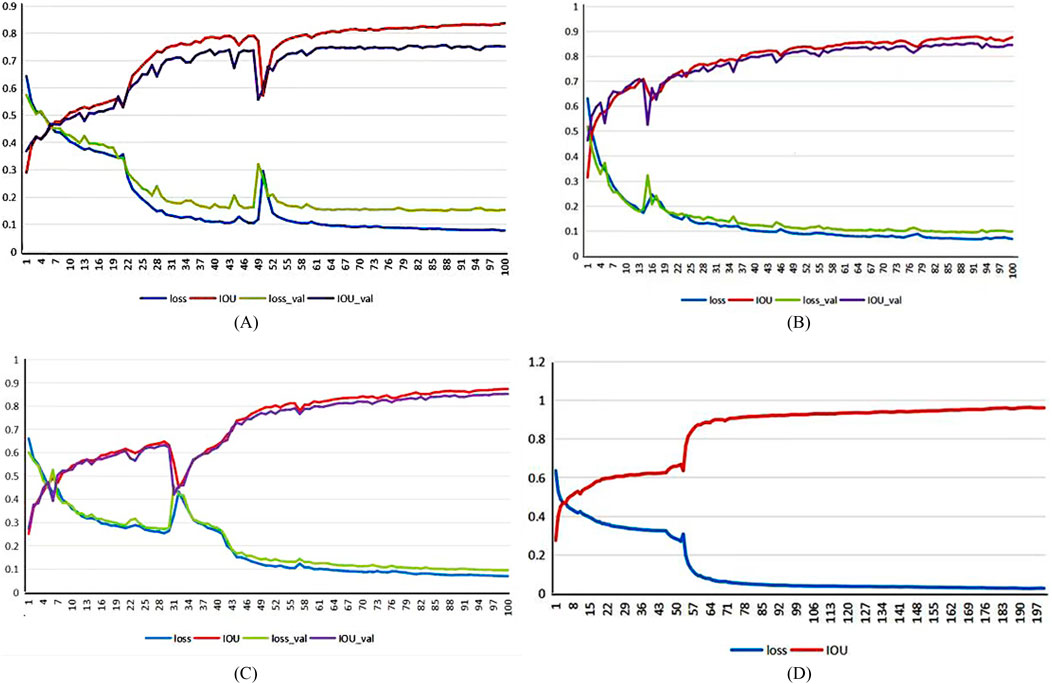
Figure 6. Network model training indicators:(A) first-fold,(B) second-fold, (C) third-fold, and (D) final network model.
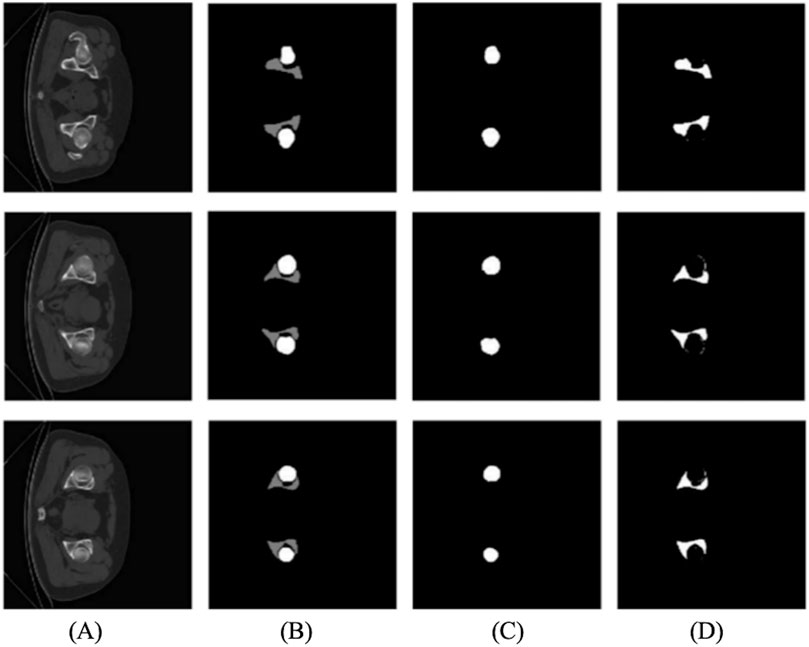
The loss value of the training and verification sets gradually flattens after a rapid decline shown in Figure 6D and finally converges to 0.0263. The change in the intersection ratio of the training set joins at 0.9626, which is opposite to the loss function. The results are shown in Figure 7.
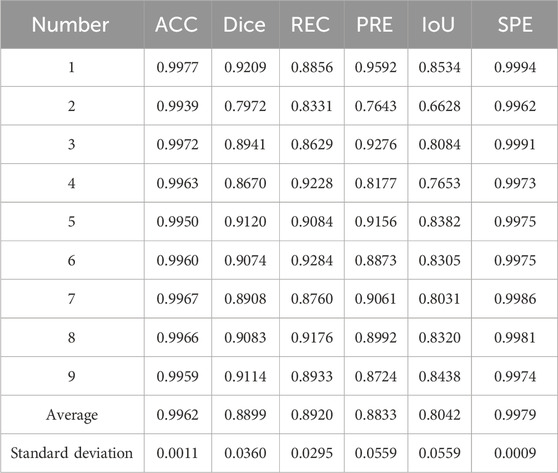
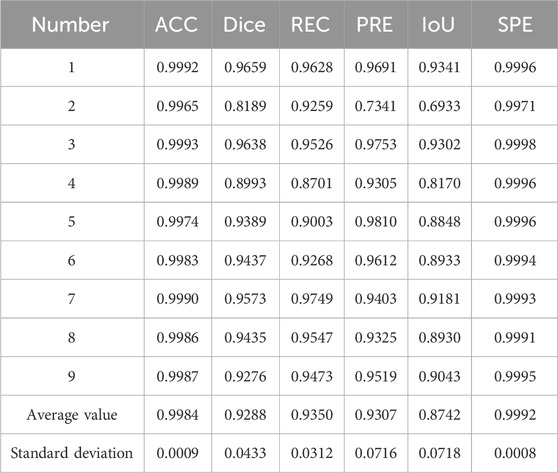
In the experiment, the accuracy (ACC), dice coefficient, IoU, precision (PRE), and specificity (SPE) of nine independent test sets were calculated as evaluation parameters. Table 2 provides the evaluation of the segmentation results of the ilium, and Table 3 provides the evaluation of the segmentation results of the femoral head.
The result of multi-class hip joint segmentation using the 3D U-Net is good, and the average dice coefficient of the ilium reaches 88.99%. Although the ilium contour is over-segmented, it is due to the low definition of the edge. The average dice coefficient of the femoral head segmentation result reaches 92.88%, which indicates that this method is quite good.
3.2 DDH intelligent diagnosis
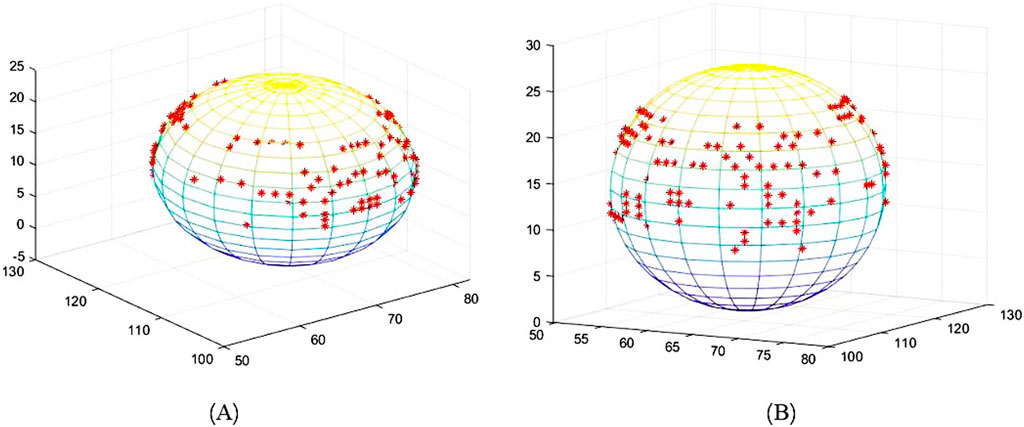
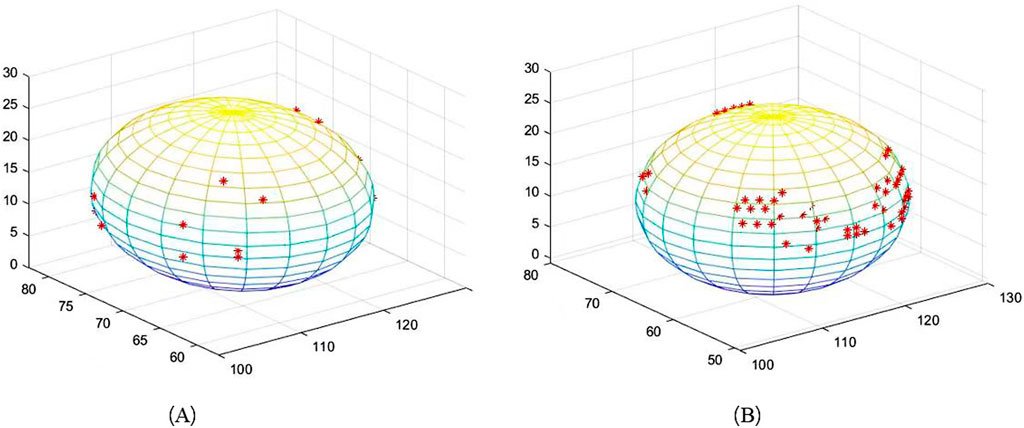
The edge extraction and data point extraction results are shown in Figures 8–10. Figure 8 shows the edge extraction results of the femoral head and ilium, Figure 9 shows the femoral head point extraction results, and Figure 10 shows the acetabular point extraction results.
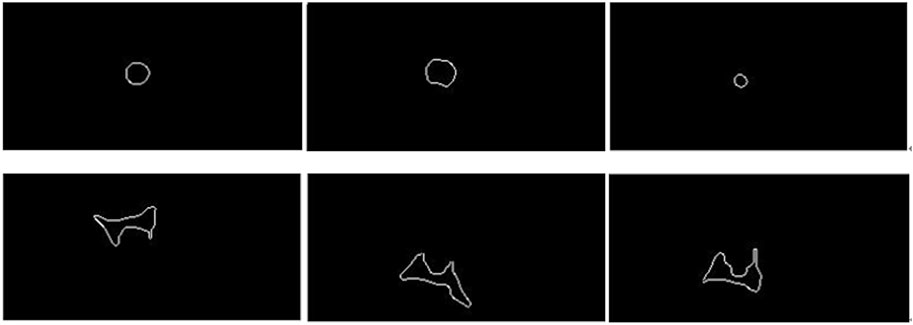
Figure 8. The first line shows the extraction results of the femoral head edge, and the second line shows the extraction results of the iliac edge.
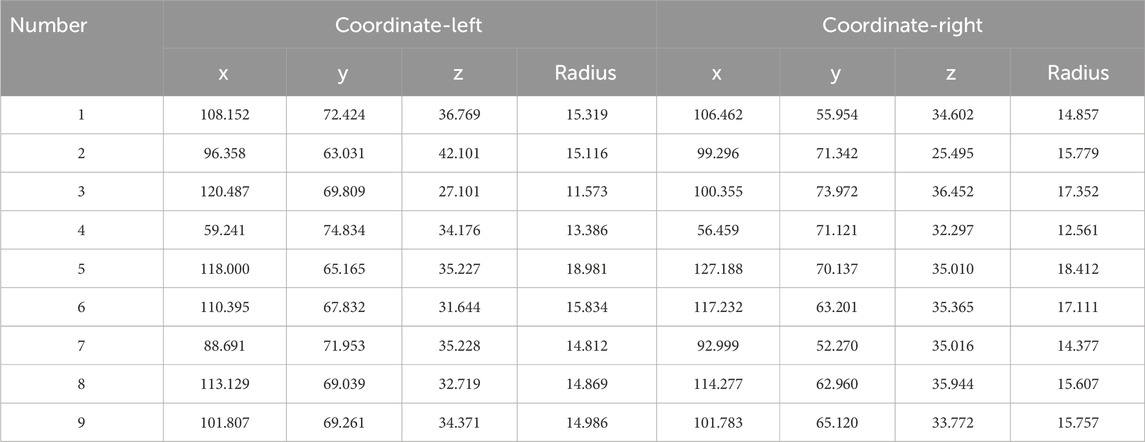
The results of spherical fitting are shown in Figures 11, 12. They are the fitting results of the femoral head and acetabulum, respectively, (a) left side and (b) right side. The calculated spherical center results are shown in the table. Tables 4, 5 are the spherical center and radius calculation results of the femoral head and acetabulum, respectively.
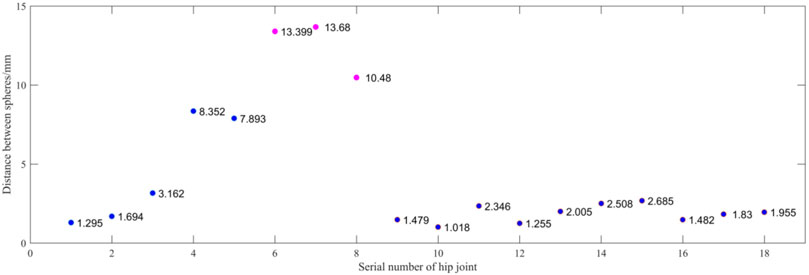
Figure 13 shows the spherical center distance between the femoral head and the acetabulum’s meniscus. The abscissa is the serial number of the hip joint. A case is sorted by dividing it into two hip joints. The ordinate is the distance between the spherical centers in millimeters. Blue represents the normal hip joint, and orange represents the hip dislocation. A hip joint less than 10 mm is considered normal, while a hip joint greater than 10 mm is considered hip dislocation. Compared to the doctor’s diagnosis, only the No.8 hip joint differed from the doctor’s assessment. Because the patient is younger, the shape of the femoral head is not fully grown, and there is a difference in the shape of the sphere. The accuracy rate is 94.4%.
4 Discussion
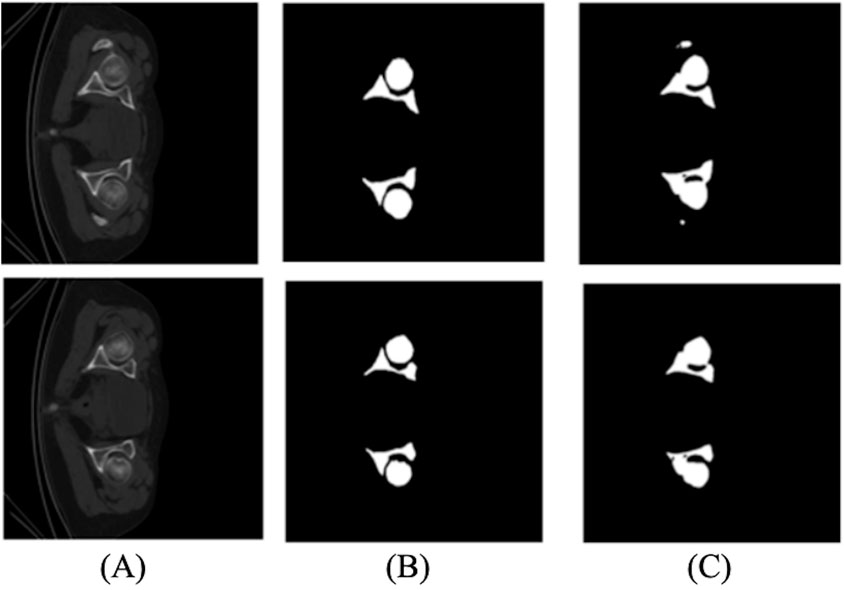
We compared the 2D and 3D U-Net segmentation results. The 2D segmentation results are shown in Figure 14. The average value of the dice coefficient reaches 87.9%. There is an over-segmentation phenomenon because of the low definition. In addition, 2D data do not have layer position information, and the structure is different, significantly impacting the training. The edge information on the femoral head and ilium cannot be well-extracted, which cannot meet the needs of subsequent experiments.
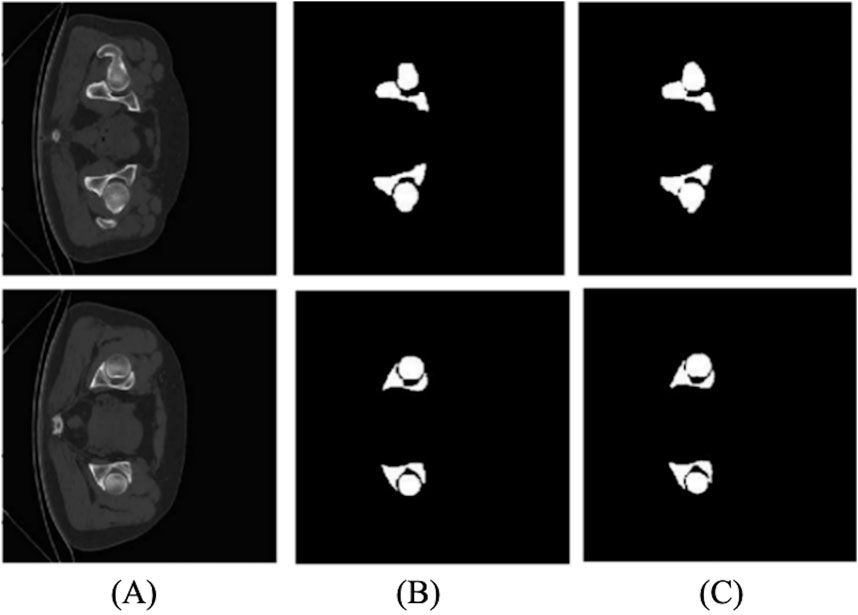
Unlike 2D U-Net, 3D U-Net has better results in segmentation and can better learn and train 3D information to obtain a better model. Figure 15 shows the result of the 3D segmentation of the hip joint. There is almost no difference compared to the marked image, and the accuracy is high. However, some images are not segmented accurately at the narrow gap between the ilium and femoral head, resulting in over-segmentation.
Comparing the evaluation parameters of 2D and 3D segmentation in Table 6, the average dice coefficient of 3D U-Net reached 87.9%. However, the narrow gap between the femoral head and the ilium caused over-segmentation. Marking labels separately in the experiment solved the problem. Tables 2 and 3 provide the evaluation results.
Regarding time efficiency, the 2D segmentation method took 2 h to complete the network training process, and it took less than 20 s to segment approximately 60−ΔΔCT slices. The 3D segmentation method took 10 h to complete the training process of the network. It took less than 30 s to segment approximately 300−ΔΔCT slices.
Due to the low incidence of hip dislocation in children, our study was based on only 46 cases. Despite the limited data, the research outcomes are promising. In subsequent studies, we aim to continue collecting more data to improve the robustness of our method.
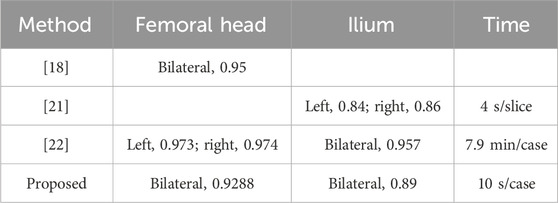
Table 7 presents a comparison of our paper’s results with those from other studies. When compared to the results of Xia et al., who utilized an active shape model-based algorithm for automated 3D bone reconstructions of the proximal femur, the femoral head segmentation in our paper is slightly inferior. However, our method performs better when only healthy individuals are considered. In contrast to Hareendranathan et al., who integrated clinical knowledge through intensity priors into a random Walker formulation, our method outperforms theirs in ilium segmentation. In comparison to the methods of Chu et al., which combine fast random forest regression-based landmark detection, multi-atlas-based segmentation, and articulated statistical shape model-based fitting, our study extends the scope to include both normal and dislocated hip joints. For normal individuals, our paper achieves a segmentation accuracy of 95%. Additionally, our method’s execution time is significantly longer than theirs.
5 Conclusion
This paper presents the quantitative and intelligent diagnosis of hip dislocation based on CT images. First, a 3D automatic segmentation method of the ilium and femoral head is proposed. Then, the boundary information is extracted from the segmentation results, and spherical fitting is performed. Finally, the distance between the two spherical centers is calculated and a quantitative intelligent diagnosis model is obtained.
In terms of treatment, for most infants under 6 months with DDH, after diagnosis, good treatment outcomes can be achieved through external hip abduction devices such as Pavlik harnesses and Von Rosen splints. For children who fail to respond to Pavlik treatment, treatment options include closed reduction or open reduction. The experimental results show that the method proposed in this study has good performance on independent testing sets, which can provide quantitative analysis support for clinical decision-making.
Data availability statement
The datasets presented in this article are not readily available because data usage must be restricted to researchers in the relevant field, and communication with the corresponding authors via email is required. Requests to access the datasets should be directed to Shinong Pan, Y2pyLnBhbnNoaW5vbmdAdmlwLjE2My5jb20=; Hang Sun, c3VuaGFuZzg0QDEyNi5jb20=.
Ethics statement
The studies involving humans were approved by the Ethics Committee of Shengjing Hospital of China Medical University. The studies were conducted in accordance with the local legislation and institutional requirements. The participants provided their written informed consent to participate in this study.
Author contributions
HS: conceptualization, data curation, formal analysis, funding acquisition, investigation, methodology, supervision, and writing–review and editing. HL: conceptualization, investigation, supervision, validation, and writing–original draft. YZ: data curation, investigation, methodology, software, validation, visualization, and writing–original draft. SP: conceptualization, data curation, supervision, validation, and writing–review and editing.
Funding
The author(s) declare that financial support was received for the research, authorship, and/or publication of this article. This study was supported in part by the Natural Science Foundation of Liaoning Provincial Department of Science, Technology—Doctoral Initiation Fund (No. 2022-BS-074) and Shenyang Ligong University High-Level Talent Scientific Research Support Fund Initiative (No. 1010147001251), the Special Fund for Basic Scientific Research Operations of Undergraduate Colleges and Universities in Liaoning Province (No. 1030055000854) and the Basic Scientific Research Project, Department of Education of Liaoning province (No. LJKMZ20221163).
Conflict of interest
The authors declare that the research was conducted in the absence of any commercial or financial relationships that could be construed as a potential conflict of interest.
Publisher’s note
All claims expressed in this article are solely those of the authors and do not necessarily represent those of their affiliated organizations, or those of the publisher, the editors, and the reviewers. Any product that may be evaluated in this article, or claim that may be made by its manufacturer, is not guaranteed or endorsed by the publisher.
Abbreviations
DDH, developmental dislocation of the hip joint; CT, computed tomography; MRI, magnetic resonance image; ACC, accuracy; IoU, intersection and combination ratio; PRE, precision; SPE, specificity.
References
1. BrdarR PI, Abramovic D, Nikolic D, Lukac M, Cirovic D. Double innominate osteotomy and the Smith-Petersen technique in the treatment of developmental hip disorder. Acta ChirurgicaBelgica (2011) 111(1):18–22. doi:10.1080/00015458.2011.11680697
2. Karout L, Naffaa L. Pediatric hip disorders imaging guidelines and recommendations. Radiologic Clin North America (2021) 60(1):149–163. doi:10.1016/j.rcl.2021.08.007
3. OmerogluH TY, Bicimoglu A, Agus H. Intraobserver and interobserver reliability of Kalamchi and Macewen's classification system for evaluation of avascular necrosis of the femoral head in developmental hip dysplasia. Bull (Hospital Joint Dis (New York, N.Y.)) (1999) 58(4):194–196. doi:10.1097/00006534-199909000-00002
4. Güney B, Etinolu YK, Akay G, Yenieri B, Ullu N. Standardization and optimization of ultrasonographic graf method used in diagnosis of developmental hip dysplasia. Health Care Academician J (2018) 5(4):264–268. doi:10.5455/sad.13-1527697236
5. Biçimoğlu A, Ömeroğlu H, Tabak AY, Uçaner A, Günel U. Evaluation and compensation of lower limb length discrepancy after surgical treatment of developmental hip dysplasia. Eur J Orthopaedic Surg and Traumatol (1998) 8(4):175–8. doi:10.1007/bf01681655
6. Sun XT, Sun S, Zhang W, Li B, Hua HZ, Man ZT. Primary total hip arthroplasty using the modular S-ROM prosthesis for the treatment of severe developmental dysplasia of the hip. Orthop J China (2010) 18(6):448–451. doi:10.2106/00004623-199912000-00008
7. Lotito FM, Rabbaglietti G, Notarantonio M. The ultrasonographic image of the infant hip affected by developmental dysplasia with a positive Ortolani\s sign. Pediatr Radiol (2002) 32(6):418–422. doi:10.1007/s00247-001-0621-3
8. Watanabe T, Suzuki R, Iwasaki K, Ide S, Matsumoto M. On the diagnosis and treatment of congenital dislocation of the hip joint in the newborn. Orthopedics and Traumatol (2010) 22(1):59–62. doi:10.5035/nishiseisai.22.59
9. Vencálková S, Janata J. Evaluation of screening for developmental dysplasia of the hip in the Liberec region in 1984-2005. Acta ChirurgiaeOrthopaedicae Et TraumatologiaeCechoslovaca (2009) 76(3):218–24. doi:10.55095/achot2009/040
10. Stevenson DA, Mineau G, Kerber RA, Viskochil DH, Schaefer C, Roach JW. Familial predisposition to developmental dysplasia of the hip. J Pediatr Orthopaedics (2009) 29(5):463–6. doi:10.1097/bpo.0b013e3181aa586b
11. Lipton GE, Guille TJ, Altiok H, Bowen JR, Harcke , Theodore HH. A reappraisal of the Ortolani examination in children with developmental dysplasia of the hip. J Pediatr Orthopaedics (2007) 27(1):27–31. doi:10.1097/bpo.0b013e31802b70e5
12. Swaroop VT, Mubarak SJ. Difficult-to-Treat ortolani-positive hip: improved success with new treatment protocol. J Pediatr Orthopaedics (2009) 29(3):224–30. doi:10.1097/bpo.0b013e31819bcecf
13. Al-Bashir AK, Al-Abed M, Sharkh FMA, Kordeya MN, Rousan FM. Algorithm for automatic angles measurement and screening for Developmental Dysplasia of the Hip (DDH)[C]. In: 2015 37th annual international conference of the IEEE engineering in medicine and biology society (EMBC), Milan, Italy. IEEE (2015). p. 08. doi:10.1109/EMBC.2015.7319854
14. Chen HY, Liu X, Lu HB, Wang SY, Dong XZ. Application of segmentation and measurement in the treatment of developmental dysplasia of the hip[C]. In: 2007 1st international conference on bioinformatics and biomedical engineering (2007), Wuhan, China. p. 989–991. doi:10.1109/ICBBE.2007.256
15. Baniasadipour A, Zoroofi RA, Sato Y, Nishii T, Tamura S. A fully automated method for segmentation and thickness map estimation of femoral and acetabular cartilages in 3D CT images of the hip[C]. Image Signal Process. Anal (2007) 92–97. doi:10.1109/ISPA.2007.4383670
16. Kainmueller D, Lamecker H, Zachow S, Hege HC. An articulated statistical shape model for accurate hip joint segmentation[C]. In: International conference of the IEEE engineering in medicine and biology society, Minneapolis, MN, United States. IEEE (2009). p. 6345–51. doi:10.1109/IEMBS.2009.5333269
17. ChuCW BJJ, Wu XD, Zheng GY. MASCG: multi-Atlas Segmentation Constrained Graph method for accurate segmentation of hip CT images. Med Image Anal (2015) 26(1):173–184. doi:10.1016/j.media.2015.08.011
18. Ying X, Fripp J, Chandra SS, Walker D, Crozier S, Craig E. Automated 3D quantitative assessment and measurement of alpha angles from the femoral head-neck junction using MR imaging. Phys Med and Biol (2015) 60(19):7601–16. doi:10.1088/0031-9155/60/19/7601
19. Yang W, Ye Q, Ming S, Hu X, Jiang Z, Shen Q, et al. Feasibility of automatic measurements of hip joints based on pelvic radiography and a deep learning algorithm. Eur J Radiol (2020) 132:109303. doi:10.1016/j.ejrad.2020.109303
20. Al-Bashir AK, Al-Abed M, Abu Sharkh FM, KordeyaMN RFM. Algorithm for automatic angles measurement and screening for Developmental Dysplasia of the Hip (DDH)[B]. In: IEEE engineering in medicine and biology society conference proceedings (2015). p. 6386–6389.
21. Hareendranathan AR, Zonoobi D, Mabee M, Diederichs C, Punithakumar K, Noga M, et al. Hip segmentation from MRI volumes in infants for DDH diagnosis and treatment planning[B]. IEEE Eng Med Biol Soc Conf Proc (2016) 1046–1049. doi:10.1109/EMBC.2016.7590882
22. Chu C, Chen C, Liu L, Zheng G. FACTS: fully automatic CT segmentation of a hip joint. Ann Biomed Eng (2015) 43(5):1247–59. doi:10.1007/s10439-014-1176-4
23. MorarA MF, Groller E. Image segmentation based on active contours without edges[C]. In: IEEE international conference on intelligent computer communication and processing, Cluj-Napoca, Romania. IEEE (2012). doi:10.1109/ICCP.2012.6356188
24. Alathari TS, Nixon MS, Bah MT. Femur bone segmentation using a pressure analogy[C]. In: Pattern recognition (ICPR), 2014 22nd international conference on, Stockholm, Sweden. IEEE (2014). doi:10.1109/ICPR.2014.177
25. Ronneberger O, Fischer P, Brox T. U-net: convolutional networks for biomedical image segmentation. In: International Conference on Medical image computing and computer-assisted intervention. Cham: Springer (2015). p. 234–241.
26. Liang K, Fu H, Zhou H, Jiang L, Yin X, Zhang M, et al. Accurate and automatic 3D segmentation of femur and pelvis from CT images of the hip based on deep learning. J Imaging Sci Technology (2021) 65(3):1–6. doi:10.2352/j.imagingsci.technol.2021.65.3.030411
27. Karthiga R, Usha G, Raju N, Narasimhan K. Transfer learning based breast cancer classification using one-hot encoding technique[C]. In: 2021 international conference on artificial intelligence and smart systems (ICAIS) (2021). p. 115–120. doi:10.1109/ICAIS50930.2021.9395930
28. Raas A, Sg A. Comparative analysis of eight direction Sobel edge detection algorithm for brain tumor MRI images. Proced Computer Sci (2022) 201:487–494. doi:10.1016/j.procs.2022.03.063
29. SzalayV SSC. Application of contracted distributed approximating functions to solving vibrational eigenvalue problems. J Chem Phys (1999) 110(1):72–9. doi:10.1063/1.478086
Keywords: computed tomography image, hip dislocation, intelligent diagnostic, 3D femoral head segmentation, 3D iliac segmentation
Citation: Sun H, Li H, Zhao Y and Pan S (2024) Intelligent diagnostic method for developmental hip dislocation. Front. Phys. 12:1358652. doi: 10.3389/fphy.2024.1358652
Received: 20 December 2023; Accepted: 26 August 2024;
Published: 18 September 2024.
Edited by:
Udo Jochen Birk, University of Applied Sciences Graubünden, SwitzerlandReviewed by:
Giorgio De Nunzio, University of Salento, ItalyGeorgia Damoraki, National and Kapodistrian University of Athens, Greece
Houping Chen, Guiyang children’s Hospital, China
Copyright © 2024 Sun, Li, Zhao and Pan. This is an open-access article distributed under the terms of the Creative Commons Attribution License (CC BY). The use, distribution or reproduction in other forums is permitted, provided the original author(s) and the copyright owner(s) are credited and that the original publication in this journal is cited, in accordance with accepted academic practice. No use, distribution or reproduction is permitted which does not comply with these terms.
*Correspondence: Hang Sun, c3VuaGFuZzg0QDEyNi5jb20=; Hong Li, bGlob25nQGJtaWUubmV1LmVkdS5jbg==; Shinong Pan, Y2pyLnBhbnNoaW5vbmdAdmlwLjE2My5jb20=
 Hang Sun
 Hong Li
 Yuhang Zhao2
 Shinong Pan
