 Zun Xie
 Xianwen Luo*
- Key Laboratory of Low-Dimensional Structural Physics and Application, College of Physics and Electronic Information Engineering, Guilin University of Technology, Guilin, China
In this study, we investigate the energy loss of highly charged ions interacting with various tungsten surfaces. The analysis primarily focuses on elucidating the impact of electron density distributions on energy loss of ions. Furthermore, we explore the correlation between surface azimuthal angles and energy loss under both uniform and inhomogeneous electron density distributions. Utilizing the classical over-the-barrier model (COBM), simulations involving trajectory calculations, energy loss, charge-exchange processes, and surface electron distributions, etc., were performed. Remarkably, the significant influence of axial channeling of surfaces on ion energy loss is observed. For the comparison of ion energy loss under uniform and inhomogeneous electron density distributions, the results reveal a more pronounced effect of electron density inhomogeneity on ion energy loss at higher energy-loss values. Additionally, the calculated energy-loss spectra of Ar16+ ions grazing on graphite surfaces show reasonable agreement with experimental data. These findings are crucial for understanding the surface structure of crystals.
1 Introduction
The study of slow, highly charged ions (HCIs) interacting with a crystal surface plays a pivotal role in understanding the dynamic processes occurring at the nanoscale [1]; [2]. Among the various ion–surface interactions, the grazing incidence of ions on solid surfaces has garnered significant attention due to its relevance in surface modification, ion implantation, and nanofabrication processes [3]; [4]. In particular, HCIs interacting with a metallic surface have offered unique insights into the intricacies of energy transfer and charge exchange at the atom scale [5]; [6]; [7]; [8].
The energy loss that HCIs experienced can be separated into two components: (i) nuclear energy loss (NEL), with a transfer of energy from projectiles to the target atom, and (ii) electron energy loss (EEL), which comprises charge-exchange energy loss and large- and short-distance electron energy loss [9]. For the grazing scattering conditions of experiments, the elastic energy loss of ions is very small, so nuclear stopping processes can be neglected.
Recent research has focused on the dependence of electron density (ne) and stopping power (Se) on the EEL of ions [10]; [11]; [12]. L. Guillemot et al. investigated the energy losses of hydrogen and fluorine ions scattered under grazing incidence on an Ag (110) surface. An average electron density was assumed at a given distance from the surface, which resulted in a narrower width of energy-loss spectra than that in the experimental results. To clarify their experimental results more accurately, J.E.Valdés et al. performed density calculations using the ab initio linear muffin-tin orbital (LMTO) method [13]; [14]. However, the use of the LMTO method is limited to targets consisting of a large number of atoms. It is critical to realistically describe the inhomogeneity of the spatial electron density for accurately calculating the energy loss of ions interacting with crystal materials. In this work, therefore, the calculation of the spatial inhomogeneous electron density distribution on a tungsten surface was performed using the Vienna Ab initio Simulation Package (VASP) [15].
The classical over-the-barrier model (COBM) was adopted to describe the charge-exchange processes [16]. Moreover, three tungsten surfaces with different work functions were used as targets in this work, which significantly impacts the charge-exchange energy loss.
The Monte Carlo (MC) simulation method was used to investigate the energy loss of Ar17+ ions grazing on three tungsten (W) surfaces under “planar channeling” and “axial channeling,” taking into account the uniformity and inhomogeneity of the electron density distribution. The selection of tungsten as a prototypical metallic material capable of withstanding high heat loads and exhibiting low tritium retention is of great significance in thermonuclear reactors [17]. The study mainly focuses on the energy loss experienced by Ar17+ ions and influenced by the variations in electron density distributions on tungsten surfaces. Exploring the correlation between the surface azimuthal angle and ion energy loss, this study provides insights into how surface structure features manifest in the energy loss spectra. Atomic units are used throughout this paper unless otherwise stated.
2 Modeling
2.1 Interaction process
The sketch of the Arq+ ion grazing scattering from the tungsten (W) surface is shown in Figure 1. Based on the COBM [16]; [18], resonant capture (RC), resonant loss (RL), autoionization (AI), peeling off (PO), and side feeding (SF) are adopted to describe the neutralization of Arq+ ions, resulting in the corresponding charge-exchange energy loss. As the Arq+ ion approaches the tungsten surface, it induces the dielectric response phenomenon, creating an “image charge” that accelerates the HCI. When the Arq+ ion reaches a critical distance Rc, the electrons from the solid surface can be captured into the high-lying shells of the Arq+ ion in a very short time, leaving the low shells empty. As a result, the hollow atom (HA) is formed. Then, the HA decays to its ground state via Auger transition and X-ray emission [19]; [20]; [21]; [22]. Rc is given by the following equation:
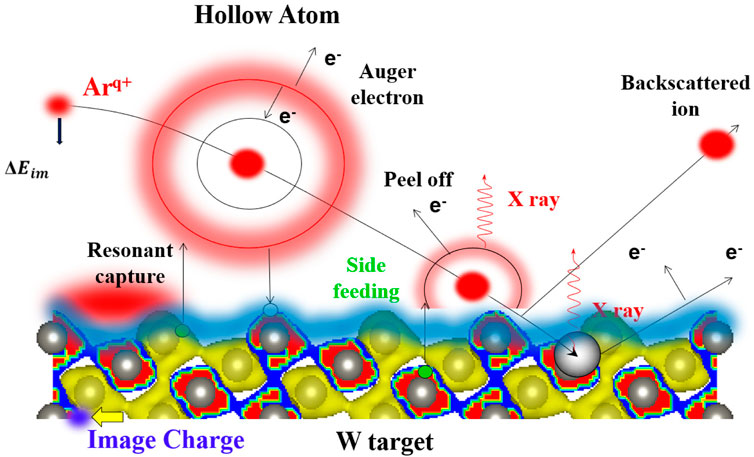
Figure 1. Sketch of the Arq+ ion grazing scattering from the tungsten surface.
where W is the work function of the metallic surface and q1 is the initial charged state of projectiles. This critical distance marks the beginning of neutralization and the production of the HA. The work function of the metallic surface plays a vital role in the ion–target interaction process, as indicated by Eq. 1. In this study, the energy losses of ions interacting with three tungsten surfaces are compared. The work functions of W (111), W (100), and W (110) are 4.47 eV, 4.63 eV, and 5.25 eV, respectively [23].
When the interaction potential between an ion and target changes dynamically, the well-established Thomas–Fermi (TF) statistical atom model can be used, so the Coulomb potential between a projectile and a target atom can be approximated as [9]; [24]
where Z1 and Z2 are the nuclear charges of the projectile and target atom, respectively, r is the inter-atomic distance, and
in which ai = {0.35, 0.55, 0.1} and bi = {0.3, 1.2, 6.0}. aF is the screening length [25]; [26]; [27].
where q1 and q2 are the charge states of the projectile and target atom, respectively.
As the HCI approaches the surface, the outer-orbital electrons from ions may be peeled off by the electrons on the target atoms when the distance between the HCI and free electron gas (FEG) edge of the surface is less than a certain threshold value [28]; [29]. SF may occur when the projectile approaches the surface closely enough. Furthermore, more details about the inelastic collision process (electron energy loss contributions) are described in Section 3.
2.2 Establishment of the targets
Tungsten targets with 25 atoms per layer were constructed using Vesta software, exhibiting distinct atom arrangements. For bcc W, the lattice constant a is 3.16 Å. The face spans of the targets are
3 Simulations
3.1 Calculation of electron density
To accurately estimate the energy loss of ions, it is essential to describe correctly the crystal structure and the inhomogeneous electron density distribution of the surface. In this case, the electron densities of W surfaces were calculated using the VASP [15]. The choice of interatomic potentials is crucial for the calculation of surface electron density. F. J. Domínguez-Gutiérrez et al. discussed various interatomic potentials for tungsten, considering different potential models like EAM, EAM/ZBL, MEAM, ABOP, and tabGAP for nanoindentation simulations [31]. However, only the ground state of tungsten is needed in this work. Therefore, based on the first principle of density functional theory (DFT), VASP utilizes standard pseudopotentials from the potential library and a plane-wave basis set to perform ab initio total-energy calculations for metallic systems. This package is widely used for electronic structure calculations across various materials, including metallic and semiconducting surfaces, as well as liquid and amorphous semiconductors, even for systems of considerable size.
3.1.1 Density functional theory formulations
The electron density (ne) was calculated iteratively by solving the Kohn–Sham equations, accounting for atomic spatial environments. The Kohn–Sham equation can be written as
where ∇2 is the Laplace operator, Veff(r) is the time-independent effective potential energy at the position r of the electron (Eq. 6), Ψi(r) is the electronic wave functions, and ɛi is the total energy, with
where Vion(r) is the local ionic pseudopotential, VH(r) is the Hartree potential, and Vxc(r) is the exchange-correlation potential. In conclusion, according to Eq. 5, Kohn–Sham ground state energy only depends on ne.
3.1.2 Exchange-correlation energy
In the early stages, the local density approximation (LDA) was successful but encountered limitations when dealing with abrupt changes in electron density. The generalized gradient approximation (GGA) accounted for gradient terms in ne. Therefore, GGA was adopted for exchange-correlation energy calculations due to its advantages over LDA.
First, GGA incorporates the gradient of the electron density, unlike LDA, which only considers the density at a single point. This inclusion allows GGA to better capture non-local effects in the exchange-correlation functional, leading to more accurate descriptions of molecular systems with varying electron densities. Second, GGA often includes corrections for dispersion forces, which are interactions between molecules due to fluctuating electron distributions, whereas LDA typically fails to adequately describe dispersion forces. Finally, GGA has the ability to overcome the over-binding issues of LDA for isolated molecules and can offer better descriptions of electron excitation. LDA often underestimates band gaps, whereas GGA can provide more reliable predictions by incorporating additional information about the electron density gradient [18]; [32].
3.2 Charge-exchange energy loss
The charge-exchange energy loss is one of the focuses of this study. As previously mentioned, the charge transfer occurs mainly through resonant and Auger processes. In the simulation, the coupled rate equation (Eq. 7) were used to judge whether the charge-exchange processes occurred [33]. The population Pn of the nth shell can be described by the rate equation [9]; [16]:
where
Accompanying the charge exchange of the HCI with the metallic surface, the charge-exchange energy loss takes place. This charge-exchange energy loss can be approximated as a soft collision [34]. In the simulation, P, T, and m denote the projectiles, target atoms, and electrons, respectively. When the high-lying levels of the HCI capture surface electrons, giving rise to the process P + (T + m) → (P + m) + T, the charge-exchange energy loss can be calculated using the following expression[35]:
where mP, mT, and m represent the masses of the projectiles, lattice atoms, and electrons, while BP and BT signify the binding energy of the exchanged electrons, and EP corresponds to the energy of the projectiles (Eq. 8). However, in the (P + m) + T → P + m + T process, when the electron resonates loss with unoccupied states on the crystal surface, the contribution of BT to the energy loss can be neglected. As a result, the expression for charge-exchange energy loss can be written as [35]
where v represents the laboratory-frame velocity of the projectiles and B = BP + Ec, where Ec stands for the mean kinetic energy of electrons separated from the projectiles (Eq. 9), a concept thoroughly discussed in [36].
3.3 Theoretical model of the motion and electron energy loss of the ion
The interaction of Ar17+ ions with the W target was simulated using a Monte Carlo program developed by our group. The theoretical basis of the simulation is described as follows.
The force experienced by particles at a certain position above the surface can be expressed as
where q represents the charge state of projectiles, R indicates the position relative to the topmost layer, and the first term on the right side of the equation represents the attractive force of the induced image charges. The second term represents the sum of the repulsive forces exerted by all atoms on the particles. The surface potential Eq. 2 is employed in Eq. 10.
As soon as the ion–surface distance R < 5.0 a.u. is reached, the short-distance EEL is calculated immediately. The energy loss for a step length is given by
where Se is the position-dependent electron stopping power. When considering the stopping power of incident ions, the dielectric effect of the target material needs to be considered. The induced potential generated by ions grazing on a solid surface is
The local dielectric function for metals is written as [37]
where
where kF = vF is the Fermi wave number,
When the projectile is located outside the FEG
where q0 is the initial ionization degree, L is a characteristic length, and
When the projectile enters the FEG
where
Then, in Eq. 14,
or
where fr(k) = fr(k, 0) and fi(k) = fi(k, 0); the detailed expression of fr(k, z) and fi(k, z) is given in [41], in which we learned that a parameter γ0 links to all of factors of Eq. 14, and
where Ec(rs) is the correlation energy of electron gas, which is given in [42]. Further details are given in [9]; [24,27].
4 Results and discussion
4.1 Stopping power Se above the W surface
Variation in Se is evident in the profile of the relationship between Se and ion–surface distance z on the W (111) surface, as shown in Figure 2. As the ion–surface distance z decreases, Se increases exponentially with z, coinciding with a rapid and double-exponential increase in the ionization degree of incident ions. However, when z < 2.87 a.u., Se decreases with decreasing z until approximately z = 0.56 a.u. and then shows an increasing trend. In the range 0.56 a.u. < z < 2.87 a.u., ions enter the FEG on the surface, and the growing screening effect of the target electrons on ions reduces the polarization capability of the ions on the surface. When z < 0.56 a.u., the increase in Se can be attributed to the contribution of inner-shell electron ionization of the target atoms.
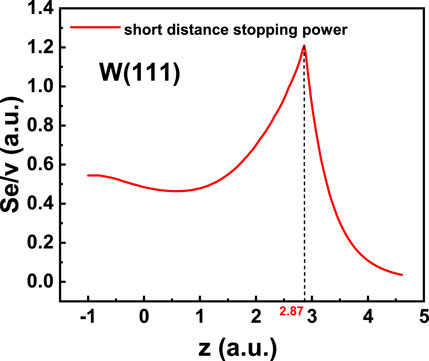
Figure 2. Short-distance stopping power of the Arq+ ion with initial velocity v = 1.0 a.u. interacting with the W (111) surface as a function of the ion–surface distance z. The dashed line indicates the location of the free electron gas edge.
Figure 3 presents two-dimensional contour-color plots depicting the electron density ne and the corresponding Se on a plane (z = 1.49 a.u.) for W (111), W (100), and W (110) surfaces, respectively. These results reveal the varying corrugation in Se across different crystal surfaces, with reduced Se in areas of higher electron density. This observation corroborates the finding in the vertical direction and suggests that Se also depends on the inhomogeneous electron density distribution on the x–y plane.
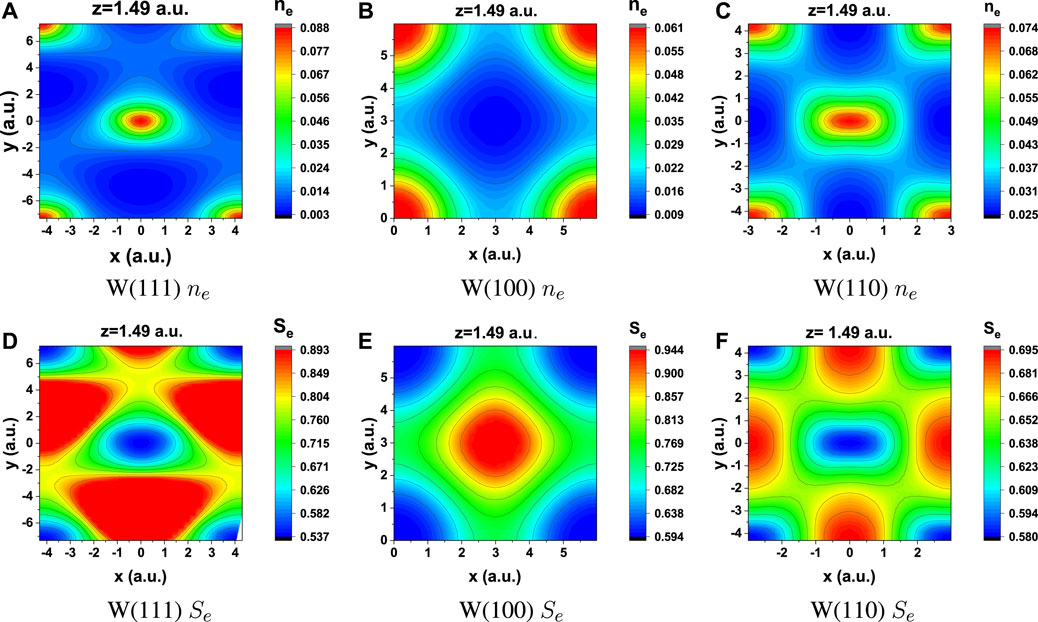
Figure 3. Plots of electron density ne on the surface vs. stopping power Se in two-dimensions for ion–surface distance z = 1.49 a.u. on the surfaces of W (111), W (100), and W (110).
The three-dimensional spatial distribution of Se on the W (111), W (100), and W (110) surfaces is shown in Figures 4A–C. It is noteworthy that the corrugation of Se is most pronounced on the W (111) surface, whereas the corrugation of Se is flat on the W (110) surface. These features are attributed to W (110) and W (111), corresponding to the closest packed and most open atom arrangements, respectively. It is also observed that the Se distribution under the axial channeling (red arrow, grazing along low-index directions) is relatively more uniform compared to the planar channeling (grazing along random directions).
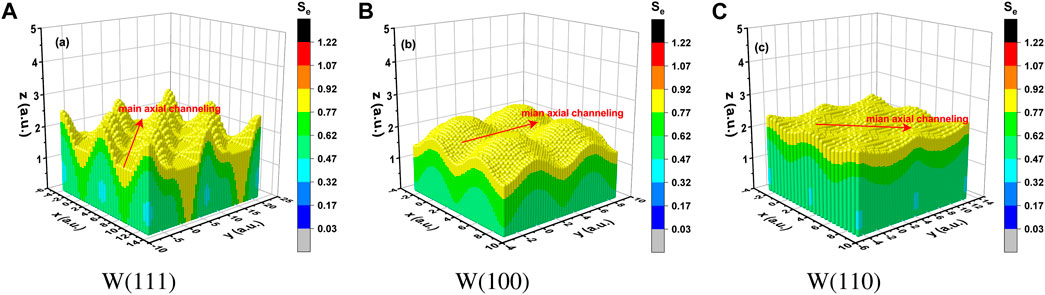
Figure 4. Three-dimensional distribution of Se on the surfaces of W (111), W (100), and W (110).
4.2 Energy loss
4.2.1 Energy loss of Ar16+ grazing on graphite
Based on the theoretical model described above, the calculated energy losses of 51-keV Ar16+ ions grazing on a graphite (C) surface at various small incident angles (0.7°,1.7°, and 2.4°) are compared to experimental results. The electron density distribution on the surface is inhomogeneous. The ion energy loss spectra were obtained, as depicted in Figure 5A. The charge-exchange energy loss spectra (top) have a slight variation as the incident angles increase. The peak positions shift to the lower energy-loss side with increasing incident angle, and the peak values decrease sequentially by approximately 300 eV and 100 eV. The electron energy loss spectra (middle) have similar peaks at incidence angles of 0.7° and 2.4°, and the spectrum at 2.4° is broader. Conversely, at incident angles of 1.7° and 0.7°, the electron energy loss spectra exhibited similar broadening characteristics, but the peaks had deviations at approximately 200 eV. Furthermore, the final energy spectra (bottom) of Ar16+ ions align with the charge exchange and electron energy spectra. The peak positions at 1.7° and 2.4° are almost unchanged, with a slightly greater broadening spectrum at 2.4°. Notably, the maximum peak position of the final energy spectrum at 0.7° locates a low energy-loss side. These observations suggest that the projectile trajectory length through the electron gas is longer when the incident angle is smaller. The longer trajectory length of ions leads to enhanced total energy loss. On the contrary, at a larger incident angle of 2.4°, although the ion trajectory length may shorten, the projectiles experience a more complex electron environment in the vicinity of the topmost atomic layer. The feature results in a broader width in the energy-loss spectrum. It is obvious that the final energy of the projectiles is approximately 49 keV for three incident angles. Our calculation results are consistent with experimental findings, as depicted in Figure 5B [43], further validating the efficacy of our theoretical approach in capturing the energy loss of projectiles in ion–surface interactions.
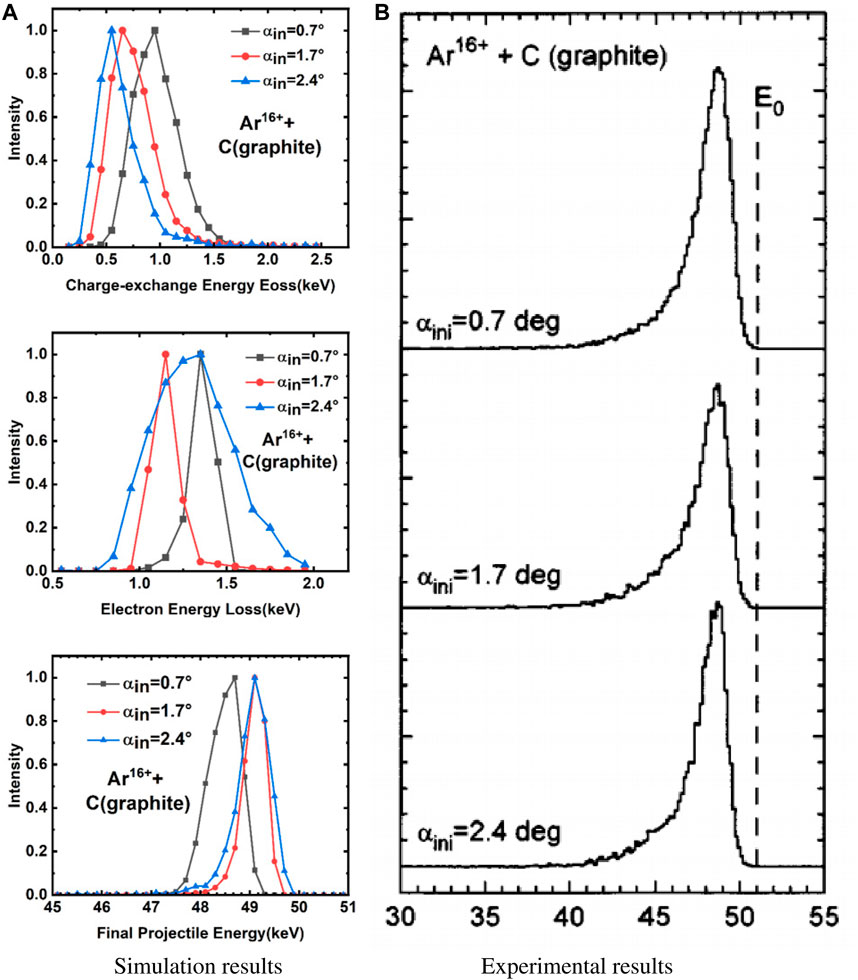
Figure 5. Energy-loss spectra for Ar16+ ions grazing on a graphite surface at three incident angles. (A) The top panel shows the charge-exchange energy-loss spectra, the middle panel shows the electron energy-loss spectra, and the bottom panel shows the final energy spectra. (B) Experimental results of [43].
4.2.2 Energy loss of Ar17+ grazing on tungsten surfaces
4.2.2.1 Ions traveling in uniform and inhomogeneous electron gas on W (100) and W (110) surfaces under axial channeling
The interaction simulation of 180-keV Ar17+ ions grazing on the W surfaces was performed at an incident angle of 0.8°. Both uniform (depending on z, uniform distribution in the x − y plane) and inhomogeneous (inhomogeneous distribution in all three dimensions of x, y, and z) electron density distributions were considered. The ions grazed on W (100) and W (110) surfaces under secondary axial channeling (low-index directions except main axial channeling) and main axial channeling (the closest packed atom direction among axial channeling; the main axial channeling of W (100) and W (110) are ψin = 0° and ψin = 35°, respectively).
For ions traveling in uniform and inhomogeneous electron gas under axial channeling, the charge-exchange energy loss (CEEL) spectra (Figures 6A, D) are almost unchanged. The results show that the charge-exchange energy loss depends mainly on the initial charge state of the ion, while the influence of the electron density distribution on charge-exchange processes can be neglected.
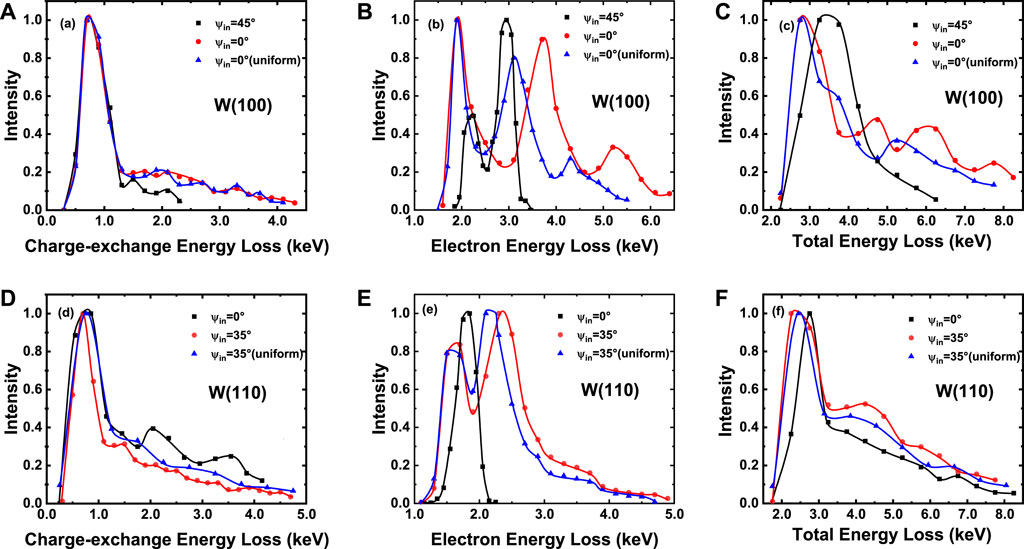
Figure 6. Energy-loss spectra of 180-keV Ar17+ ions grazing scattering on W (100) and W (110) surfaces at an incident angle of 0.8°. The conditions are compared under uniform and inhomogeneous surface electron gas distributions.
Notably, a two-peak structure in low intensity at the high energy-loss side in the CEEL spectra is observed when Ar17+ ions interact with W (100) and W (110) surfaces for ψin = 45° and ψin = 0°, while the two-peak structure disappears for ions moving under main axial channeling. Figures 7A–C shows that the electron density distribution under main axial channeling displays smoother characteristics, while the electron density distribution exhibits stronger localization under secondary axial channeling.
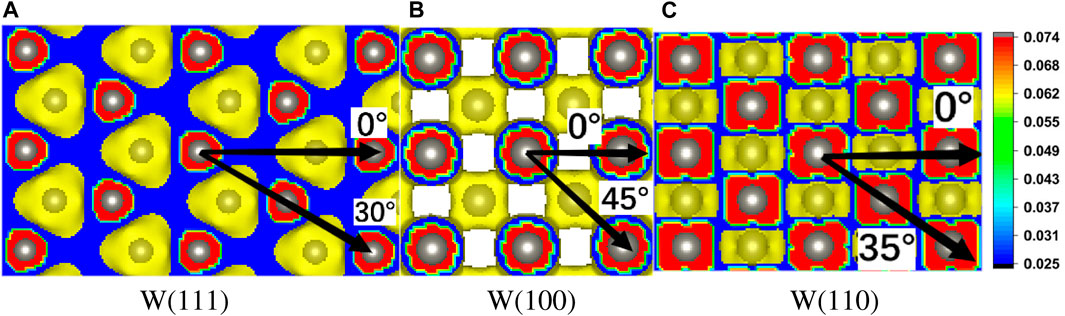
Figure 7. Vertical views of electron distribution on W (111), W (100), and W (110) surfaces; the yellow color denotes that the electron cloud covers second-layer atoms.
A more pronounced influence of inhomogeneous electron density distribution on the EEL is shown on the high energy-loss side. For ions incident on the W (100) surface (Figure 6B) under main axial channeling, the EEL spectrum exhibits a three-peak structure. The gradually increasing deviations for the latter two peaks about uniform and inhomogeneous electron density distributions are observed. The peaks at the high energy-loss side indicate that ions enter the electron gas deeper, and the impact of inhomogeneous electron density corrugation on the EEL in the vicinity of the topmost atomic layer will be more intense. For the W (110) surface, the inherent stability of ne and Se (see Figure 4C) minimizes discrepancies in EEL spectra between inhomogeneous and uniform distributions (Figure 6E). The total energy loss spectra (Figures 6C, F) are consistent with their charge-exchange energy loss plus electron energy loss.
These observations indicate that different crystal surface structures and electron density distributions within the same crystal material have a significant impact on the energy loss of ions interacting with target surfaces.
4.2.2.2 Ions grazing on the W (111) surface under planar and axial channeling
The energy loss of Ar17+ ions grazing scattering from the W (111) surface under axial and planar channeling is further investigated. The CEEL spectra for axial channeling (ψin = 0°and 30°) have long tails (Figure 8A). However, the long tail disappears for ions grazing under planar channeling (ψin = 6°), indicating that the trajectory classes are identical. In addition, the spectrum for 0° axial channeling has a maximum at 0.9 keV and a small shoulder at approximately 1.7 keV, whereas a single peak exists in the spectrum for 30° azimuth. The phenomenon occurs because the surface exhibits lower atom density and a less ordered atom arrangement along the ψin = 0° direction compared to along the ψin = 30° direction (Figure 7A). The surface structure leads to less consistent and regular interactions between electrons and ions when ions graze along the ψin = 0° direction.
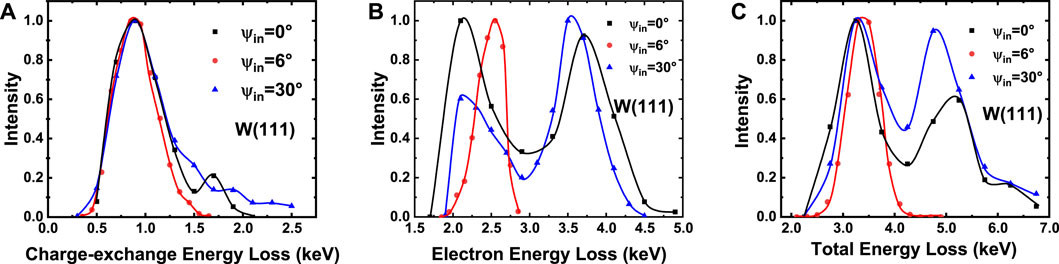
Figure 8. Energy-loss spectra of 180-keV Ar17+ ions grazing scattering on the W (111) surface at an incident angle of 0.8°.ψin = 0° and 30° represent axial channeling, and ψin = 6° represents planar channeling.
Under planar channeling, the shape of the EEL spectrum (Figure 8B) still shows a single peak at 2.55 keV and a narrow spread. Two peaks with similar intensity at 2.1 and 3.7 keV are observed when the ion grazes along the 0° azimuth direction, while the spectrum exhibits a smaller intensity peak at 2.1 keV and a larger intensity peak at 3.5 keV under main axial channeling. It is clear that the energy-loss spectra are fairly narrow for ions grazing along a random direction and broaden for scattering under axial channeling (Figure 8C). These observations suggest identical trajectory classes and shorter trajectory lengths (see Figure 10A) when ions move under planar channeling. Conversely, different trajectory classes arise for ions traveling under axial channeling.
These energy-loss spectra show that electron-stopping processes dominate the energy loss in ion–surface interactions, and the electron density (or Se) distribution of tungsten surfaces has a significant influence on the energy transfer.
4.3 Azimuthal angle and total energy loss
Furthermore, simulations were performed involving the grazing scattering of 180-keV Ar17+ ions from tungsten surfaces across a full azimuthal range (0°–360°) at an incident angle of 0.8°. The surface condition was set as either a uniform or an inhomogeneous electron gas. The energy loss was enhanced when ions grazed under axial channeling for surfaces with uniform or inhomogeneous electron gas (Figure 9). For the W (111) and W (110) surfaces, the energy loss varies with a period of 180° (Figures 9A, C), while the energy loss changing period is 90° for the W (100) surface (Figure 9B). The feature is in good agreement with the periodic arrangement of atoms on each crystal surface. The results show that information about the structure of the crystal surface can be obtained by studying the relationship between the energy loss of projectiles and the azimuthal orientation of the surface.
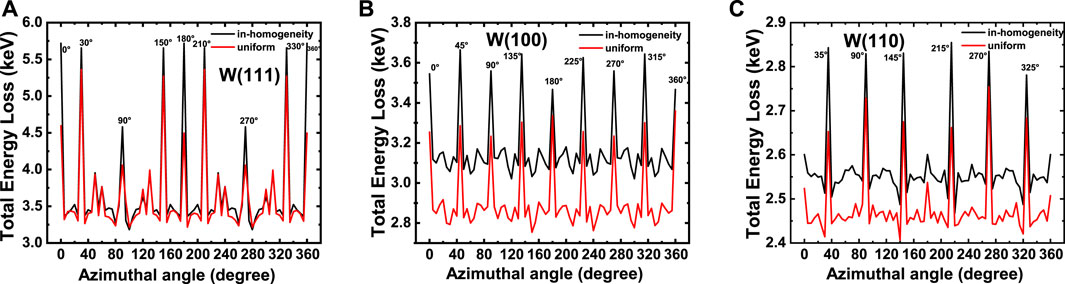
Figure 9. Total energy loss as a function of the azimuthal angle for the Ar17+ ion (E = 180 keV; αin = 0.8°) grazing on the W (111), W (100), and W (110) surfaces under inhomogeneous (black) and uniform (red) electron gas conditions.
For the W (111) surface (Figure 9A), the influence of the inhomogeneous distribution of surface electron density on the energy loss becomes evident only under axial channeling, because the closest distance is larger for ions grazing on the W (111) surface under planar channeling compared to that under axial channeling (Figure 10B). Therefore, ions can reach a deeper position, in which the change in electron density corrugation will be more intense for ions grazing under axial channeling. Meanwhile, the trajectory length of ions grazing on the W (111) surface is longer, resulting in greater energy loss than that on the W (100) and W (110) surfaces (Figure 10A).
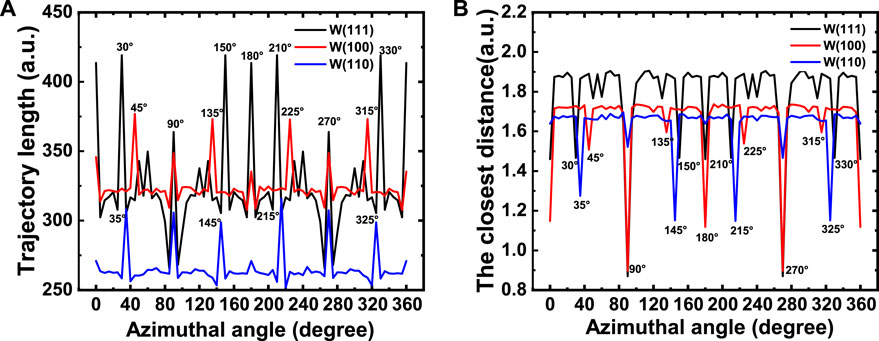
Figure 10. (A) Trajectory length of the Ar17+ ion grazing on the W (111), W (100), and W (110) surfaces along the full azimuthal angles and (B) the corresponding closest distance from the surfaces.
For the W (100) surface (Figure 9B), the energy loss significantly depends on the corrugation of the electron distribution. The difference is approximately 300 eV when ions graze scattering under planar channeling, and the deviations can reach 400 eV when ions move under axial channeling. First, ions can reach deeper positions from the surface than from the W (111) surface (Figure 10B). Second, the inhomogeneous distribution of the electron density on the W (100) surface is more pronounced than on the W (110) surface (Figure 4). The results show that the dependence of the electron density distribution on the energy loss of ions grazing on the W (100) surface is stronger than that on the W (111) and W (110) surfaces.
In Figure 9C, the ordered arrangement of atoms on the W (110) surface allows a smoother electron density distribution, leading to minimal impact of both uniform and inhomogeneous electron gas conditions on ion energy loss (less than 100 eV under planar channeling).
These observations highlight the necessity for a detailed characterization of the crystal surface structure and the inhomogeneous distribution of surface electron density for ions grazing on surfaces.
5 Conclusion
The study reveals the significant influence of surface structures, inhomogeneous electron density distribution, incident azimuthal angles, and trajectories classes on the energy loss of Ar17+ ions interacting with tungsten crystal surfaces. The energy loss spectra of Ar17+ ions grazing on the surface depend notably on the electron density distribution on the higher energy-loss side. Furthermore, the influence of electron density distribution on the energy-loss spectra of ions grazing on the W (100) surface is enhanced compared to the W (111) and W (110) surfaces, indicating that the surface structure and electron density distribution must be described in detail for studying ion–surface interactions. Moreover, the study highlights the dominance of electron-stopping processes and the correlation between ion energy loss and surface electron density distribution. Further investigations into ion–surface interactions can deepen our comprehension of surface dynamics and advance tailored material design for various technological advancements.
Data availability statement
The raw data supporting the conclusion of this article will be made available by the authors, without undue reservation.
Author contributions
ZX: conceptualization, data curation, formal analysis, investigation, methodology, visualization, writing–original draft, and writing–review and editing. XL: funding acquisition, methodology, project administration, resources, software, supervision, and writing–review and editing.
Funding
The author(s) declare that financial support was received for the research, authorship, and/or publication of this article. This study was funded by the Guangxi Scientific Program Foundation (Guike AD20238068), the National Natural Science Foundation of China (grant no. 11405166), and the research foundation of Guilin University of Technology (grant no. GUTQDJJ 2019177).
Conflict of interest
The authors declare that the research was conducted in the absence of any commercial or financial relationships that could be construed as a potential conflict of interest.
Publisher’s note
All claims expressed in this article are solely those of the authors and do not necessarily represent those of their affiliated organizations, or those of the publisher, the editors, and the reviewers. Any product that may be evaluated in this article, or claim that may be made by its manufacturer, is not guaranteed or endorsed by the publisher.
References
1. Romero M, Bonetto F, García E, Influence of single adsorbed atoms on charge exchange during ion-surface collisions. Phys Rev A (2023) 107:032803. doi:10.1103/physreva.107.032803
2. Kim B, Bae J, Jeong H, Hahn S, Yoo S, Nam S, Deep neural network-based reduced-order modeling of ion–surface interactions combined with molecular dynamics simulation. J Phys D: Appl Phys (2023) 56:384005. doi:10.1088/1361-6463/acdd7f
3. Ashirov A, Kutliev U, Xakimov S, Ismailov S, Low energy Ar<sup>+; ions scattering from SiO2 (001);<I10> surface under grazing incidence. Mater Sci Forum (2022) 1049:152–7. doi:10.4028/www.scientific.net/msf.1049.152
4. Rahali R, Lebius H, Benyagoub A, Gardes E, Guillous S, Monnet I, et al. SrTiO3 surface micro-structuring with swift heavy ions in grazing incidence geometry. Materialia (2023) 27:101696. doi:10.1016/j.mtla.2023.101696
5. Dergham P, Aumayr F, Lamour E, Macé S, Prigent C, Steydli S, et al. Toward probing surface magnetism with highly charged ions. Atoms (2022) 10:151. doi:10.3390/atoms10040151
6. Wilhelm R, The charge exchange of slow highly charged ions at surfaces unraveled with freestanding 2D materials. Surf Sci Rep (2022) 77:100577. doi:10.1016/j.surfrep.2022.100577
7. Majkić M, Nedeljković N, Velocity effect on the nanostructure creation at a solid surface by the impact of slow highly charged ions. Vacuum (2021) 190:110301. doi:10.1016/j.vacuum.2021.110301
8. Shi Y, Zhang X, Li Y, Liu P, Ding B, Yin L, et al. Observation of significant electron loss in grazing scattering of negative ions off a LiF (100) surface. Appl Surf Sci (2019) 487:116–26. doi:10.1016/j.apsusc.2019.05.037
9. Luo X, Hu B, Zhang C, Wang J, Chen C, Energy loss and electron and x-ray emission of slow highly charged Arq+ ions in grazing incidence on an Al(111) surface. Phys Rev A (2010) 81:052902–90. doi:10.1103/physreva.81.052902
10. Tamm A, Caro M, Caro A, Correa A, Role of electrons in collision cascades in solids. II. molecular dynamics. Phys Rev B (2019) 99:174302. doi:10.1103/physrevb.99.174302
11. Moldabekov Z, Dornheim T, Bonitz M, Ramazanov T, Ion energy-loss characteristics and friction in a free-electron gas at warm dense matter and nonideal dense plasma conditions. Phys Rev E (2020) 101:053203. doi:10.1103/physreve.101.053203
12. Lee C, Stewart J, Dingreville R, Foiles S, Schleife A, Multiscale simulations of electron and ion dynamics in self-irradiated silicon. Phys Rev B (2020) 102:024107. doi:10.1103/physrevb.102.024107
13. Mery M, Chen L, Valdés J, Esaulov V, On the determination of stopping cross-sections in ion scattering in solids and deviations from standard models. Radiat Effects Defects Sol (2020) 175:160–76. doi:10.1080/10420150.2020.1718141
14. Skriver H, The LMTO method: muffin-tin orbitals and electronic structure. Berlin, Germany: Springer Science and Business Media (2012).
15. Kresse G, Furthmüller J, Efficient iterative schemes for ab initio total-energy calculations using a plane-wave basis set. Phys Rev B, Condensed matter (1996) 54:11169–86. doi:10.1103/physrevb.54.11169
16. Burgdörfer J, Lerner P, Meyer F, Above-surface neutralization of highly charged ions: the classical over-the-barrier model. Phys Rev A (1991) 44:5674–85. doi:10.1103/physreva.44.5674
17. Maier and Hans . Development of tungsten coatings for application in fusion experiments. Trans Tech Publications (2005) 2155–69. doi:10.4028/www.scientific.netMSF.475-479.1377
18. Jones R, Gunnarsson O, The density functional formalism, its applications and prospects. Rev Mod Phys (1989) 61:689–746. doi:10.1103/revmodphys.61.689
19. Uwe T., Hollow ion formation and decay in slow Bi46+-C60collisions. Phys Rev A, 55, (1997). doi:10.1103/PhysRevA.55.479
20. Saathoff G, Gwinner G, Kühl T, Schwalm D, Winter H, Wolf A, Rate predictions for two photon spectroscopy of highly charged ions through laser induced recombination. Hyperfine Interactions (2000) 127:211–4. doi:10.1023/a:1012695618166
21. Mishra P, Rajput J, Safvan C, Vig S, Kadhane U, Electron emission and electron transfer processes in proton-naphthalene collisions at intermediate velocities. Phys Rev A (2013) 88:052707. doi:10.1103/physreva.88.052707
22. Briand J, Giardino G, Borsoni G, Le Roux V, Béchu N, Dreuil S, et al. The interaction of slow highly charged ions on surfaces (invited). Rev Scientific Instr (2000) 71:627–30. doi:10.1063/1.1150333
23. Inglesfield J, Surface electronic structure. Rep Prog Phys (1982) 45:223–84. doi:10.1088/0034-4885/45/3/001
24. Wang J, Zhang J, Gu J, Luo X, Hu B, Highly charged Arq+ ions interacting with metals. Phys Rev A (2009) 80:062902. doi:10.1103/physreva.80.062902
25. Yamamura Y, Nakagawa S, Tawara H, Simulation of low-energy HCI-solid interaction. Nucl Instr Methods Phys Res Section B: Beam Interactions Mater Atoms (1995) 98:400–6. doi:10.1016/0168-583x(95)00155-7
26. Winter H, Collisions of atoms and ions with surfaces under grazing incidence. Phys Rep (2002) 367:387–582. doi:10.1016/s0370-1573(02)00010-8
27. Wang J, Ding B, Song X, Shi Y, Guo X, Liu X, et al. Nuclear versus electronic energy loss in slow Ar ion scattering on a Cu (100) surface: experiment and simulations. Phys Rev A (2020) 102:012805. doi:10.1103/physreva.102.012805
28. Ducrée J, Andrä H, Thumm U, Neutralization of hyperthermal multiply charged ions at surfaces: comparison between the extended dynamical overbarrier model and experiment. Phys Rev A (1999) 60:3029–43. doi:10.1103/physreva.60.3029
29. Smith N, Chen C, Weinert M, Distance of the image plane from metal surfaces. Phys Rev B (1989) 40:7565–73. doi:10.1103/physrevb.40.7565
30. Cortenraad R, Ermolov S, Moest B, Gon A, Glebovsky V, Brongersma H, Crystal-face dependence of low-energy ion scattering signals. Nucl Inst Methods Phys Res B (2001) 174:173–80. doi:10.1016/s0168-583x(00)00452-3
31. Domínguez-Gutiérrez F, Grigorev P, Naghdi A, Byggmästar J, Wei G, Swinburne T, et al. Nanoindentation of tungsten: from interatomic potentials to dislocation plasticity mechanisms. Phys Rev Mater (2023) 7:043603. doi:10.1103/physrevmaterials.7.043603
32. Valdés J, Vargas P, Celedón C, Sanchez E, Guillemot L, Esaulov V, Electronic density corrugation and crystal azimuthal orientation effects on energy losses of hydrogen ions in grazing scattering on a ag (110) surface. Phys Rev A (2008) 78:032902. doi:10.1103/physreva.78.032902
33. Wirtz L, Reinhold C, Lemell C, Burgdörfer J, Liouville master equation for multielectron dynamics: neutralization of highly charged ions near a LiF surface. Phys Rev A (2003) 67:012903. doi:10.1103/physreva.67.012903
34. Bridwell L, Hay H, Pender L, Sofield C, Treacy P, Excitation of swift heavy ions in foil targets. IV. preequilibrium energy losses and mean charge states. Aust J Phys (1988) 41:681–92. doi:10.1071/ph880681
35. Hu B, Chen C, Song Y, Gu J, Energy loss of low energy ion N+qgrazing on the Al(111) surface. Chin Phys (2007) 16:1285–9. doi:10.1088/1009-1963/16/5/020
36. Burgdörfer J, Meyer F, Image acceleration of multiply charged ions by metallic surfaces. Phys Rev A (1993) 47:R20–2. doi:10.1103/physreva.47.r20
37. Song Y, Wang Y, Miskovic Z, Energy loss of heavy ions specularly reflected from surfaces under glancing-angle incidence. Phys Rev A (2001) 63:052902. doi:10.1103/physreva.63.052902
38. Bracco G, Holst B, Foreword—surface science techniques. Vacuum (2013) 45:647. doi:10.1016/0042-207x(94)90105-8
39. Pereira J, Extension of the Brandt–Kitagawa model for Hartree–Fock electronic densities. Nucl Instr Methods Phys Res Section B: Beam Interactions Mater Atoms (2006) 249:38–42. doi:10.1016/j.nimb.2006.03.018
40. Ziegler J, Ziegler M, Biersack J, SRIM–The stopping and range of ions in matter. Nucl Instr Methods Phys Res Section B: Beam Interactions Mater Atoms (2010) 268:1818–23. doi:10.1016/j.nimb.2010.02.091
41. Wang Y, Liu W, Energy loss of ions moving near a solid surface. Phys Rev A (1996) 54:636–40. doi:10.1103/physreva.54.636
42. Utsumi K, Ichimaru S, Dielectric formulation of strongly coupled electron liquids at metallic densities. II. exchange effects and static properties. Phys Rev B (1980) 22:5203–12. doi:10.1103/physrevb.22.5203
43. Winecki S, Stockli M, Cocke C, Energy loss of highly charged argon ions at grazing incidence on a graphite surface. Phys Rev A (1997) 55:4310–7. doi:10.1103/physreva.55.4310
Keywords: highly charged ions, energy losses, electron stopping power, electron density, grazing, scattering
Citation: Xie Z and Luo X (2024) Energy losses of highly charged Arq+ ions during grazing incidence on tungsten surfaces. Front. Phys. 12:1362594. doi: 10.3389/fphy.2024.1362594
Received: 28 December 2023; Accepted: 07 March 2024;
Published: 21 March 2024.
Edited by:
Alisher Kadyrov, Curtin University, AustraliaReviewed by:
Francisco Javier Dominguez Gutierrez, National Center for Nuclear Researche, PolandMichael Charlton, Swansea University, United Kingdom
Copyright © 2024 Xie and Luo. This is an open-access article distributed under the terms of the Creative Commons Attribution License (CC BY). The use, distribution or reproduction in other forums is permitted, provided the original author(s) and the copyright owner(s) are credited and that the original publication in this journal is cited, in accordance with accepted academic practice. No use, distribution or reproduction is permitted which does not comply with these terms.
*Correspondence: Xianwen Luo, MTg2ODE2MzA2OTJAMTYzLmNvbQ==