 Xutao Jia
 Tianhong Song
 Guang Liu
- Qinhuangdao Tianda Environmental Research Protection Institute Co., LTD., Qinghuandao, China
As an effective particle measurement method, laser-based particle sensors combined with unmanned aerial vehicles (UAVs) can be used for measuring air quality in near ground space. The Sniffer4D Mini2 features portability and real-time acquisition of accurate spatial distribution information on air pollution. Additionally, a new fine-grained analysis method called Co-KNN-DNN has been proposed to assess air quality between flight trajectories, allowing for a more detailed presentation of the continuous distribution of air quality. Therefore, this article introduces an unmanned aerial vehicle measurement fine-grained analysis method based on laser light scattering particle sensors. Firstly, the overall scheme was designed, M30T UAV was selected to carry the portable air quality monitoring equipment, with laser-based laser particulate matter sensor and Mini2, to collect AQI and related attributes of the near-ground layer in the selected research area, to do the necessary processing of the collected data, to build a data set suitable for model input, etc., to train and optimize the model, and to carry out practical application of the model. This article is based on the Co-KNN-DNN model for fine-grained analysis of air quality in spatial dimensions. Three experiments were conducted at different altitudes in the study area to investigate the practical application of fine-grained analysis of near-surface air quality. The experimental results show that the average R-squared value can reach 0.99. Choose to conduct experiments using the M30T UAV equipped with Sniffer4D Mini2 and a laser-based particulate matter sensor. The application research validates the effectiveness and practicality of the Co-KNN-DNN model.
1 Introduction
With the continuous advancement of China’s industrialization process, the concentration of various pollutants in the atmospheric environment continues to increase, while atmospheric pollutants can also seriously affect human health, so the effective monitoring of air pollution is necessary. Conventional methods of air pollution monitoring, such as ground station monitoring and meteorological towers, can provide accurate measurement results, but due to their fixed location and high cost [1], they cannot be used to assess pollution at different heights [2], which is crucial for understanding the behavior of local or regional pollutants [3].
Drones are playing an increasingly important role in a variety of industries, including safety and defense [4]. Doaa R et al. [5] used an unmanned aircraft system (UAS) equipped with air quality sensors to monitor fires on site before the fire spread. Perez Rojas Yulissa T [6]. Measurement of soil CO2 emissions using air quality sensors. Xiaofei Y et al. [7] established a plant security UAV mixed control model with actuator failure and uncertainty given the operation features of partial failure of spray cans and actuators. Jian Z et al. [8] proposed a method for detecting small targets in UAV images according to the revised YOLOv5 algorithm.
Drones are compact aircraft which can be remotely operated or pre-programmed for military, search, rescue, surveillance and remote sensing applications. Currently, due to the advantages of drones such as low cost, high sensitivity, and few restricted conditions, various applications and services related to drones have been brought in air pollution monitoring. For example, Konradin et al. [9] introduced the air quality monitoring system using drones, which carried different types of sensors to measure pollutant concentrations in predefined areas. Gao et al [10] proposed a vision-based UAV technique to monitor AQI, using high-definition cameras to capture panoramic images of the air from all directions. Lutz B et al. [11] developed a multi-helicopter system to investigate the aerosol particle, black carbon, ozone, NOx (nitrogen oxides) and CO concentration vertical distributions as well as the meteorological parameters of temperature and humidity. Mohammed Alaelddin F. Y. et al. [12] proposed UAV Pollution Tracking based on the Deep Q Network for guiding UAVs in multiple navigational directions in order to discover the location of a large area of pollution plume in a short period. Ozge Kucukkor et al. [13] designed a customized four-rotor UAV with a metal oxide semiconductor (MOS) type carbon monoxide (CO) sensor and data collection module for detecting and measuring CO contamination in industrial locations and in urban regions.
Existing research has proposed the incorporation of diverse types of sensors to measure atmospheric contaminants. Zhi Dess et al. [14] developed a UAV-based mobile portable monitoring platform by combining a propulsive sensor board with a dedicated communication module. Pochlas et al. [15] mounted nine distinct air quality sensors in a very small device, thus enabling a sensor device that measures several different substances simultaneously at a very low cost and can be easily and safely mounted on a small UAV. Adisorn L et al. [16] used PM2.5 and CO measurement value from IoT sensors for forest fire exploration and used the number of hot spots reported by both satellite and human observations to determine forest fire incidents. In [17] it is mentioned that the UAV laser monitoring platform can measure gases in the atmospheric boundary layer. In [18] an Unmanned Aerial Vehicle (UAV) with remote sensing methane detectors is proposed for detecting natural gases leakages in pipeline networks. Existing research has proposed a number of drones that utilize laser sensors. Sniffer4D Mini2 is a professional portable multi-gas monitoring system, which can be mounted on the UAV to obtain accurate spatial distribution information of air pollution in real-time. It has the characteristics of multi-parameter simultaneous monitoring, real-time monitoring of multiple terminals, one-click reporting, etc. It is widely used in typical scenarios such as air pollution source investigation and gas leakage point investigation. It can provide timely and effective decision support for environmental protection.
The earliest data-driven models used for air quality fine-grained analysis include Random Forest [19, 20], K-Nearest Neighbor(KNN) [21], Support Vector Machine(SVM) [22], XGBoost [23], LightGBM [24, 25], Artificial neural network (ANN) [26], etc. Zheng H et al. [27]used a series of machine learning integration methods to explore near-future fine-grained air quality level prediction tasks. Qin Z et al. [28] proposed a short-term air quality prediction model with K-Nearest Neighbor and Long Short-Term Memory. Jiaxuan Z et al. [29] presented a convolutional neural network-long Short-term Memory (CNN-LSTM) model to improve the accuracy of air quality prediction. Yang, Y. Z. et al. [30]proposed the Gaussian plume model on the basis of the neural network (GPM-NN), and design ARMS, an airborne UAV mobile air quality monitoring system, for efficient construction of fine-grained air quality maps in real time. Yaning Z et al. [31] proposed Co-KNN-DNN, a semi-supervised learning method for collaborative training integrating KNN and DNN, to conduct air quality fine-grained analysis in the spatial dimension, which can successfully prevent the problem of overfitting resulting from the limited number of labelled samples caused by the number of air quality monitoring sites, and thus improve the prediction accuracy.
Therefore, in this study, the M30T UAV equipped with Mini2 and laser particle sensor was selected based on the characteristics of UAV flexibility and mobility, combination of fixed-point and cruise, laser particle sensor’s special detection and counting of airborne particles, and Sniffer4D Mini2’s real-time monitoring and real-time analysis. Real-time monitoring of air quality data at different times, places and heights. The spatial distributions of atmosphere pollution were precisely obtained and the Co-KNN-DNN model was confirmed.
2 Materials and methods
2.1 Experimental study area
To ensure the flight safety of UAV, after a field survey and comprehensive judgment of the terrain and ground facilities of the study area, the experimental site selected in this study was between 115.791° −115.7935° East longitude and 37.19745°–37.199° north latitude. According to the pre-design, the monitoring was carried out in the range of relative altitude 0–50 m near the surface layer and returned to the flight after the completion of the monitoring. The experiment time was 2023/01/23 17:00.
2.2 Data preprocessing
2.2.1 Normalization of data
Whether it is air quality data or meteorological data, there will be a large difference of orders of magnitude. If such raw data are directly fed into the neural network, small input data may be ignored and directly recorded as 0, which will inevitably lead to violent oscillation of the training data flow, thus affecting the parameter adjustment during backpropagation. However, large input data make the computation complicated, resulting in the network not converging easily. Therefore, the Z-score method [32] was adopted in this paper to normalize the original data to balance the data dimensions and speed up the model’s search for the global optimal hyperparameter location. The specific formulas are shown in formulas (1, 2):
Where
After normalization, all attribute features in the original data set are mapped from the original interval to the interval [-1,1], that is, all attribute features are on the same order of magnitude and fluctuate around 0. If the normalized value is greater than 0, the original data value is higher than the average, otherwise, it is lower than the average.
2.2.2 Fourier filtering
To extract the time dependence of air quality changes, feature extraction, and modelling analysis should be carried out on the time series of the recorded air quality data. However, noise elements in the time series may lead to serious problems, so the noise in the data must be removed before feature extraction, that is, to find outliers in the data set and remove them.
The Fourier transform can shift the temporal sequence data to the frequency domain, filter out the noisy frequencies to remove the noise, and then apply the inverse Fourier transform and convert it to the time domain to get the filtered time series. The Fourier transform and inverse transform formulas are shown in formulas (3, 4):
For example, the comparison of the air quality data of the air quality monitoring site “Material Bureau (National control point)" before and after filtering is shown in Figure 1.

Figure 1. Comparison of AQI raw data and filtered data.
2.3 Co-KNN-DNN
K-Nearest Neighbors (KNN) algorithm is a frequently used supervised learning algorithm for regression and classification jobs. The principle is very simple, the basic idea is to classify or predict data by gauging the distance between distinct traits. The central idea of the KNN method of algorithm in dealing with regression problems is: if the distance between the sample to be tested and the K samples is the smallest in the feature space, the predicted value of this sample is the arithmetic average of the labeled values of these K samples.
DNN is composed of multiple neural network layers, each of which contains multiple neurons, which is suitable for network models handling intricate nonlinear relationships with outstanding regression capabilities. Forward propagation and backward propagation of deep neural networks are two key steps in the training process. Forward propagation refers to the process of input data passing through the input layer of the network, passing through multiple hidden layers, and finally reaching the output layer. As the input data passes through the network, each neuron weights it and passes the results to the next layer. Such a process is repeated continually till the output layer is achieved, which produces the predictions of the network. Backward propagation refers to adjusting the weight of each connection in the network by calculating discrepancy between the output of the network and the real result, thereby minimizing the error and improving the prediction accuracy of the network. This process is usually implemented using a backpropagation algorithm.
The cooperative training algorithm is a semi-supervised learning method based on multi-perspective learning [31]. In the training process, a few labelled samples with a lot of unlabeled samples can be integrated to significantly enhance the learning properties of the learner. Labeled samples refer to samples that have both features as well as labels, whereas unlabeled samples refer to data that have only features and without labels.
Co-KNN-DNN is a co-trained semi-supervised learning method integrating KNN as well as DNN to study the air quality in the near ground layer at a fine-grained level [31]. KNN and DNN as two distinct kinds of learners are fused using a one-view collaborative training policy, and during each of the iterations, each learner chooses a highest-confidence sample among the unlabeled samples for another learner to continuously extend its training set, which achieves the goal of improving the prediction performance using the unlabeled data. The Co-KNN-DNN model design is shown in Figure 2.
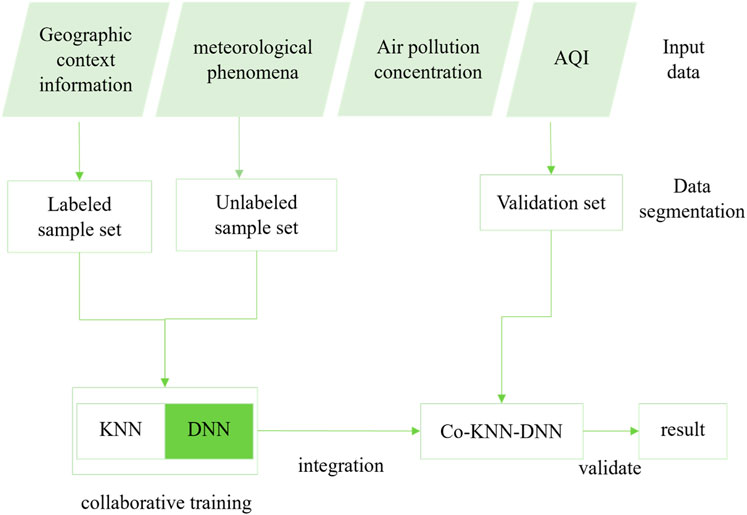
Figure 2. Design of Co-KNN-DNN model.
Co-KNN-DNN is realized as follows:
(1) Enter tag sample set
(2) The
(3) With constant iterative training, a great number of unlabeled samples were labeled, moved into the training set, and therefore fully utilized, and end up with two high performing and differentiated learners. The prediction results of two learners are not the same, if they are integrated into a model, the output result of the combination of two prediction results will be more reasonable, and can reduce the overall error, and obtain stronger performance than a single learner. Therefore, according to the idea of ensemble learning, the two learners KNN and DNN obtained by cooperative training are integrated into the whole model Co-KNN-DNN. Below is given the flowchart of the Co-KNN-DNN algorithm as shown in Figure 3.
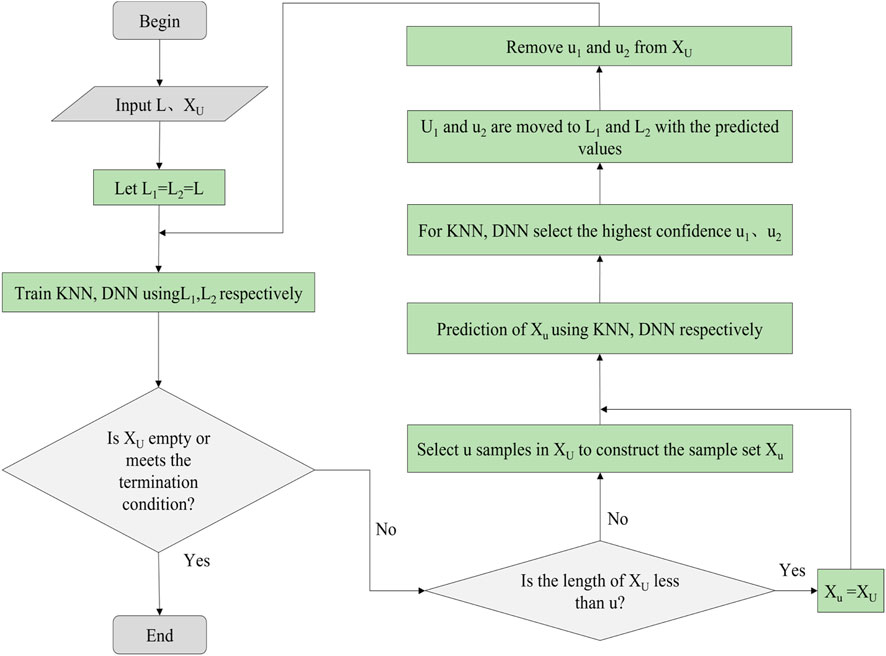
Figure 3. Co-KNN-DNN algorithm flow chart.
2.4 Laser particulate matter sensor
Honeywell HPM Particulate Matter Sensor, which is a high-performance laser-based particle sensor specifically designed to detect and count particles in the air, with a detection concentration range of 0 µ g/m3 to 1,000 µ g/m3. This sensor adopts advanced laser scattering technology and can accurately measure various particulate matter in the air, including PM2.5 and PM10. A laser light source irradiates the particles pulled into the detection chamber. The particles pass through the laser beam, reflect light, and record in the photo detector. Then the beam of light is analyzed and converted into an electronic signal, and finally the measurement results are converted into the concentration value of particulate matter in real time through built-in algorithms and processors.
HPM sensor uses the UART communication protocol to interact with micro-controller for data exchange, data acquisition, processing, and display. UART is a commonly used serial communication protocol, which has a fast data transmission rate, a simple protocol, and is easy to implement. Only two lines (except for the power line) are needed to achieve full duplex data transmission, making it suitable for applications with high real-time requirements. Figure 4 shows a simple application circuit. TXD and RXD are used for data exchange. VCC and GND provide power supply. Laser particle sensor have accurate and stable measurement performance, which is combined with drone M30T for air quality monitoring in this paper.
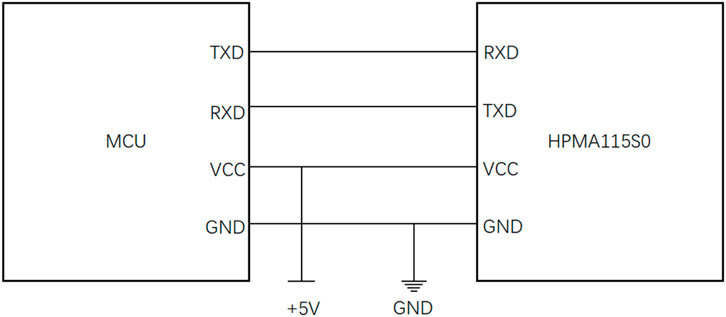
Figure 4. HPM sensor application circuit.
2.5 Evaluation indicators
To better evaluate the models, this paper adopted the three indexes of RMSE (root mean square error), MAE (mean absolute error) and R2 (R-squared) to assess the predictive effectiveness of each model. The calculation methods are shown in formulas (5–7). The lower the RMSE and MAE, and the more closely the R-squared is to 1, indicating that the model is more effective.
Where
2.6 Overall scheme design
Air quality monitoring systems paired with data analysis models can provide great convenience for solving air quality problems. Therefore, based on the Co-KNN-DNN model, this paper carried out the application research of the methodology for analyzing air quality in the near ground layer at a fine-grained level, selected a suitable device to collect data on the spot, and verified the effect of the model. In the overall scheme design, it was mainly divided into steps as illustrated in Figure 5, and the details of each move were as follows:
(1) Selection of the area to be studied, selection of a suitable data collection device, development of a scientific data collection program, and debugging of the device in preparation for data collection;
(2) After data collection, the task report and specific data information output by the device can be read to help us initially understand the air quality status of the near-ground layer in the study area;
(3) Selection of a suitable model for analyzing air quality in the near ground layer at a fine-grained level and construction of the corresponding dataset;
(4) Divide the constructed dataset and do necessary pre-processing;
(5) The processed data is entered into the selected model for model training and optimization and the final predictive output is obtained.
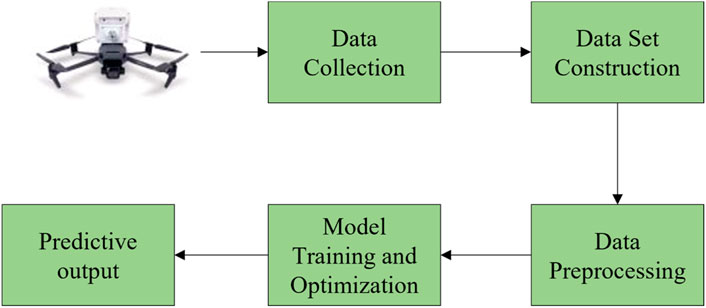
Figure 5. Application steps of near-ground air quality fine-grained analysis method.
Among them, the most important steps were data collection and dataset construction, because this will directly relate to the effect of subsequent model validation.
The flight trajectory design of the M30T UAV carrying Sniffer4D Mini2 and laser-based laser particulate matter sensor for air quality data acquisition in the selected research area is shown in Figure 6. Specifically, the UAV flies in a spiral mode from outside to inside at different heights, and the altitudes were selected as 26.3 m, 36.3 m, and 46.3 m respectively. The side view and top view of the trajectory are shown in Figures 7, 8 respectively. At each altitude, the center point of the spiral flight was located at 115.7922908° E and 37.19793151° N.
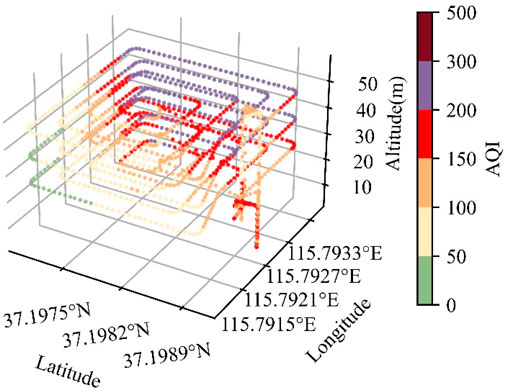
Figure 6. Panoramic view of UAV flight trajectory.
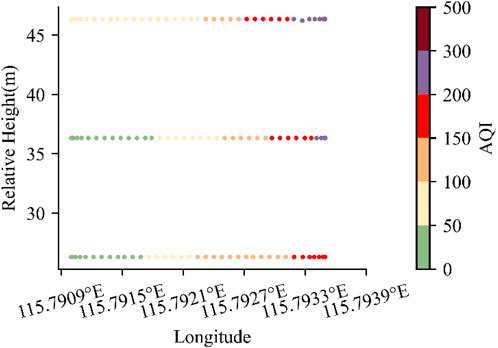
Figure 7. Side view of UAV flight trajectory.
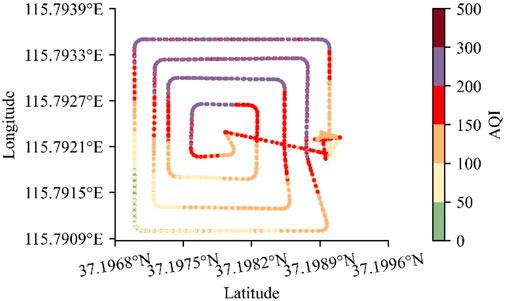
Figure 8. Top view of UAV flight trajectory.
2.7 Data analysis and dataset construction
The monitoring device Sniffer4D is equipped with a set of data visualization and analysis software. Real-time data transmission can be realized through mobile communication, and the original mission data file (.s4d format) can be automatically created and stored in the background. Task reports (.pdf format) and data tables (.csv format) with key analysis results can be generated with one click. For example, the report generated after the flight of 2023/01/23 17:00 is shown in Table 1.
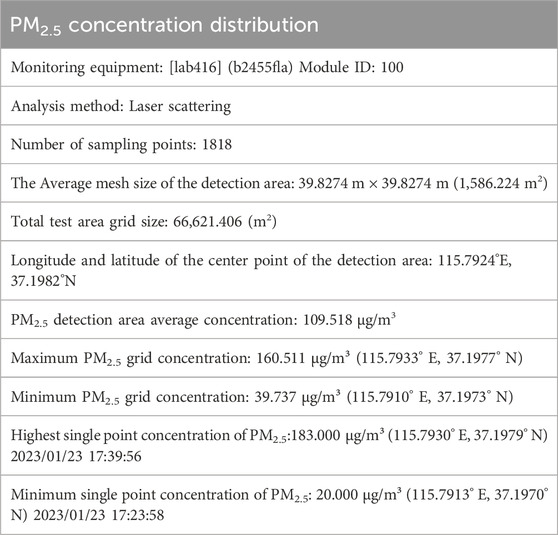
Table 1. Content of task report generated after the flight of UAV.
Based on the spatial dimensional air quality fine-grained analysis model Co-KNN-DNN, geographic information, meteorology, pollutant concentration, and AQI distribution data of monitoring locations in the study area were extracted. Among them, meteorological data included temperature and humidity; pollutant concentrations included PM2.5, PM10, SO2, NO2, CO and O3; geographical information included longitude and latitude; due to the small range and the same source type in all locations, this factor was not taken into account. The actual distribution of AQI in the collected data at each height is shown in Figures 9–11 respectively.
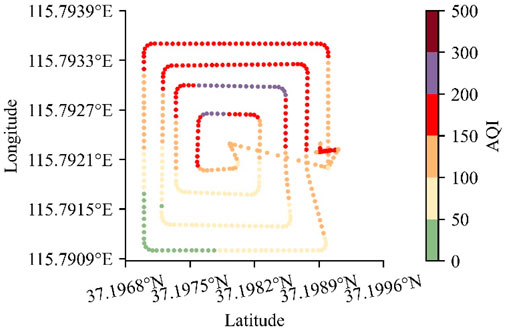
Figure 9. The AQI distribution collected by the M30T UAV carrying the Sniffer4D Mini2 and laser-based laser particulate matter sensor at 26.3 m.
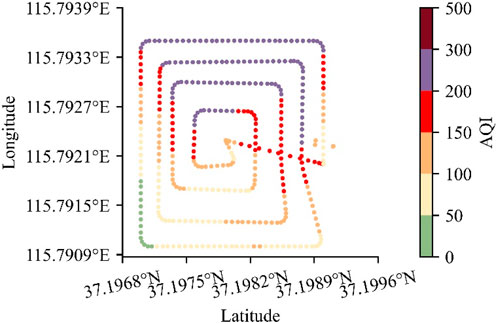
Figure 10. The AQI distribution collected by the M30T UAV carrying the Sniffer4D Mini2 and laser-based laser particulate matter sensor at 36.3 m.
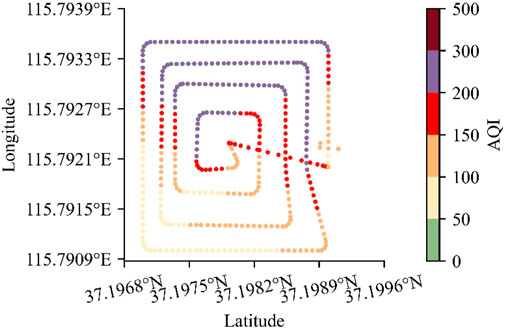
Figure 11. The AQI distribution collected by the M30T UAV carrying the Sniffer4D Mini2 and laser-based laser particulate matter sensor at 46.3 m.
3 Results and discussion
In this paper, an experiment was conducted at each height of the data collected by the M30T UAV carrying the Mini2 and laser-based laser particulate matter sensor. In each experiment, the experimental settings were configured in the Co-KNN-DNN model [31]. In this experiment, 290 samples of monitoring locations were randomly selected in the data set to form the initial labeled sample set. The Co-KNN-DNN model was trained by randomly selecting 200 samples of monitoring locations as the sample set for testing, and the remaining samples as unlabeled sample set. The rounds of iterations were setting to 100. After the completion of training, the unlabeled samples except the labeled sample set and the test sample set were predicted, and the distribution of AQI at each height was obtained, thus the overall distribution of AQI in the space was obtained. For this experiment, the model achieved the effect of complementing the trajectory of the UAV flight.
Indicators of the Co-KNN-DNN model in the test set samples are presented in Table 2. At each height, the R2 reaches 0.99. It is evident that the Co-KNN-DNN model achieved excellent results in every experiment.
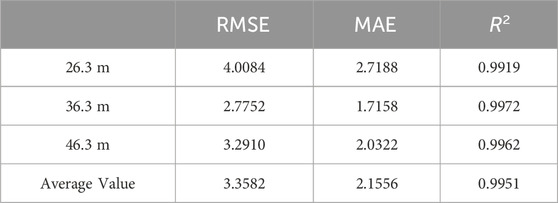
Table 2. Performance indicators of Co-KNN-DNN.
In addition, the AQI distribution of the labeled sample set used for model construction and optimization was shown in Figures 12–14, and the distribution prediction results of the trained model for the remaining unlabeled sample AQI in the space were shown in Figures 15–17. It can be seen that no matter at what height, the results predictions of the model were very near to the real distribution. In other words, the Co-KNN-DNN model can largely restore the AQI on the flight trajectory of the UAV according to the limited and sparse samples shown in Figures 12–14. The validity and practicability of the Co-KNN-DNN fine-grained air quality analysis model were verified.

Figure 12. The AQI distribution of 26.3 m labeled samples.
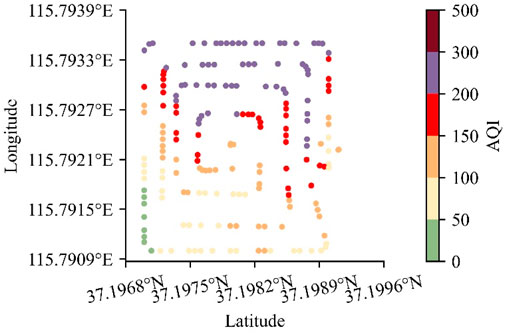
Figure 13. The AQI distributions of 36.3 m labeled samples.
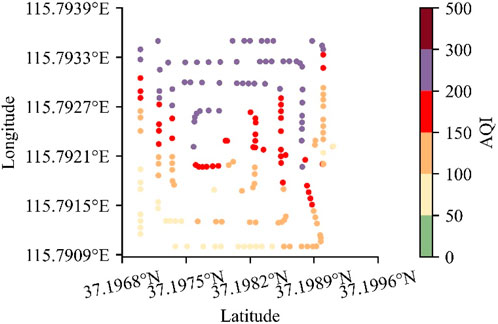
Figure 14. The AQI distributions of 46.3 m labeled samples.
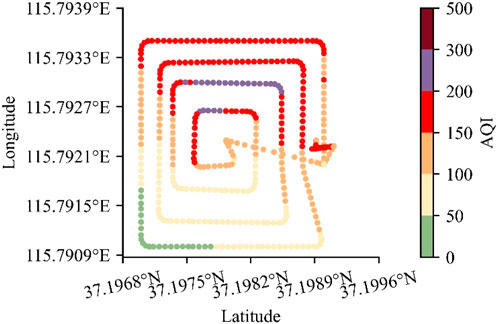
Figure 15. The AQI distribution of Co-KNN-DNN output at 26.3 m.
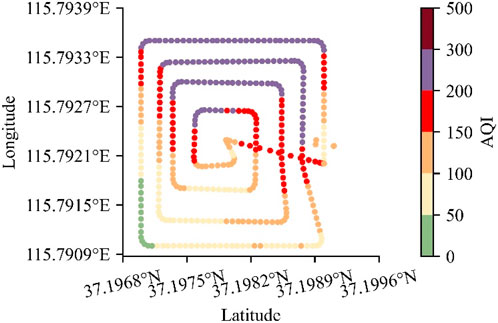
Figure 16. The AQI distribution of Co-KNN-DNN output at 36.3 m.
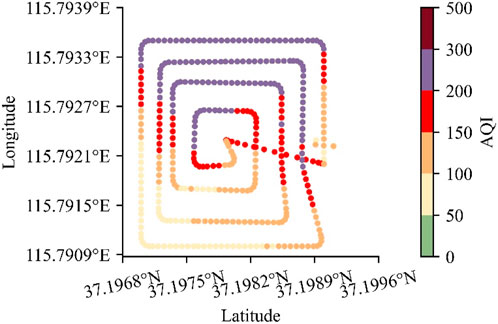
Figure 17. The AQI distribution of Co-KNN-DNN output at 46.3 m.
The Air Quality Index (AQI) is categorized into six levels [33]: excellent (AQI: from 0 to 50, unit: μg/m3), good (from 51 to 100, unit: μg/m3), mildly polluted (AQI: from 101 to 150, unit: μg/m3), moderately polluted (AQI: from 151 to 200, unit: μg/m3), heavily polluted (AQI: from 201 to 300, unit: μg/m3) and severely polluted (AQI: 300+, unit: μg/m3). In the experimental analysis diagram, air pollution levels are distinguished by color to facilitate the observation of the degree of air pollution in the area. It can be seen from the figure that the air quality in the area is poor, and the AQI value in the area is higher and higher with the increase of altitude, and the air quality is getting worse and worse.
4 Conclusion
In this study, the practical application of fine-grained analysis of air quality in the near ground layer was mainly carried out based on the spatial dimension air quality fine-grained analysis model Co-KNN-DNN. Firstly, the overall scheme was designed, mainly including the selection of the device, the place and time of data collection, data processing and data set construction, model training and optimization. Then, according to this scheme, an M30T UAV equipped with a Sniffer4D sniffer device and laser-based particle sensors was selected to collect data, and the flight trajectory of the UAV and the mission report output after the completion of the device acquisition task were shown. Finally, the data were tested on the Co-KNN-DNN model. In three experiments with different heights, the average R2 can reach 0.99, which verified the reliability and practical value of the model.
Data availability statement
The raw data supporting the conclusion of this article will be made available by the authors, without undue reservation.
Author contributions
XJ: Conceptualization, Methodology, Writing–review and editing. TS: Writing–original draft, Writing–review and editing. GL: Software, Validation, Writing–review and editing.
Funding
The author(s) declare that no financial support was received for the research, authorship, and/or publication of this article.
Conflict of interest
Authors XJ, TS, and GL were employed by Qinhuangdao Tianda Environmental Research Protection Institute Co., LTD.
Publisher’s note
All claims expressed in this article are solely those of the authors and do not necessarily represent those of their affiliated organizations, or those of the publisher, the editors and the reviewers. Any product that may be evaluated in this article, or claim that may be made by its manufacturer, is not guaranteed or endorsed by the publisher.
References
1. Lambey V, Prasad AD. A review on air quality measurement using an unmanned aerial vehicle. Water Air Soil Pollut (2021) 232(3):109. doi:10.1007/s11270-020-04973-5
2. Li XB, Wang DS, Lu QC, Peng ZR, Wang ZY. Investigating vertical distribution patterns of lower tropospheric PM2.5 using unmanned aerial vehicle measurements. Atmos Environ (2018) 173:62–71. doi:10.1016/j.atmosenv.2017.11.009
3. Arroyo P, Gómez-Suárez J, Herrero JL, Lozano J. Electrochemical gas sensing module combined with unmanned aerial vehicles for air quality monitoring. Sens Actuator B-Chem (2022) 364:131815. doi:10.1016/j.snb.2022.131815
4. Rabajczyk A, Zboina J, Zielecka M, Fellner R. Monitoring of selected cbrn threats in the air in industrial areas with the use of unmanned aerial vehicles. Atmosphere (2020) 11(12):1373. doi:10.3390/atmos11121373
5. Rjoub D, Alsharoa A, Masadeh A. Unmanned-aircraft-system-assisted early wildfire detection with air quality sensors. Electronics (2023) 12(5):1239. doi:10.3390/electronics12051239
6. Rojas YTP. Measuring soil CO2 emissions with air-quality sensors. Nat Rev Earth Environ (2023) 4(7):429. doi:10.1038/s43017-023-00435-8
7. Xiaofei Y, Xiangbing H, Hui Y, Wei L, Hao S. Fraction-order mrac method based fault tolerant control for plant protection UAV with actuator failure and uncertainty. Int J Control Automation Syst (2023) 21(8):2623–33. doi:10.1007/s12555-021-1039-3
8. Jian Z, Guoyang W, Ming J, Guifu L, Xiuwen T, Zhiyuan H. Small object detection in UAV image based on improved Yolov5. Syst Sci Control Eng (2023) 11(1). doi:10.1080/21642583.2023.2247082
9. Heweling G, Weber K, Fischer C, Lange M. The use of an octocopter UAV for the determination of air pollutants – a case study of the traffic induced pollution plume around a river bridge in duesseldorf. Int J Edu Learn Syst (2017) 63–6.
10. Gao JH, Hu ZW, Bian KG, Mao XY, Song LY. AQ360: UAV-aided air quality monitoring by 360-degree aerial panoramic images in urban areas. IEEE Internet Things J (2021) 8(1):428–42. doi:10.1109/jiot.2020.3004582
11. Bretschneider L, Schlerf A, Baum A, Bohlius H, Buchholz M, Düsing S, et al. Messbar-multicopter and instrumentation for air quality research. Atmosphere (2022) 13(4):629. doi:10.3390/atmos13040629
12. Mohammed AFY, Sultan SM, Cho S, Pyun JY. Powering UAV with deep Q-network for air quality tracking. Sensors (2022) 22(16):6118. doi:10.3390/s22166118
13. Kucukkor O, Aras O, Ozbek E, Ekici S, Hikmet Karakoc T. Design and analysis of an IOT enabled unmanned aerial vehicle to monitor carbon monoxide: methodology and application. Int J Glob Warming (2023) 29(1-2):66–77. doi:10.1504/ijgw.2023.10053770
14. Zhi SD, Wei YB, Yu ZH. Air quality monitoring platform based on remote unmanned aerial vehicle with wireless communication. In: International conference on future networks and distributed systems (ICFNDS) (2017).
15. Pochwaa S, Gardecki A, Lewandowski P, Somogyi V, Anweiler SJS. Developing of low-cost air pollution sensor—measurements with the unmanned aerial vehicles in Poland. Sensors (2020) 20(12):3582. doi:10.3390/s20123582
16. Lertsinsrubtavee A, Kanabkaew T, Raksakietisak S. Detection of forest fires and pollutant plume dispersion using iot air quality sensors. Environ Pollut (2023) 338:122701. doi:10.1016/j.envpol.2023.122701
17. Wang G, Wu H, Liao J, Wei Y, Qiao J, Dong L. Advances in UAV laser monitoring technology for pollutant gases. Acta Optica Sinica (2023) 43(18). doi:10.3788/AOS230504
18. Iwaszenko S, Kalisz P, Slota M, Rudzki A. Detection of natural gas leakages using a laser-based methane sensor and UAV. Remote Sensing (2021) 13(3):510. doi:10.3390/rs13030510
19. Araki S, Shima M, Yamamoto K. Spatiotemporal land use random forest model for estimating metropolitan NO2 exposure in Japan. Sci Total Environ (2018) 634:1269–77. doi:10.1016/j.scitotenv.2018.03.324
20. Qin XN, Do TH, Hofman J, Bonet ER, La Manna VP, Deligiannis N, et al. Fine-grained urban air quality mapping from sparse mobile air pollution measurements and dense traffic density. Remote Sensing (2022) 14(11):2613. doi:10.3390/rs14112613
21. Xu YN, Zhu YM, Shen YY, Yu JD. Fine-grained air quality inference with remote sensing data and ubiquitous urban data. ACM Trans Knowl Discov Data (2019) 13(5):1–27. doi:10.1145/3340847
22. Bing-Chun L, Arihant B, Pei-Chann C, Kumar TM, Cheng-Chin T, Chon-Lin LJPO. Urban air quality forecasting based on multi-dimensional collaborative support vector regression (svr): a case study of beijing-tianjin-shijiazhuang. Plos One (2017) 12(7):e0179763. doi:10.1371/journal.pone.0179763
23. Dai HB, Huang GQ, Zeng HB, Zhou FY. PM2.5 volatility prediction by XGboost-MLP based on garch models. J Clean Prod (2022) 356:131898. doi:10.1016/j.jclepro.2022.131898
24. Hongbin D, Guangqiu H, Huibin Z, Rongchuan Y. Haze risk assessment based on improved PCA-MEE and ISPO-LightGBM model. Systems (2022) 10(6):263. doi:10.3390/systems10060263
25.In: Q Meng, editor. LightGBM: a highly efficient gradient boosting decision tree. Neural information processing systems (2017).
26. Park S, Kim M, Kim M, Namgung HG, Kim KT, Cho KH, et al. Predicting PM10 concentration in Seoul metropolitan subway stations using artificial neural network (ANN). J Hazard Mater (2018) 341:75–82. doi:10.1016/j.jhazmat.2017.07.050
27. Zheng H, Cheng YH, Li HB. Investigation of the model ensemble for fine-grained air quality prediction. China Commun (2020) 17(7):207–23. doi:10.23919/J.CC.2020.07.015
28. Qin Z, Cen C, Guo X. Prediction of air quality based on KNN-lstm. J Phys Conf Ser (2019) 1237(4):042030. (6pp). doi:10.1088/1742-6596/1237/4/042030
29. Jiaxuan Z, Shunyong L. Air quality Index forecast in Beijing based on CNN-lstm multi-model. Chemosphere (2022) 308(P1):136180. doi:10.1016/j.chemosphere.2022.136180
30. Yang YZ, Zheng ZJ, Bian KG, Song LY, Han Z. Real-time profiling of fine-grained air quality Index distribution using UAV sensing. IEEE Internet Things J (2018) 5(1):186–98. doi:10.1109/jiot.2017.2777820
31. Zhao YN, Wang L, Zhang NN, Huang XW, Yang LK, Yang WB. Co-training semi-supervised learning for fine-grained air quality analysis. Atmosphere (2023) 14(1):143. doi:10.3390/atmos14010143
32. Han J, Kamber M. Data mining: concepts and techniques. Los Altos, CA: Morgan Kaufmann Publisher (2006).
Keywords: air quality fine-grained, Sniffer4D Mini2, M30T UAV, laser particulate matter sensor, Co-KNN-DNN
Citation: Jia X, Song T and Liu G (2024) Fine grained analysis method for unmanned aerial vehicle measurement based on laser-based light scattering particle sensing. Front. Phys. 12:1413037. doi: 10.3389/fphy.2024.1413037
Received: 06 April 2024; Accepted: 26 April 2024;
Published: 14 May 2024.
Edited by:
Zhenxu Bai, Hebei University of Technology, ChinaReviewed by:
Lee Xiaobao, Hunan University of Technology, ChinaXuebin Sun, Tianjin University, China
Copyright © 2024 Jia, Song and Liu. This is an open-access article distributed under the terms of the Creative Commons Attribution License (CC BY). The use, distribution or reproduction in other forums is permitted, provided the original author(s) and the copyright owner(s) are credited and that the original publication in this journal is cited, in accordance with accepted academic practice. No use, distribution or reproduction is permitted which does not comply with these terms.
*Correspondence: Xutao Jia, amlheHQ5QDE2My5jb20=