 Dasen Xu
 Huaipu Kang
- Institute of Fluid Physics, China Academy of Engineering Physics, Mianyang, Sichuan, China
Introduction: Understanding ejecta generation from lead under detonation is critical for applications requiring high-strain-rate material performance. However, conventional single-method diagnostics often struggle to capture both high-density and low-density ejecta accurately, particularly in low-melting-point metals where phase transitions complicate measurements.
Methods: To address these challenges, we integrated three advanced diagnostics—photonic Doppler velocimetry (PDV), an improved Asay-F window, and high-speed X-ray imaging. Lead samples with micro-defects were explosively loaded, creating shock-induced spallation and fragmentation. PDV provided high-resolution velocity data, while the Asay-F window captured ejecta density at multiple radial locations. Concurrently, high-speed X-ray imaging offered two-dimensional density distributions, which were processed via Abel inversion to obtain three-dimensional ejecta profiles.
Results: The combined approach successfully resolved both dense and sparse ejecta layers, revealing complex velocity gradients ranging up to nearly 3000 m/s and indicating localized tensile failures driven by micro-defects. The Asay-F window measurements showed density transitions from as low as 0.2% to over 1% of solid lead, corroborated by X-ray-derived data. Notably, spatial analysis indicated layered fragmentation governed by wave interactions, distinguishing planar from spherical shock contributions.
Discussion: By leveraging the complementary strengths of PDV, Asay-F window, and X-ray diagnostics, this study achieves a comprehensive characterization of ejecta formation in shock-loaded lead. The reliable correlation among velocity, density, and spatial morphology not only validates dynamic failure models but also enables refined insights into micro-defect–driven fragmentation. These findings advance diagnostic capabilities for detonation-driven phenomena and provide a robust framework for designing materials and protective systems under extreme conditions.
1 Introduction
The study of dynamic damage mechanisms, particularly spallation and fragmentation, is crucial for understanding material behavior under explosive loading conditions [1, 2]. Spallation refers to the ejection of material fragments caused by tensile stresses generated by shock waves, which exceed the material’s cohesive strength [3, 4]. This phenomenon plays a central role in material failure, particularly in high-energy applications such as inertial confinement fusion (ICF), aerospace, and defense technologies. Accurate prediction and control of spallation and fragmentation are vital for improving the reliability and performance of materials under extreme conditions [5, 6].
Despite significant progress in the study of spallation and fragmentation, existing diagnostic methods still face limitations, especially in the measurement of high-density ejecta [7, 8]. Traditional diagnostic techniques, such as piezoelectric probes and interferometry, have been valuable for characterizing low-density ejecta, but they fail to resolve high-density ejecta under extreme loading conditions, particularly in materials like lead and tin, which experience significant changes in behavior when subjected to explosive loading, including phase transitions from solid to liquid. Early studies, such as those by Asay et al. [1] and Buttler et al. [2], identified these challenges, but current methods still struggle to measure high-density ejecta, especially under multi-shock or high-pressure detonation conditions [9, 10].
In response to these challenges, this study proposes an innovative, multi-method diagnostic approach that integrates three advanced diagnostic technologies: improved Asay-F window diagnostics, photonic Doppler velocimetry (PDV), and high-speed X-ray imaging [11, 12]. The originality of this approach lies in its ability to simultaneously capture both high-density and low-density ejecta within a single framework, addressing a significant gap in the current literature. While each of these techniques has been used individually, their integration offers a significant advancement by overcoming the limitations of traditional single-method approaches [13–15].
The Asay-F window technique, developed by Chen et al [16]. has been effective in diagnosing spallation behavior by providing precise measurements of mass and density distributions of fragmented materials under extreme shock loading [17]. However, this technique alone may be insufficient for fully resolving high-density ejecta [13–15]. Photonic Doppler velocimetry (PDV) is another widely used method for measuring ejecta velocity with high precision, though it tends to be limited to capturing low-density particles when used independently. High-speed X-ray imaging provides visualization of the spatial distribution of ejecta, but it also faces challenges in accurately capturing high-density ejecta, especially in high-pressure environments [18–20]. By integrating these three techniques—Asay-F window, PDV, and X-ray imaging—this research aims to provide a more comprehensive and accurate analysis of spallation and fragmentation dynamics.
This study builds upon previous work combining PDV and X-ray imaging, which faced limitations in resolving high-density ejecta. By integrating the Asay-F window, this research addresses these challenges, enabling precise measurements of both high-density and low-density ejecta, thereby advancing the understanding of dynamic damage mechanisms. The combination of these three diagnostic methods allows real-time monitoring of ejecta velocity and spatial distribution, providing a more comprehensive view of spallation and fragmentation processes. Additionally, the study addresses the complexities introduced by the solid-liquid phase transition in low-melting-point metals under shock loading, which traditional methods fail to capture. Focusing on this transition, the research enhances diagnostic capabilities, particularly for high-density ejecta under extreme detonation conditions. In conclusion, this innovative, multi-method approach integrates Asay-F window diagnostics, PDV, and high-speed X-ray imaging to offer a novel method for characterizing ejecta across a wide range of densities. These findings contribute significantly to understanding dynamic damage mechanisms and offer valuable insights for applications in defense, aerospace, and materials science, where understanding material behavior under extreme conditions is crucial.
2 Methods
2.1 Experimental setup and shock loading
The experimental setup was developed to investigate the spallation and fragmentation behavior of lead (Pb) under explosive detonation conditions, using advanced diagnostic tools to capture the velocity, density, and spatial evolution of ejecta. A center-initiated detonator was used to trigger a high-energy explosive of diameter Φ100 mm, loaded onto a Φ100 mm lead sample. The initiation produced a spherical shock wave, which transformed into a quasi-planar wave during propagation through the lead sample.
The lead sample, prepared as a disc with Φ100 mm diameter and 4 mm thickness, was not subjected to annealing, and retained a surface roughness of 1.6 µm resulting from the machining process. These surface features, characterized by white light interferometry, were critical for the initiation of high-velocity ejecta. The interferometry analysis showed a “wavy” contour, as depicted in Figure 1B, covering a 1.6 mm square area near the sample center. These features served as sites for ejecta formation, with micro-defects enhancing the initiation of material fragmentation under detonation loading.
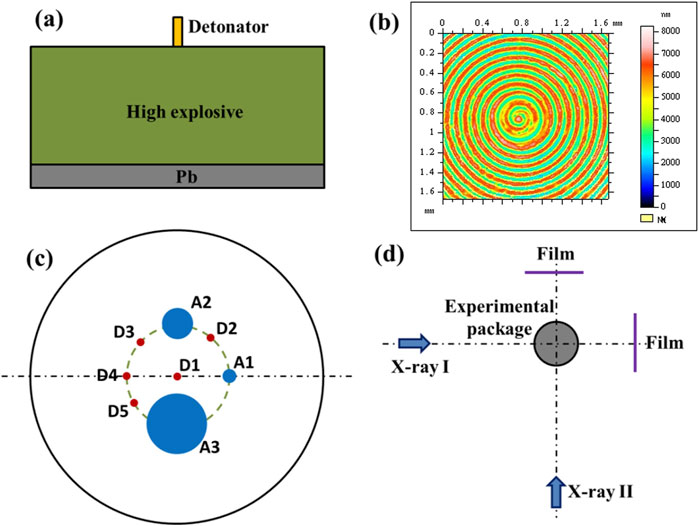
Figure 1. (a) Schematic of experiment setup. (b) microscopic image of sample surface close to its center. (c) probe layout. (d) layout of X-ray photography.
Upon reaching the lead surface, the shock wave reflected as a rarefaction wave, which interacted with rarefaction waves from the rear surface, inducing tensile stresses that resulted in spallation and fragmentation. The diagnostics described below were chosen to monitor and quantify the key aspects of the dynamic response, including particle velocity, density, and distribution. The following diagnostic tools were employed: Improved Asay-F Window (AW); Photonic Doppler Velocimetry (PDV); High-Speed X-ray Imaging.
2.2 Diagnostic tools and instrumentation
Improved Asay-F Window (AW) [16]: The improved Asay-F window system was used to measure the mass and density distributions of the ejecta particles. It comprised a 20 mm thick LiF crystal, coated with 1 µm aluminum film, and bonded with 0.5 mm LiF using epoxy resin. This configuration enhanced signal capture, particularly for high-density ejecta. Due to the sparse wave effects generated by particle collisions with the LiF crystal, three different Asay probes with diameters of Φ4 mm, Φ10 mm, and Φ20 mm were utilized to characterize ejecta particles of varying sizes. The probes were placed 45 mm from the free surface of lead and 17.5 mm from the center of the lead sample to provide density data at multiple points.
Photonic Doppler Velocimetry (PDV): PDV was utilized to measure the velocity evolution of the ejecta, providing high temporal resolution data on the initiation timing, acceleration, and deceleration phases. The system employed five velocity probes (D1-D5) positioned to monitor different locations on the sample. D1 was located at the sample center, and D4-D5 were 17.5 mm away from the center to capture radial variations. The probes were placed 47 mm from the lead surface. The PDV system was synchronized with the detonation event, allowing for an accurate construction of the velocity-time profiles that captured the breakout velocity and subsequent dynamic behavior of ejecta.
High-Speed X-ray Imaging: Two high-speed X-ray cameras (I and II) were utilized to capture the spatial distribution of ejecta at two critical time intervals: 25.29 μs and 28.74 μs after shock breakout. The cameras were arranged to provide detailed imaging of surface density and spatial evolution during the fragmentation process. Step contrast calibration blocks were used to quantify ejecta density with high precision. Figure 1D illustrates the layout of the X-ray cameras. This technique was crucial for capturing the spatial fragmentation patterns and providing insights into the ejecta characteristics.
2.3 Data processing and analysis
Abel Inversion for X-ray Data: The X-ray imaging provided two-dimensional surface density data of the ejecta, which were subsequently converted into three-dimensional volume density distributions based on Abel inversion. This approach enabled a detailed analysis of the density variation across different regions and time points, helping to visualize the complex dynamics of spallation and fragmentation.
Asay Window Data Processing: Data obtained from the improved Asay window provided key insights into the spatial density distribution of the ejecta. The advanced configuration of the Asay window allowed for accurate measurement of ejecta density across high- and low-density regions, which was critical for understanding the effect of different shock loading conditions on material fragmentation.
PDV Data Analysis: The PDV data provided velocity-time profiles that described the complete dynamic response of the ejecta from initiation to breakout. The data were synchronized with other diagnostic measurements, ensuring consistency in the temporal analysis. PDV measurements allowed for a precise characterization of the velocity distribution at multiple points across the lead sample.
Integration of Diagnostic Data: The integration of data from PDV, Asay window, and X-ray imaging provided a comprehensive understanding of the spallation and fragmentation process. PDV offered detailed insights into the velocity profiles, X-ray imaging visualized the spatial fragmentation and density distribution, while the Asay window system measured ejecta density accurately at multiple locations. All data were synchronized with the initiation of the free surface serving as the zero-time reference, ensuring accurate temporal alignment for comparison and analysis.
2.4 Experimental method summary
This comprehensive experimental setup enabled the investigation of spallation and fragmentation dynamics of lead under explosive conditions, incorporating detailed measurements of velocity, density, and spatial evolution. The combination of PDV, improved Asay-F window, and high-speed X-ray imaging ensured that critical aspects of the ejecta behavior were captured and analyzed accurately. The integration of multiple diagnostic tools provided a robust framework to understand the effects of shock loading on lead’s dynamic response, including insights into both high-density and low-density ejecta behaviors, offering significant contributions to the study of material fragmentation under extreme conditions.
3 Results
Figure 2 shows the free surface velocity histories obtained from five PDV probes (D1 ∼ D5), labeled in subfigures (a) through (e), as well as the corresponding displacement-time profile in subfigure (f). All probes record nearly identical breakout times, indicating that the shock wave arrives at the free surface almost in unison. Following breakout, the velocity curves gradually converge, forming characteristic “velocity bands.” The estimated average free surface velocity for the lead sample is about 1750 m/s, and the fastest portions of the material approach speeds near 3,000 m/s, corresponding to a peak pressure around 33 GPa. These velocity bands (represented by the black curves in Figures 2A–E) were integrated to produce the displacement-time history seen in Figure 2F, revealing how the fastest ejecta behave after separating from the free surface. Notably, the peak displacement occurs later in the shock-loading timeline, underscoring the continued acceleration of high-speed ejecta. Probe D1, positioned at the sample center, generally exhibits higher velocities than the peripheral probes (D2 ∼ D5) — a pattern that highlights more intense direct loading at the center of the explosive detonation. This suite of measurements confirms that shock breakout is nearly simultaneous across the lead surface, illuminates the radial decrease in shock intensity, and distinguishes layers of ejecta moving at varying speeds, culminating in a comprehensive depiction of the sample’s dynamic response under detonation.
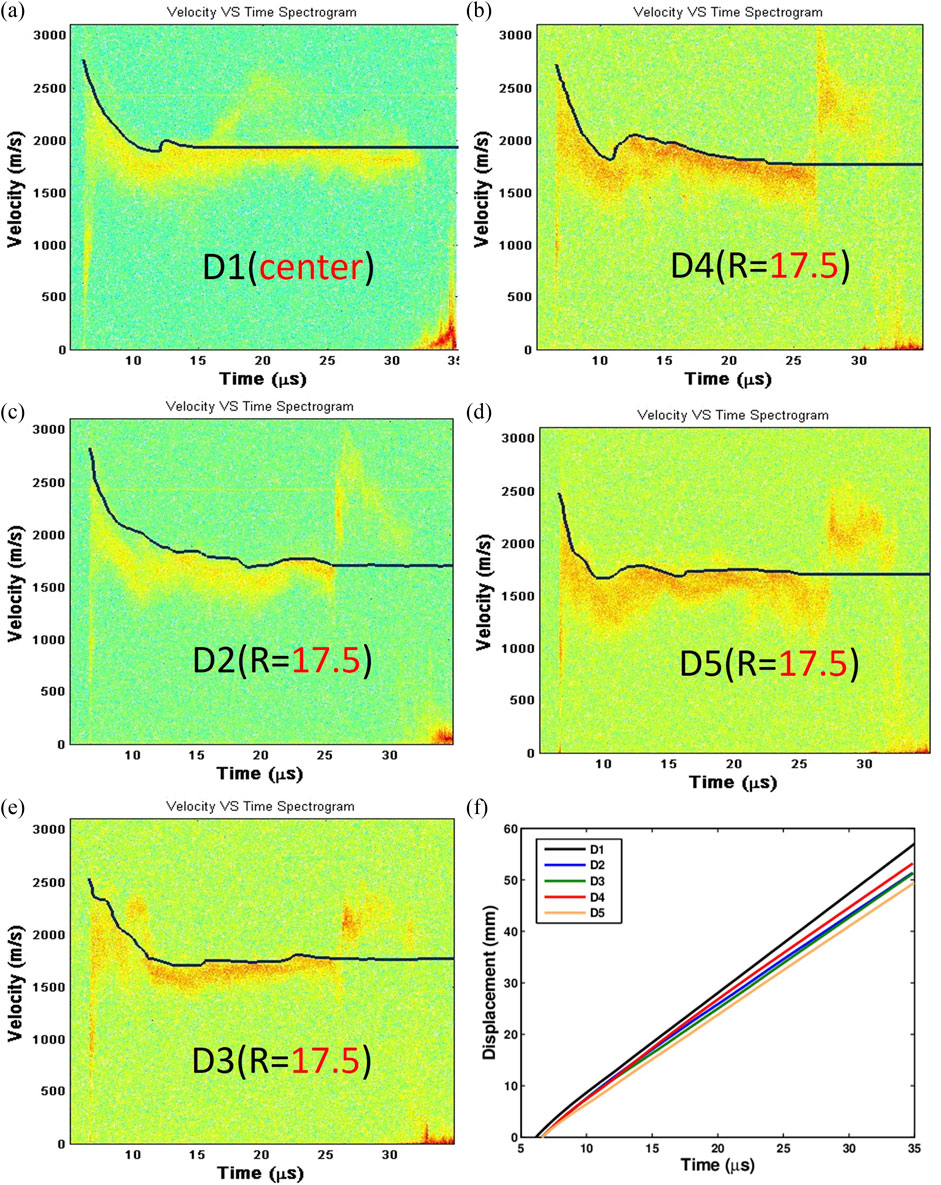
Figure 2. (a–e) Velocity profiles measured by DPS probes (D1-D5). (f) Displacement history for the fastest ejected particle.
X-ray images were taken at 25.29 μs and 28.74 μs after breakout, capturing the spallation and fragmentation phenomena, as shown in Figure 3. The fragmented material displayed distinct layered structures, where Interface 1 corresponded to planar shock loading, and Interface 2 exhibited characteristics of spherical shock loading. The average velocity at Interface 1 was approximately 1737 m/s, consistent with the upper edge of the velocity band observed at the same time point (Figures 2A–E). Interface 2 had an average velocity of about 1712 m/s, positioned near the center of the velocity band.
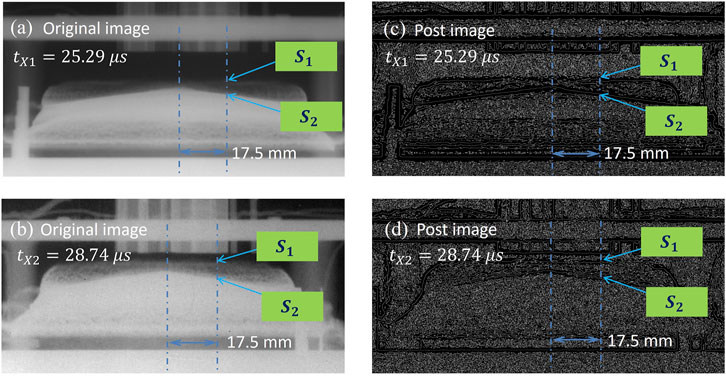
Figure 3. X-ray images (a)
The surface density distributions of the fragmented material, shown in Figures 4A, B, were converted to volume density distributions basing on Abel inversion. The density of the ejecta particles at Interface 1 was estimated to be between 0.2% and 0.4% of the original lead density, while Interface 2 exhibited a density of approximately 1% of the original density. Due to the use of a 1 MV X-ray system, the density values below Interface 2 might be lower than the actual values (limited penetration capability).

Figure 4. The volume density distribution. (a)
Table 1 summarizes the velocity and displacement data obtained from both PDV probes and X-ray diagnostics. At 25.29 μs, the displacement measured at D1 was 38.60 mm, whereas the X-ray measurement at S1 recorded 34.94 mm. By 28.74 μs, the displacement increased to 45.01 mm (D1) and 40.93 mm (S1). In terms of velocity, the measurements taken at 25.29 μs from DPS (D2-5) were 1.752 mm/μs, while the X-ray (S1) measured 1.737 mm/μs. These values remained consistent at 28.74 μs, indicating a uniform response of the ejecta particles as captured by both methods.
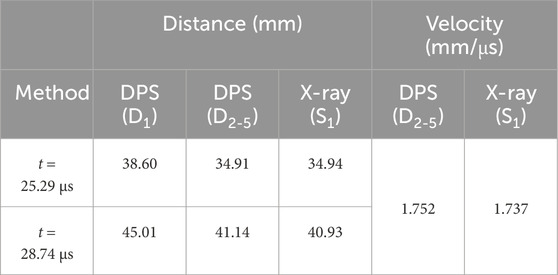
Table 1. Comparisons of moving distance and velocity between laser velocimetry and X-ray photography.
The velocity profiles obtained using the improved Asay window (AW) are shown in Figure 5. The initial time (T1) and transition time (T2) were recorded for each probe. The time measurements from both the AW and X-ray diagnostics are presented in Table 2, indicating that the response times from both methods were nearly identical.
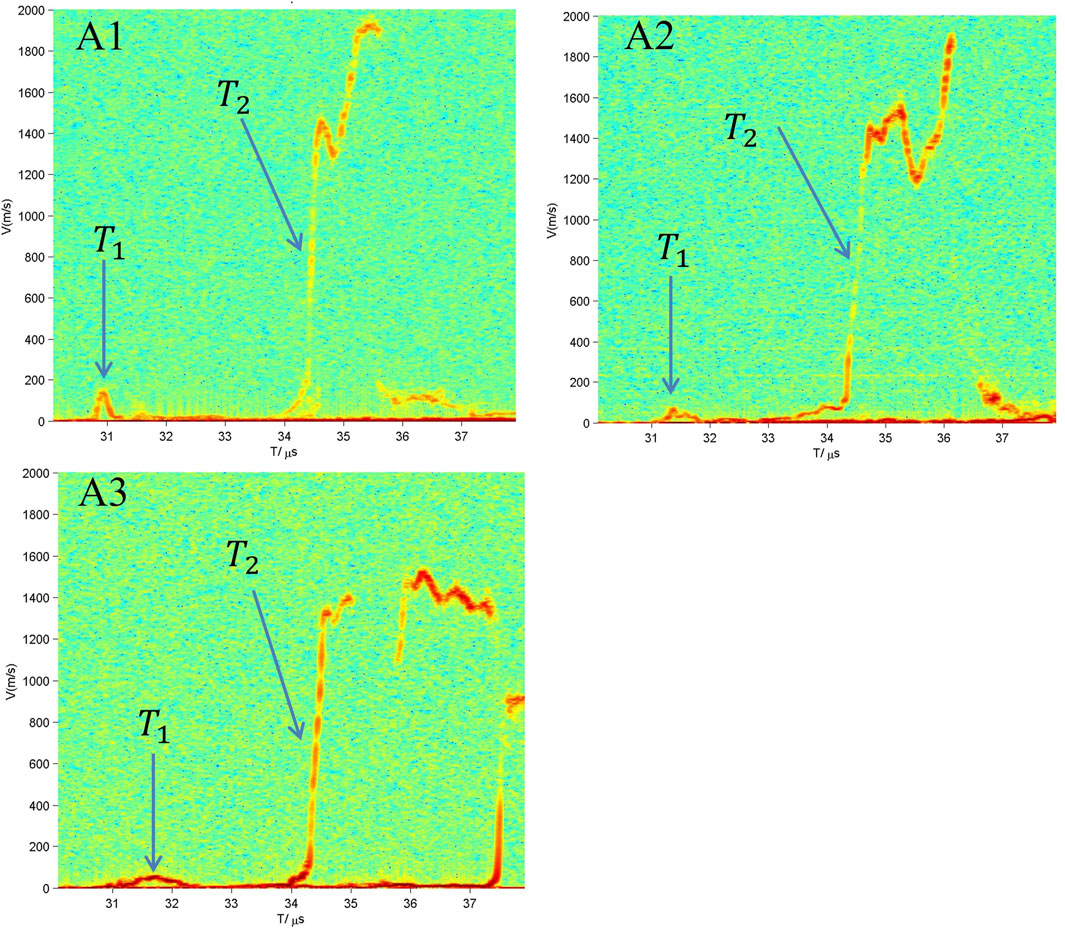
Figure 5. Interface velocity profile measured by AW (A1-A3).
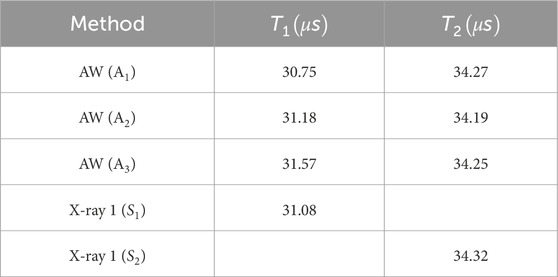
Table 2. Time comparisons between Asay window and X-ray tools.
These consistent response times confirm the reliability of both diagnostic methods for capturing the dynamic behavior of the ejecta during shock loading.
After T2, noticeable size effects were observed among the Asay window probes: A1 exhibited rarefaction wave interference at the edge of the LiF window, while A3 experienced the latest interference. The velocity profiles from A2 and A3 were then converted into spatial density distributions, as shown in Figure 6. The density of the ejecta impacting the Asay window at T1 was approximately 1.1% of the initial value. The material density between the two dynamic response times was very low, but increased rapidly afterward, approaching the density of lead (11.34 g/cm3). The trends observed in the volume density distributions of A2 and A3 were consistent, with A3 showing more clearly defined changes between the two response times.
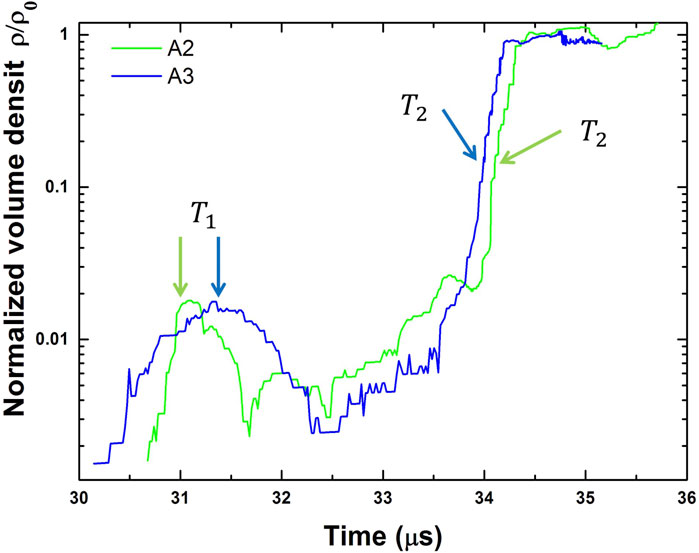
Figure 6. Volume density history of the impacted ejected particles.
4 Discussion and conclusion
In this study, we utilized a central detonator to initiate a high-explosive detonation, resulting in the formation of a triangular shock wave with spherical wave characteristics (as shown in Figure 1A). This loading configuration provided an opportunity to observe the sequential interaction of shock waves with the free surface of the lead sample, highlighting the spherical nature of the propagation. The PDV probe closest to the detonation center (D1) received the breakout signal first, followed by the AW (A3) response. This temporal sequence aligns well with the theoretical expectations, demonstrating the consistency between the experimental setup and the shock wave propagation model.
The X-ray imaging system played a crucial role in providing a detailed visualization of the inclined micro-spallation phenomena. As the shock wave reached the free surface, the interaction between the reflected rarefaction wave from the free surface and the trailing rarefaction wave produced distinct micro-spallation and ejecta layers. These layers were observed as two separate regions of fragmented material detaching from the surface at different times, as illustrated in Figure 3. This sequential detachment was further reflected in the free surface velocity profiles obtained using PDV, where a velocity band characteristic was observed, narrowing over time due to the decreasing speed of the sparse ejecta material. This characteristic velocity band implies that PDV data can effectively capture the maximum velocity of the fastest fragments in both the sparse ejecta and the micro-spallation layers, providing essential information on the dynamics of material ejection under detonation conditions (Figure 2).
The Asay window (AW) data complemented the PDV observations by providing two dynamic response data points, representing the motion of the separated ejecta layers as they moved away from the free surface. However, the AW technique was notably affected by rarefaction effects originating from the window’s edges, which contributed to interference signals that were inversely proportional to the window size after the fragmented material impacted the window. Despite these effects, the actual AW data showed consistency with theoretical predictions, confirming the reliability of the data and the effectiveness of the AW diagnostics under the given experimental conditions (Figures 5, 6).
High-speed X-ray imaging captured the evolving morphology of the ejecta cloud at 25.29 μs and 28.74 μs after impact, as shown in Figures 3, 7. The results demonstrated an initial chaotic and dispersed morphology of the ejecta, which transitioned into a more structured and coherent form over time. The planar shock loading produced a broader dispersion of particles, whereas the spherical shock wave caused the ejecta to adopt a more concentrated, columnar structure. This evolution in morphology highlights the impact of different shock loading geometries on the fragmentation and ejection processes of the lead sample. The spherical shock wave, in particular, promoted more efficient convergence and compaction of ejecta particles, leading to a higher local density and a more organized distribution. The distinct morphological differences captured in Figure 7 provide valuable insights into the influence of planar versus spherical loading on material fragmentation and offer a visual understanding of how shock wave geometry affects the behavior of ejected material.
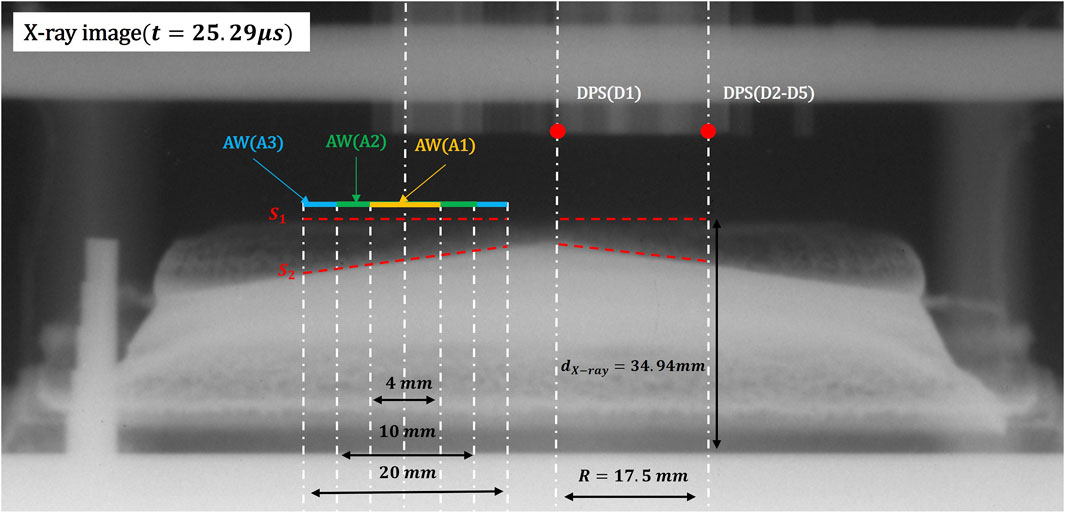
Figure 7. Diagnostic distributions of DPS probes, AW and X-ray tools for measuring the ejected particles.
One of the key innovations of this study lies in the combined use of multiple diagnostic tools—PDV, X-ray imaging, and AW—to characterize the spatial distribution of ejecta from lead samples with initial micro-defects (Figure 7). This combination not only enhanced the accuracy of spatial volume density measurements but also addressed the limitations inherent in each diagnostic method when used individually. For example, X-ray imaging provided detailed insights into the volume density distribution of ejecta along specific spatial directions (Figure 5). By averaging the volume density of ejecta particles along the X-direction, we obtained the spatial density profile along the Y-direction at a distance of 17.5 mm from the sample center, as represented by the blue line in Figure 8. For comparison, the AW diagnostic data at t = 25.29 μs were converted into a spatial density distribution using a time-to-space transformation method, shown by the green line in Figure 8.
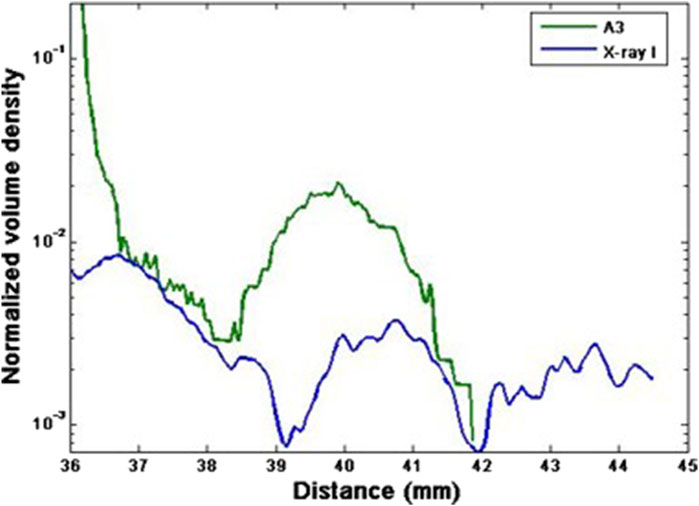
Figure 8. Comparatively spatial volume density distributions between Asay window and X-ray photography.
The comparison of these two profiles revealed qualitative consistency in the characteristic distributions of Interface S1 and Interface S2, indicating the robustness of the data interpretation methods for both diagnostic tools. However, noticeable discrepancies in the density values were observed, primarily due to the significant uncertainties associated with back-calculating volume density from X-ray data. These errors were exacerbated by challenges related to insufficient penetration power which affected the reliability of the derived spatial density distributions. Additionally, AW diagnostics were impacted by edge rarefaction effects that interfered with accurate density measurements. By integrating these three diagnostic approaches, the study effectively overcame individual limitations, offering a more comprehensive and reliable understanding of the ejecta behavior and spatial density distribution.
In shock-loaded lead, density variations within the ejecta play a pivotal role in dictating how the material fragments and disperses after detonation. Localized melting and rapid unloading induce tensile failure, producing thin, irregular layers whose density directly influences subsequent mechanical responses. Denser regions, having undergone less severe deformation, typically form more coherent and faster-moving fragments due to their higher strength and resistance to further break-up [21–23]. In contrast, regions with lower density, associated with extensive melting and tensile failure, tend to generate larger, slower-moving fragments that are more widely dispersed. This heterogeneous density profile ultimately governs the velocity distribution, morphological evolution, and anisotropic properties of the ejecta cloud, underlining that density gradients—shaped by shock compression, melting, and tensile failure—are critical factors in the overall fragmentation and expansion of detonation-driven ejecta [24–26].
In summary, this experimental study advances the current state of ejecta diagnostics from metal surfaces under detonation loading by demonstrating the benefits of combining laser interferometry velocimetry (PDV), an improved Asay window (AW), and X-ray imaging. The results from these three techniques not only enhance our understanding of ejecta dynamics but also provide a framework for future quantitative diagnostics under various loading conditions. The innovative combination of these diagnostic tools enables us to assess their respective capabilities in capturing the high-density and low-density characteristics of ejecta. For instance, both X-ray imaging and AW diagnostics effectively captured high-density ejecta distributions, whereas PDV provided crucial insights into the velocity profiles of high-speed, low-density ejecta. This comprehensive approach addresses the limitations of previous diagnostic methods, such as LANL probes, which focused mainly on low-density ejecta and could not fully characterize the dynamics of dense, fast-moving ejecta particles.
Furthermore, the spatial volume density distribution of high-density ejecta, derived indirectly through data processing of AW and X-ray measurements, showed a high degree of consistency, thus providing a reliable basis for quantitative analysis. These findings contribute significantly to the validation of dynamic failure models for low-melting-point metals, such as lead, under shock loading. The insights gained from this study also provide valuable reference data for engineering applications where material ejection under high strain rates is critical, such as in protective design, blast mitigation, and material failure analysis. Overall, the results of this study offer a novel experimental framework for ejecta analysis, demonstrating the benefits of a synergistic approach that integrates multiple diagnostic techniques. This not only enhances the reliability and accuracy of ejecta characterization but also paves the way for more comprehensive studies on shock-induced material fragmentation, thereby contributing to both fundamental research and practical engineering applications in the field of high-strain-rate material behavior.
To further contextualize these findings, we here discuss the main strengths of this integrated diagnostic approach, as well as its limitations, and how it differs from prior research. One distinct advantage of this study lies in the synergistic use of PDV, the improved Asay-F window, and high-speed X-ray imaging, collectively providing a comprehensive dataset that captures both high-density and low-density ejecta with higher accuracy. Compared to previous studies that typically relied on single or dual diagnostic techniques, our method extends the density coverage and cross-verification capability, thereby enhancing the reliability of velocity profiles and spatial distributions.
Additionally, the spherical shock wave design enabled by the centrally initiated detonator offers a more realistic representation of multi-layer fragmentation and spallation, which can be overlooked under purely planar loading conditions. Nevertheless, limitations also exist. First, the 1 MV X-ray source used in this study has limited penetration when dealing with very dense material regions, potentially causing underestimation of deeper ejecta densities. Second, the complex arrangement of multiple diagnostics, along with edge rarefaction effects in the Asay window, can introduce uncertainties in data interpretation. Despite these challenges, our multi-tool integration effectively addresses individual diagnostic shortcomings, and provides a broader density range assessment than other similar studies. This distinction supports more robust interpretations of shock-induced fragmentation in low-melting-point metals, pushing forward both experimental methodologies and theoretical understanding of dynamic failure processes.
5 Statement of Significance
This study represents a significant advancement in ejecta diagnostics under explosive conditions by combining photonic Doppler velocimetry (PDV), an improved Asay-F window, and high-speed X-ray imaging. Accurate measurement of both high-density and low-density ejecta has long been a challenge in metal fragmentation studies, especially for low-melting-point metals like lead. Traditional diagnostic methods often face issues such as insufficient spatial resolution or interference effects, limiting their effectiveness. By integrating PDV, X-ray, and Asay window diagnostics, this work provides a comprehensive solution to accurately capture ejecta behavior, revealing detailed fragmentation dynamics previously inaccessible to single-method approaches. The originality of this approach lies in its ability to synergistically use complementary diagnostics, providing robust data for understanding ejecta dynamics across different density levels. The study contributes critically to the validation of metal dynamic failure models, offering new insights that are essential for applications in high-strain-rate scenarios, including aerospace, defense, and protective material design. The findings set a new benchmark for experimental methodologies in shock-induced material fragmentation, significantly advancing the capabilities in material science and improving our ability to design materials for extreme conditions.
Data availability statement
The original contributions presented in the study are included in the article/supplementary material, further inquiries can be directed to the corresponding authors.
Author contributions
DX: Writing-original draft, Writing – review and editing, Project administration, Software, Validation. HK: Project administration, Software, Validation, Writing – review and editing. LQ: Data curation, Formal Analysis, Writing – review and editing. HC: Data curation, Investigation, Software, Writing – review and editing. TT Writing – review and editing, Formal Analysis, Funding acquisition, Resources. GR: Writing – review and editing, Funding acquisition, Resources. YC: Writing – review and editing, Funding acquisition, Resources.
Funding
The author(s) declare that financial support was received for the research and/or publication of this article. This work was supported by the National Natural Science Foundation of China (No. 11872346, 12372369, 11932018).
Conflict of interest
The authors declare that the research was conducted in the absence of any commercial or financial relationships that could be construed as a potential conflict of interest.
Generative AI statement
The authors declare that Gen AI was used in the creation of this manuscript. AI was used for syntax modification.
Publisher’s note
All claims expressed in this article are solely those of the authors and do not necessarily represent those of their affiliated organizations, or those of the publisher, the editors and the reviewers. Any product that may be evaluated in this article, or claim that may be made by its manufacturer, is not guaranteed or endorsed by the publisher.
References
1. Asay J, Mix L, Perry F. Ejection of material from shocked surfaces. Appl Phys Lett (1976) 29:284–7. doi:10.1063/1.89066
2. Buttler WT, Zellner MB, Olson RT, Rigg PA, Hixson RS, Hammerberg JE, et al. Dynamic comparisons of piezoelectric ejecta diagnostics. J Appl Phys (2007) 101. doi:10.1063/1.2712177
3. Murr L. Metallurgical effects of shock and high-strain-rate loading. Elsevier Appl Sci Publishers, Mater High Strain Rates (1987) 1–46. doi:10.1201/9781003573661
4. Keinigs RK, Atchison WL, Anderson WE, Bartsch RR, Faehl RJ, Flower-Maudlin EC, et al. Material science experiments on the Atlas facility. PPPS-2001 pulsed power plasma science 2001. In: 28th IEEE International Conference on Plasma Science and 13th IEEE International Pulsed Power Conference. Digest of Papers (Cat. No. 01CH37251); 17-22 June 2001; USA. IEEE 1. p. 356–60. doi:10.11858/gywlxb.2009.06.012
5. Zellner M, Grover M, Hammerberg JE, Hixson RS, Iverson AJ, Macrum GS, et al. Effects of shock-breakout pressure on ejection of micron-scale material from shocked tin surfaces. J Appl Phys (2007) 102. doi:10.1063/1.2752130
6. Kaul A, Ivanovsky AV, Atchison WL, Petrukhin AA, Duday PV, Griego JR, et al. Damage growth and recollection in aluminum under axisymmetric convergence using a helical flux compression generator. J Appl Phys (2014) 115. doi:10.1063/1.4861411
7. Buttler W, Hixson RS, King NSP, Olson RT, Rigg PA, Zellner MB, et al. Method to separate and determine the amount of ejecta produced in a second-shock material-fragmentation event. Appl Phys Lett (2007) 90. doi:10.1063/1.2722676
8. Buttler WT, Oró DM, Mariam FG, Saunders A, Andrews MJ, Cherne FJ, et al. (2024). Explosively driven two-shockwave tools with applications. Journal of physics: conference series. United Kingdom: IOP Publishing. >500 (11), 112014.
9. Zhang S, Liu C, Li Q, Hua J, Liu Q. A research study on the spallation strength of LY12 aluminum under the pre-compression condition. Sci China Phys Mech Astron (2012) 55:505–13. doi:10.1007/s11433-012-4631-y
10. Andriot P, Chapron P, Lambert V, Olive F. Shock waves in condensed matter 1983 277-280. Elsevier (1984).
11. Zellner M, McNeil WV, Hammerberg JE, Hixson RS, Obst AW, Olson RT, et al. Probing the underlying physics of ejecta production from shocked Sn samples. J Appl Phys (2008) 103. doi:10.1063/1.2939253
12. Zellner M, Vogan McNeil W, Gray GT, Huerta DC, King NSP, Neal GE, et al. Surface preparation methods to enhance dynamic surface property measurements of shocked metal surfaces. J Appl Phys (2008) 103. doi:10.1063/1.2906107
13. Buttler W, Oró DM, Olson RT, Cherne FJ, Hammerberg JE, Hixson RS, et al. Second shock ejecta measurements with an explosively driven two-shockwave drive. J Appl Phys (2014) 116. doi:10.1063/1.4895053
14. Holtkamp DB, Clark DA, Ferm EN, Gallegos RA, Hammon D, Hemsing WF, et al. (2004). “A Survey of High Explosive-Induced Damage and Spall in Selected Metals Using Proton Radiography,” in AIP Conference Proceedings, >706(1), 477–482. American Institute of Physics.
15. Holtkamp DB, Clark DA, Crain MD, Furnish MD, Gallegos CH, Garcia IA, et al. (2004). “Development of a Non-Radiographic Spall and Damage Diagnostic,” in AIP Conference Proceedings, American Institute of Physics. 706 (1), 473>–476.
16. Chen Y, Hong R, Chen H, Tang T, Ren G. An improved Asay window technique for investigating the micro-spall of an explosively-driven tin. Rev Scientific Instr (2017) 88:013904. doi:10.1063/1.4973699
17. Cagliostro D, Warnes R, Johnson N, Fujita R (1987). Spall measurements in shock-loaded hemispherical shells from free-surface velocity histories.
18. Monfared S, Oró DM, Grover M, Hammerberg JE, LaLone BM, Pack CL, et al. Experimental observations on the links between surface perturbation parameters and shock-induced mass ejection. J Appl Phys (2014) 116. doi:10.1063/1.4891449
19. Monfared SK, Buttler WT, Frayer DK, Grover M, LaLone BM, Stevens GD, et al. Ejected particle size measurement using Mie scattering in high explosive driven shockwave experiments. J Appl Phys (2015) 117. doi:10.1063/1.4922180
20. Yan YE, Wei W, Zuo-You LI, Jian LI, Zhen-Qing L, Jie Z, et al. High-speed photography and pulsed in-line holography diagnostics of microjet. 高压物理学报 (2009) 23 (6):471–475.
21. Tsujido S, Arakawa M, Suzuki AI, Yasui M. Ejecta velocity distribution of impact craters formed on quartz sand: effect of projectile density on crater scaling law. Icarus (2015) 262:79–92. doi:10.1016/j.icarus.2015.08.035
22. Xu M, Shao J, Song W, Tang E. Effect of the interval between two shocks on ejecta formation from the grooved aluminum surface. Defence Technology (2024) 33:147–59. doi:10.1016/j.dt.2023.07.021
23. Grady D. The spall strength of condensed matter. J Mech Phys Sol (1988) 36:353–84. doi:10.1016/0022-5096(88)90015-4
24. Chen J, Mathaudhu S, Thadhani N, Dongare A. Correlations between dislocation density evolution and spall strengths of Cu/Ta multilayered systems at the atomic scales: the role of spacing of KS interfaces. Materialia (2019) 5:100192. doi:10.1016/j.mtla.2018.100192
25. Xu K, Lu Y. Numerical simulation study of spallation in reinforced concrete plates subjected to blast loading. Comput and structures (2006) 84:431–8. doi:10.1016/j.compstruc.2005.09.029
Keywords: explosion detonation, metal spallation, x-ray imaging, photonic doppler velocimetry, asay window
Citation: Xu D, Kang H, Qiao L, Chen H, Tang T, Ren G and Chen Y (2025) Integrated diagnostic analysis of ejecta from lead with micro-defects under detonation loading. Front. Phys. 13:1514389. doi: 10.3389/fphy.2025.1514389
Received: 23 October 2024; Accepted: 23 April 2025;
Published: 12 May 2025.
Edited by:
Engin Deligoz, Aksaray University, TürkiyeCopyright © 2025 Xu, Kang, Qiao, Chen, Tang, Ren and Chen. This is an open-access article distributed under the terms of the Creative Commons Attribution License (CC BY). The use, distribution or reproduction in other forums is permitted, provided the original author(s) and the copyright owner(s) are credited and that the original publication in this journal is cited, in accordance with accepted academic practice. No use, distribution or reproduction is permitted which does not comply with these terms.
*Correspondence: Guowu Ren, Z3dyZW5pZnBAMTYzLmNvbQ==; Yongtao Chen, MTM0MDQwMDUxOTBAMTYzLmNvbQ==