Abstract
Introduction:
The development of digital technology and upgrading of consumer service demand have led to profound changes in the supply chain, gradually forming a supply chain ecosystem and transforming inter-enterprise cooperation into ecological cooperation. Amidst complex international landscapes and industrial transformation, the role of government has garnered significant attention. Thus, enhancing ecological cooperation in the supply chain during the new development stage and clarifying the government’s role constitute critical research topics.
Methods:
We analyze strategies of governments, suppliers, and manufacturers using a three-party evolutionary game model. The ideal event is defined within this model, and key influences on the dynamic evolutionary process are examined. A sensitivity analysis of selected parameters is rigorously conducted.
Results:
Our findings demonstrate that: (1) The government significantly promotes ecological cooperation among supply chain enterprises and can adjust system equilibrium by modulating the subsidy coefficient and regulatory costs. (2) Greater eco-sensitivity enhances advantages in eco-cooperation. (3) Establishing reasonable compensation fees between enterprises ensures effective eco-cooperation. (4) A company’s cost investment in eco-cooperation critically influences its engagement in such collaboration.
Discussion:
The study confirms the government’s pivotal role in facilitating supply chain ecological cooperation through policy instruments. Eco-sensitivity, inter-firm compensation mechanisms, and cost investments are identified as decisive factors for successful collaboration. Sensitivity analysis further validates the robustness of these parameters in shaping evolutionary outcomes.
1 Introduction
Industry 4.0 has had profound economic and social impacts on the society [1]. Supply chain changes have been prompted by the emergence of new digital technologies such as big data, artificial intelligence, and cloud computing. In addition, supply networks are facing greater challenges than ever before as a result of the COVID-19 pandemic [2]. The concept of supply chain ecosystems is increasingly attracting the attention of scholars worldwide [3]. Supply chain members are gradually breaking away from the original linear up- and downstream relationships and developing into a supply chain ecosystem. The supply chain ecosystem is similar to the business ecosystem in that each member of the system is closely related to the ecosystem as a whole. The system is a community composed of a large number of mutually supportive and interdependent supply chains that are closely connected and collaborate in mutually beneficial partnerships for joint value creation [4]. Ecological cooperation has emerged as a new model of collaboration between companies and is now widely applied.
The government, which is a vital component of both the economy and society, has a significant influence on how policies are made and how the business climate is regulated. Governments worldwide are making continuous efforts to improve the competitiveness of their supply chain companies. A number of policies have been introduced in recent years to promote the development of the supply chain in China.
Under the new reality of supply chain development and the government’s policy phase-out, we propose a specific model that defines the dynamic interaction between suppliers, manufacturers, and governments where suppliers and manufacturers face strategies (ecological or non-ecological cooperation) and governments also have an either/or strategy (supervision or non-supervision). The game between subjects in this study must consider time because of the subjects' behavior. To investigate the unilateral evolutionarily stable strategy (ESS) and the ESS of systems, we construct a three-party evolutionary game model and use evolutionary game theory as an analysis tool. Then, we design an ideal scenario and examine its affecting variables in light of the decision-making behavior. This study contributes to the development of policies that organizations and administrations can implement to enhance and advance their supply chains.
This study will address the following key issues. (1) Is there a game equilibrium point in this model, and what does the evolutionary path look like? (2) What are the key factors that influence the subjects' decisions? (3) What is the role of the government in the model, and what policies can the government adopt to facilitate ecological cooperation among enterprises?
The article is structured as follows: Section 2 reviews the literature, Section 3 builds the evolutionary game model, Section 4 analyzes the model, Section 5 provides numerical simulations, and Section 6 presents conclusions and implications.
2 Literature review
This paper aims to determine how to promote eco-cooperation among supply chain enterprises and how the government can foster such cooperation through active regulation by constructing a three-way evolutionary game model. The development of theories such as business ecosystems and supply chain ecosystems provides a reference and expands the possibilities for ecological cooperation among supply chain enterprises. This literature review will address the following aspects.
2.1 Evolutionary game model of a supply chain
Evolutionary game theory originated from population biology. In contrast to classic game theory, it integrates dynamic evolution process analysis with bounded rationality among players. Evolutionary game theory concentrates on the evolutionary process and evolutionary stable states in the model. Given its alignment with real-world dynamics, it has become an important research tool for the study of dynamic game problems. It has been widely applied to studying various aspects of the supply chain. First, regarding the number of game subjects, evolutionary games in the supply chain are mainly studied as two- and three-party games. Xiong et al. (2023) used the evolutionary game model to analyze the stable evolutionary strategies of logistics enterprises in collaborative transportation applying blockchain technology [5]. Long et al. (2021) used a three-party evolutionary game model to study green sensitivity in the green supply chain [6]. Second, we focus on the use of evolutionary game for cooperation among supply chain members. Yu et al. (2022) built an evolutionary game model based on the relationship between agricultural product suppliers and urban residents in the financing system [7]. Gu et al. (2019) built an evolutionary game theory model to examine NREI company cooperation in reverse logistics operations [8]. Huang et al. (2023) constructed a tripartite evolutionary game model of government, dealers, and ginger farmers under asymmetric price transmission and explored the impact of the target price insurance on the stabilization strategy of the tripartite evolutionary game [9]. Third, we consider the case of government regulation in the study of supply chain evolutionary games. Sun et al. (2019) investigated a two-tier supply chain’s green investment plan for manufacturers and material suppliers under a government subsidy structure [10]. Mahmoudi, R. and Rasti-Barzoki, M. (2018) employed evolutionary game theory to simulate how supply chain participants might perform under various government scenarios [11]. Cheng and Cheng (2023) used prospect theory and mental accounting theory to analyze the decision-making behavior of the public and private sectors in PPP project supervision, revealing the impact of factors like perceived costs, penalties, reference points, and risk exposure on their proactive behavior [12].
2.2 Supply chain ecosystem and ecological cooperation
There have been recent significant advances in digital supply chain innovations which have been driven by the rapid evolution of technologies such as artificial intelligence (AI), blockchain, the internet of things (IoT), and digital twins. These innovations have been extensively studied in high-impact journals, focusing on their potential to enhance supply chain resilience, sustainability, and operational efficiency. One major area of research has been the integration of AI and machine learning (ML) for predictive analytics and decision-making. For example, Zhang et al. (2024) demonstrated how AI-powered demand forecasting models could significantly reduce uncertainties in volatile markets, particularly in the post-pandemic era [13]. The adoption of digital twins has gained momentum, with researchers exploring their potential for simulating and optimizing supply chain operations. For instance, Ivanov et al. (2024) developed a digital twin-based model for supply chain risk management which allows firms to simulate disruptions and test mitigation strategies in a virtual environment [14]. Sustainability remains a critical theme, with studies focusing on how digital innovations can support green supply chain initiatives. A notable contribution by Kumar et al. (2024) examined the use of IoT and big data analytics to monitor and reduce the environmental impact of supply chain activities, particularly in the manufacturing sector [15]. Jacobides, M. G. et al. (2018) expanded existing research by analyzing ecosystem development mechanisms and their distinctions from traditional governance structures [16]. According to Ron Adner, the ecosystem is the multilateral coalition of parties necessary for a focal value offer to become a reality [17]. Business ecosystems serve as a strategic framework for interorganizational collaboration, driving competitive advantage and innovation [18]. At present, academic research on business ecosystems is gradually maturing, and more scholars are beginning to focus on the field of supply chain ecosystems. From a theoretical research perspective, David Jr and Ketchen J et al. (2014) described a supplier ecosystem as a collection of interdependent and coordinated businesses that face some of the same adaptive difficulties and work together to develop and maintain a sourcing base that gives them a competitive edge [19]. Letaifa, S. B. (2014) revealed the difficult transition from the supply chain to the ecosystem, using the multidimensional definition of value-ecosystemic value and employing lifecycle theory to identify the different stages of the evolution of value-creation and value-capture processes in an ecosystem [20]. Liu et al. (2022) converted evolutionary stable strategies (ESSs) into the ideal ESS by adjusting certain parameters, and they provided suggestions for the platform to induce its supplier to choose ecological cooperation [21]. From a practical application perspective, Liu et al. (2021) investigated ecological cooperation patterns between logistics platforms and suppliers through a business ecosystem lens, employing evolutionary game theory to model multi-period interactions [22]. Yan et al. (2022) examined the elements that impact the adoption of the circular supply chain in the smart logistics ecological chain using a case study approach with four chosen instances, identifying five such factors [23].
2.3 Summary of literature review
In summary, evolutionary game analysis has emerged as a powerful tool in supply chain research, offering insights into dynamic interactions and decision-making processes among various stakeholders. Depending on the research focus, evolutionary game models have been applied to study the behavior of suppliers, manufacturers, platforms, consumers, and governments. A significant portion of the reviewed literature explores cooperation mechanisms between suppliers and manufacturers, highlighting the importance of collaborative strategies in enhancing supply chain efficiency and sustainability. Additionally, several studies have incorporated the role of government policies, examining how regulatory interventions, subsidies, and incentives influence the strategic choices of supply chain participants.
In recent years, the concept of supply chain ecosystem has gained traction among scholars, reflecting a shift from traditional linear supply chain models to more interconnected and collaborative frameworks. Ecological cooperation, characterized by symbiotic relationships and value co-creation among ecosystem participants, has become a cornerstone of supply chain management in the digital economy. This form of cooperation introduces new dynamics such as shared resources, joint innovation, and collective resilience, which distinguish it from conventional inter-enterprise collaboration. Despite these theoretical advancements, the literature remains fragmented in systematically modeling ecological cooperation within these ecosystems.
To address this gap, this article employs a three-party evolutionary game model involving suppliers, manufacturers, and the government. This framework not only captures the dynamic interactions among these key stakeholders but also integrates the unique features of ecological cooperation, such as resource sharing, innovation synergy, and regulatory influence. By grounding the model in the theoretical foundations of supply chain ecosystems, this study aims to provide a nuanced understanding of how ecological cooperation can be fostered and sustained in the context of evolving market and regulatory environments. Furthermore, the inclusion of the government as a strategic player allows for an exploration of how policy interventions can shape the trajectory of ecological cooperation, offering valuable insights for both academia and practice.
3 Evolutionary game model
3.1 Problem descriptions and basic assumptions
This study investigates factors affecting ecological cooperation among supply chain enterprises and government supervision mechanisms, focusing on a two-tiered supply chain composed of upstream suppliers and downstream manufacturers. The government will supervise cooperation due to data security and the stable operation of the market. The two-tiered supply chain comprises populations of upstream suppliers and downstream manufacturers, alongside local governments with finite regulatory capacity. Evolutionary game theory analyzes time-dependent dynamics and incorporates players’ learning mechanisms in strategic interactions. Building on evolutionary game theory, this study investigates the interaction mechanisms of tripartite behavioral strategies.
Assumption 1The three participants—government, upstream suppliers, and downstream manufacturers—are boundedly rational, learning from each other’s strategic decisions and gradually altering their behavioral patterns until reaching equilibrium.To take advantage of open innovation opportunities, organizations are changing their strategy, emphasis, and competencies from firm centricity to ecosystems [24]. The behavior of firms transforms from traditional competitive to more social and ecosystemic [20]. In this study, suppliers and manufacturers can choose to engage in ecological cooperation or not. If the suppliers and manufacturers both choose “non-ecological cooperation”, the profits of the suppliers and manufacturers are and , respectively. When the suppliers and manufacturers choose “ecological cooperation,” they need to pay extra costs (,1: suppliers 2: manufacturers) because of the adjustment of the company’s own business due to the cooperation, and these costs will cut their final profits. Enterprises face both opportunities (e.g., technological innovations) and risks (e.g., market volatility) in ecological cooperation. The net benefits comprise two components: (1) innovation gains from intra-supply chain collaboration and (2) risk-adjusted returns from enhanced market competitiveness. We assume that the total generated ecological resources are (including sharing data, information, technology, and others) when enterprises choose “eco-cooperation.” The innovation benefits will be affected by the ecological sensitivity of enterprises (,1: suppliers 2: manufacturers), which represents the ability of companies to transform shared resources to their benefit through ecological cooperation. The risk-based returns () will be shared by the suppliers and manufacturers, and the allocation coefficient is .If only one party (either suppliers or manufacturers) actively engages in ecological cooperation, the passive party may obtain speculative gains through free-riding but is contractually obligated to compensate the active party (amount F) for cost subsidies.
Assumption 2We assume that the party not cooperating ecologically has access to all the data resources shared by the other party at the time of cooperation, but the speculative gain is determined by the speculative coefficient due to limitations in resources, technology, hardware equipment, etc. The cumulative gain is (, 1: suppliers 2: manufacturers) and .The two pure tactics available to governments are supervision and non-supervision. In the case of supervision, governments set a subsidy coefficient () for the extra costs incurred by enterprises’ eco-cooperation and an integrated penalty () for speculative data theft and information leakage, which is also widely used in the literature [12, 25]. These need to pay a certain supervision cost () by making policies. In return, supervision can bring extra benefits () to governments, including economic benefits and social reputation.
Assumption 3Eco-collaboration is characterized by joint value creation and aims at maximizing overall benefits, although, in practice, a firm’s emphasis on value capture may hinder ecosystemic value creation [17]. This study assumes that enterprises aim to maximize their revenues. Governments pursue social and economic benefits, including green development and industrial upgrading. Table 1 lists the corresponding payoff parameters for the three parties, and the interactive behavioral strategies and game relationships among the three parties are illustrated in Figure 1.The assumptions in this study encapsulate key characteristics of contemporary supply chain ecological cooperation: the bounded rationality of participants mirrors the gradual, trial-and-error strategic adjustments observed in industries undergoing sustainability transitions (e.g., automotive manufacturers phasing in circular economy initiatives); the cost-sharing and speculative penalty mechanisms align with practical arrangements in sectors like electronics, where supply chain contracts enforce environmental cost allocation; the government’s hybrid subsidy–penalty framework reflects common structures in global green manufacturing incentive programs (e.g., proportional subsidies for eco-innovation coupled with tiered penalties for regulatory violations); the differentiation in ecological sensitivity coefficients captures real-world disparities in technological absorption capacity across industries (e.g., varying efficiency in adopting digital green technologies between high-tech and traditional manufacturing). These design elements enable the model to balance theoretical abstraction with empirical relevance, particularly in addressing modern challenges such as collaborative innovation and data security governance in digitally-driven supply chains.
TABLE 1
| Parameters | Definition |
|---|---|
| Initial benefits of enterprises (1: upstream suppliers 2: downstream manufacturers) | |
| Additional market ecological benefits that will be allocated by the upstream suppliers and downstream manufacturers | |
| Allocation coefficient of additional market ecological benefits by upstream suppliers () | |
| Ecological sensitivity of the enterprise in supply chain 1: upstream suppliers 2: downstream manufacturers) | |
| Total generated ecological resources when enterprises choose “eco-cooperation” | |
| Government’s subsidy coefficient for the costs incurred by enterprises when they choose the “eco-cooperation” strategy () | |
| Extra costs of enterprises choosing “eco-cooperation” (1: upstream suppliers 2: downstream manufacturers) | |
| Extra costs caused by formulating supervision policies | |
| Initial benefits for government when enterprises choose “eco-cooperation” both | |
| Initial benefits for government when upstream suppliers choose “eco-cooperation” and downstream manufacturers choose “non-ecological cooperation” | |
| Initial benefits of the government when upstream suppliers choose “non-ecological cooperation” and downstream manufacturers choose “eco-cooperation” | |
| Initial benefits for government when enterprises choose “non-ecological cooperation” both | |
| Extra benefits for government of supervision | |
| Compensation fee paid by the passive company to the active company when active collaboration is unilateral | |
| Speculative return coefficient (1: upstream suppliers 2: downstream manufacturers) | |
| D | Penalty from government when enterprises default on cooperation |
Definitions of relevant parameters.
FIGURE 1
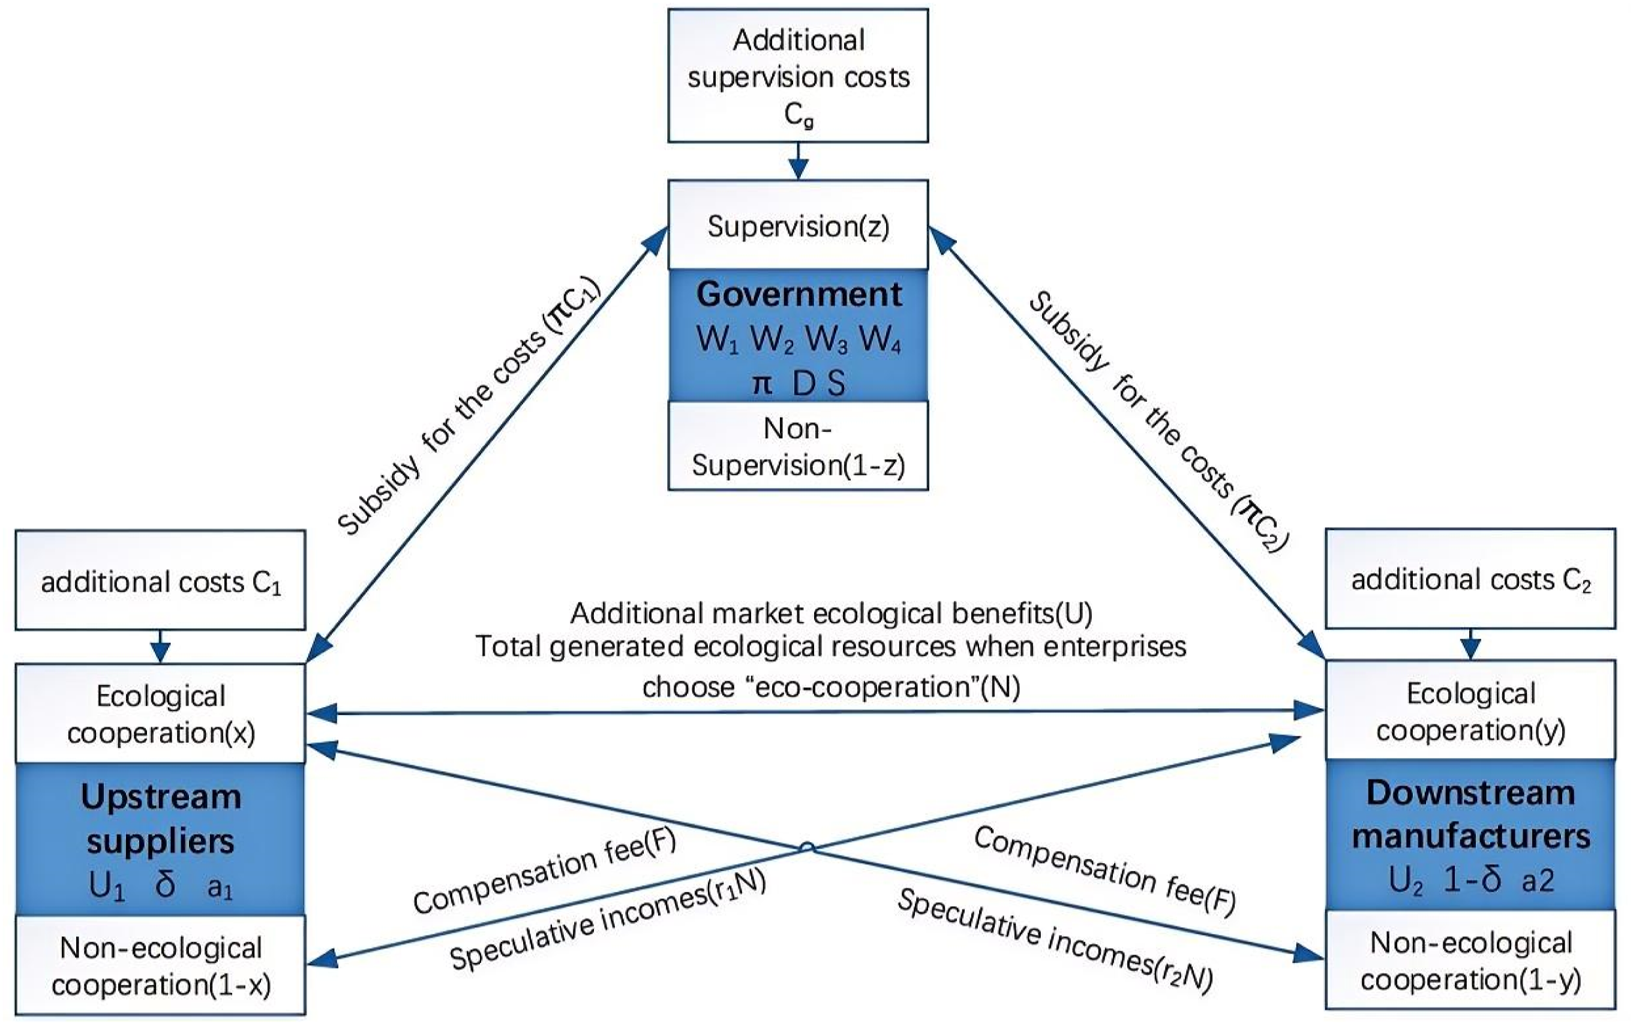
Interaction strategy behavior and game relationships among payoffs for the three parties.
3.2 Payoff of the three parties
We let and represent the percentages of the suppliers that adopt the “ecological cooperation” strategy and the “non-ecological cooperation” strategy, respectively. Similarly, the proportions of manufacturers adopting the “ecological cooperation” strategy and the “non-ecological cooperation” strategy are and , respectively. In addition, and are the proportions of the governments that choose supervision and non-supervision, respectively.
According to these descriptions, there are eight strategy profiles; Table 2 displays a reward matrix for all players using various strategies.
TABLE 2
| Parties | governments | ||||
|---|---|---|---|---|---|
| Supervision | Non-supervision | ||||
| Suppliers | Ecological cooperation | Manufactures | Ecological cooperation |
|
|
| Non-ecological cooperation |
|
|
|||
| Suppliers | Non-ecological cooperation | Manufactures | Ecological cooperation |
|
|
| Non-ecological cooperation |
|
|
|||
Payoff matrix of the three parties.
4 Evolutionary game model analysis
4.1 Equilibrium analysis of the evolutionary game model
The expected benefits of the suppliers adopting the “ecological cooperation” and “non-ecological cooperation” strategies are set as (Equation 1) and (Equation 2), respectively, and the average expected payoff is set as (Equation 3).
Similarly, the expected payoffs when the manufacturers choose the ecological cooperation and the non-ecological cooperation strategies are set as (Equation 4) and (Equation 5), respectively, and the average expected payoff is set as (Equation 6).
In addition, the expected payoffs of the governments selecting the “supervision” and “nonshortision” strategies are set as (Equation 7) and (Equation 8), respectively, and the average expected payoff is set as (Equation 9).
According to Assumption 1, the chances , , and of the suppliers, manufacturers and governments adopting the “ecological cooperation,” “ecological cooperation,” and “supervision” strategies change dynamically over time . As a result, the derivative of their respective timing probability can be used to mathematically define the growth rate of the three strategies—. The replicator dynamics equations of the suppliers, manufacturers, and the government are given as follows (Equations 10–12):
4.2 Stability analysis of the three-party evolutionary game model
4.2.1 Progressive stability analysis of unilateral behavior strategy
Given the characteristics of ESS and the stability theorem for differential equations, if the derivative of the replication dynamic equation at the equilibrium point is less than 0 () and , the evolutionary entity has reached an evolutionarily stable strategy.
Proposition 1
(1) If , then no matter what the value is, , the suppliers’ strategies will not change over time, and all behavioral tactics are consistent.
(2) If and , then we can obtain two stable points and , which means that the suppliers’ strategy will be stabilized in a state of strict ecological/non-ecological cooperation.
Let
, and
; therefore,
is a linear increasing function of
,
1. When , ; at this time, and . Therefore, is an ESS, and the suppliers tend to choose ecological cooperation.
2. When at this time, and . Therefore, is an ESS, and the suppliers tend to choose non-ecological cooperation.
FIGURE 2
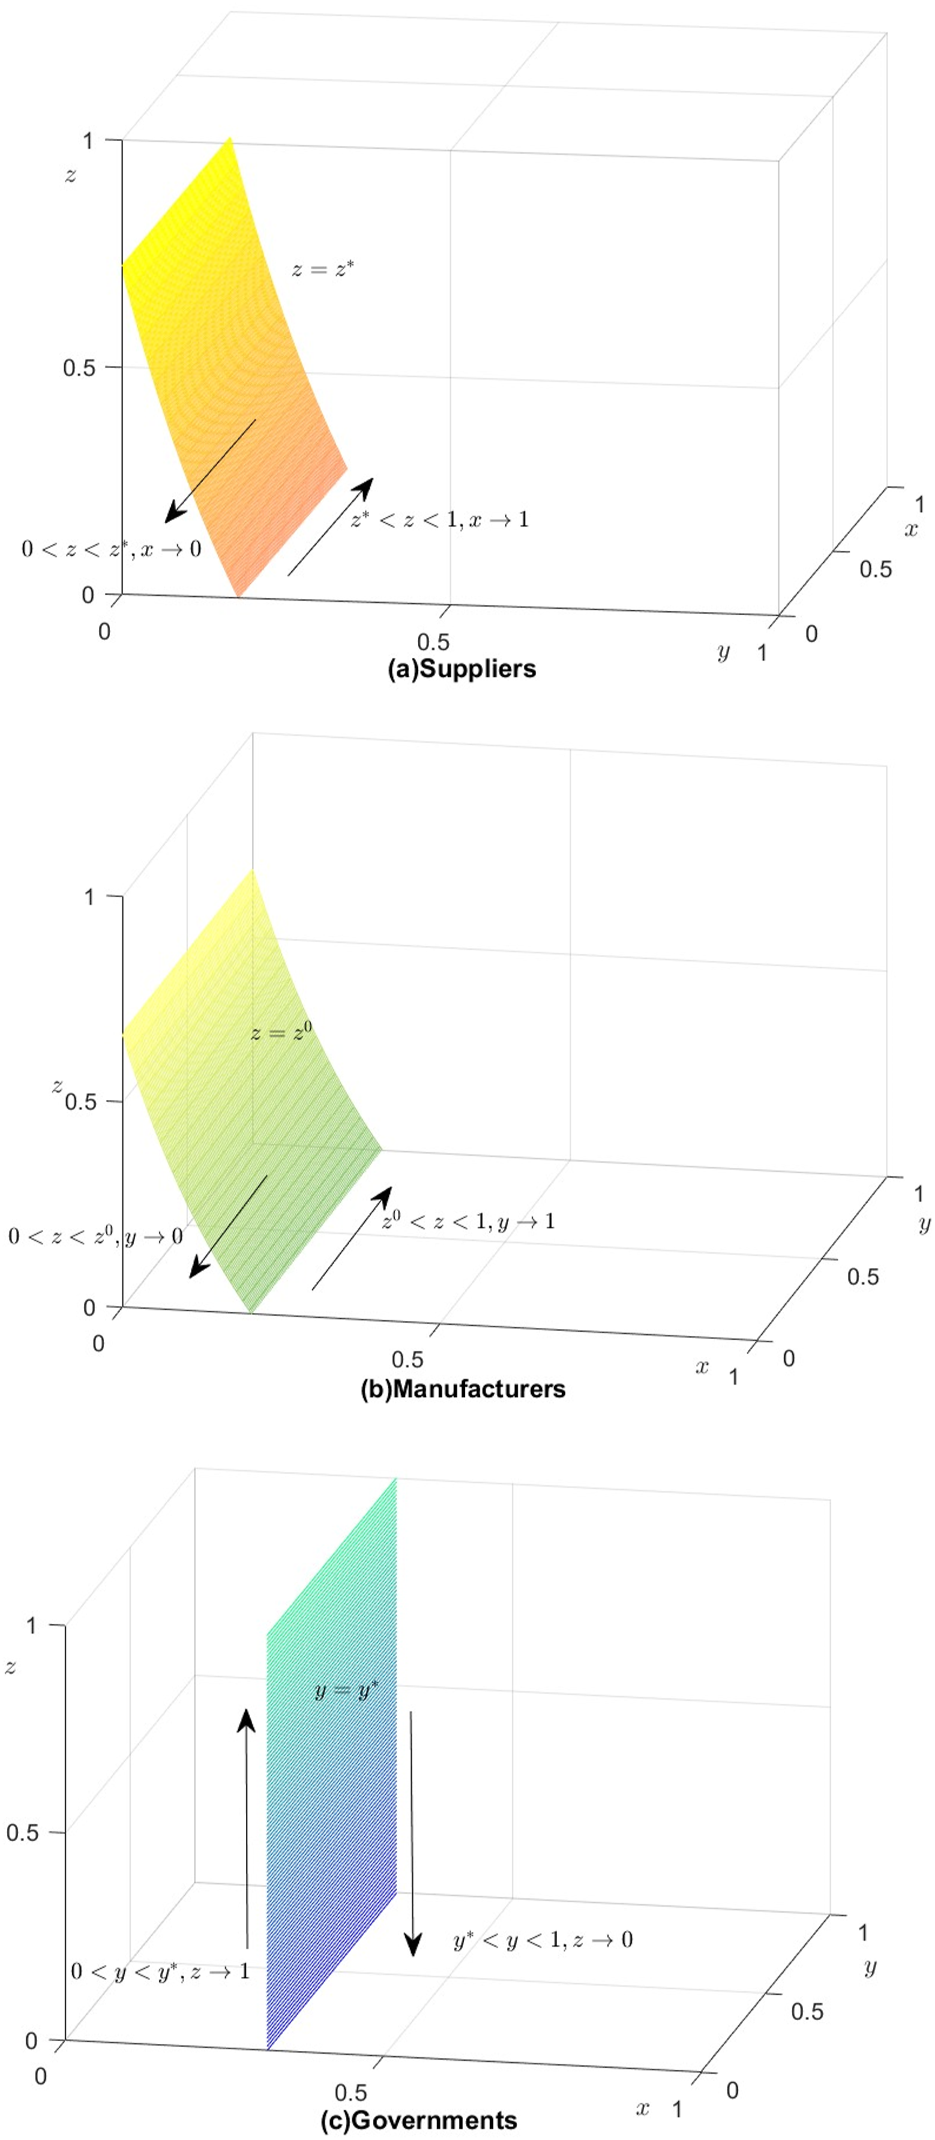
(a) Suppliers. (b) Manufacturers. (c) Governments. The replicator dynamics phase diagram of the three parties.
Proposition 2
(1) If , then no matter what is, , and the manufacturers’ strategies will not change with the evolution of time, and all behavior strategies are stable.
(2) If and , then we can obtain two stable points and , which means that the manufacturers’ strategy will be stabilized in a state of strict ecological/non-ecological cooperation.
Let
, and
; therefore,
is a linear increasing function of
,
1. When , ; at this time, and . Therefore, is an ESS, and the manufacturers tend to choose active cooperation.
2. When and . Therefore, is an ESS, and the manufacturers tend to choose passive cooperation.
Proposition 3
(1) If , then no matter what is, , and the governments’ strategies will not change with the evolution of time, and all behavior strategies are stable.
(2) If and , then we can obtain two stable points and , which means that the government’s strategy will be stabilized in a state of strict supervision/non-supervision.
Let
, and we know
, so
; therefore,
is a linear decreasing function of
,
1. When , at this time, and . Therefore, is an ESS, and governments tend to choose non-supervision.
2. When , at this time, and . Therefore, is an ESS, and governments tend to choose supervision.
4.2.2 Calculation of equilibrium points of the tripartite evolutionary game model
The replicator dynamics equations of the three parties under their respective strategies have been expressed, and to obtain a stable strategy for the dynamic system, we let three formulas equal 0:
This means that the system will no longer evolve, and we can obtain eight pure strategies, which are and six mixed strategies, which are (), (), (), (), (), and (). Because evolutionarily stable strategies (ESSs) emerge only in pure strategies [26], mixed strategies are rejected first, which is widely used by scholars [12, 27].
The stability of the equilibrium points can be obtained by analyzing the Jacobi matrix [28]. According to the stability analysis of Lyapunov, the details of the Jacobi matrix are as follows (Equation 13):
Each element of the Jacobi matrix can be expressed as follows (Equation 14):
Only the eight pure points are considered since the equilibrium solution of the tripartite evolutionary game is a stringent Nash equilibrium [27]. Under different local equilibrium points, the eigenvalues of the Jacobi matrix are shown in Table 3. For the three-party evolution game, according to the Jacobi matrix’s local stability criterion, if and only if the eigenvalues are all less than 0 is the equilibrium point a stable point; when the eigenvalues are all more than 0, then the equilibrium point is an unstable point; when one or two eigenvalues are more than 0, then the equilibrium point is a saddle point. We need to determine the positive and negative values of all eigenvalues.
TABLE 3
| Equilibrium points | Eigenvalue 1 | Eigenvalue 2 | Eigenvalue 3 |
|---|---|---|---|
Eigenvalues of the Jacobi matrix.
According to Assumptions 2 and 3, we know that if the suppliers and manufacturers choose to eco-cooperate actively, then for the suppliers, its innovation benefits can outweigh its speculative gains (i.e., ), and for the manufacturers, . Because of the numerous parameters selected, we are unable to determine the positivity or negativity of the majority of the eigenvalues of the equilibrium points in Table 4, and we are unable to assess the evolutionary stability approach using Fridman’s stability judgment method for the Jacobi matrix [28]. Additionally, the Jacobi matrix has opposite eigenvalues, and these may interfere with each other. For example, makes it impossible for to be an ESS simultaneously. As a result, none of the three participants' behavioral methods had a completely stable central point [27]. It can be used in conjunction with computer simulation to assess the alliance’s multiple players' evolutionary stability.
TABLE 4
| Equilibrium points | Eigenvalues | Eigenvalue symbol | Stability |
|---|---|---|---|
|
|
Unsure Unsure Unsure |
Uncertain | |
|
|
Unsure Unsure Unsure |
Uncertain | |
|
|
Unsure Unsure Unsure |
Uncertain | |
|
|
Unsure Unsure Unsure |
Uncertain | |
|
|
Unsure Unsure Unsure |
Uncertain | |
|
|
Unsure Unsure Unsure |
Uncertain | |
|
|
Unsure Unsure Unsure |
Uncertain | |
|
|
Unsure Unsure Unsure |
Uncertain |
Local stability analysis of the equilibrium point.
Proposition 4When and , then is the only ESS point where the suppliers and the manufacturers choose ecological cooperation actively and government supervision, respectively.Proof of Proposition 4.When and we can obtain all of the eigenvalue symbols in Table 5. Only the eigenvalues of are greater than zero, and is the only ESS point. Proposition 4 indicates that when the compensation fees are greater than the costs of the company under the condition that the government subsidizes the cost of the enterprise and the government obtains positive returns, then the evolutionary and stable strategy will be ). The subsidy coefficient is a variable that governments can adjust. The equilibrium condition can also be expressed as . Therefore, we obtain the first conclusion: when the government’s subsidy coefficient can be reasonable enough () under supervision, the suppliers and manufacturers will eventually choose to eco-operate actively, and the government will supervise.
TABLE 5
| Equilibrium points | Eigenvalues | Eigenvalue symbol | Stability |
|---|---|---|---|
|
|
|
Unstable point | |
|
|
|
Saddle point | |
|
|
Unsure |
Saddle point | |
|
|
Unsure |
Saddle point | |
|
|
Unsure |
Saddle point | |
|
|
Unsure |
Saddle point | |
|
|
|
Saddle point | |
|
|
|
ESS |
Local stability analysis of the equilibrium point under the conditions of and .
Proposition 5When and , is the only ESS point where the government does not supervise cooperation, and the suppliers and the manufacturers choose ecological cooperation actively.Proof of Proposition 5When and we can obtain all of the eigenvalue symbols in Table 6. Only the eigenvalues of are greater than zero, and is the only ESS point. Proposition 5 indicates that when the compensation fees are greater than the costs of company under the condition that the government is not involved in regulation, the suppliers and the manufacturers will also choose ecological cooperation, and the evolutionary stable strategy will be . Therefore, we can obtain the second conclusion: when the government does not supervise, suppliers and manufacturers need to negotiate a reasonable compensation fee to guarantee the smooth progress of ecological cooperation.
TABLE 6
| Equilibrium points | Eigenvalues | Eigenvalue symbol | Stability |
|---|---|---|---|
|
|
|
Saddle point | |
|
|
|
Unstable point | |
|
|
Unsure |
Saddle point | |
|
|
Unsure |
Saddle point | |
|
|
Unsure |
Saddle point | |
|
|
Unsure |
Saddle point | |
|
|
|
ESS | |
|
|
|
Saddle point |
Local stability analysis of the equilibrium point under the conditions of and .
5 Numerical simulations of the tripartite evolutionary game
In this section, we use a numerical simulation to observe the progression of the ESS and analyze the impact of parameter variations on tripartite behavioral dynamics in this model. To characterize the evolutionary path, we use MATLAB R2022a to numerically simulate the dynamic evolution trajectory from the initial state to the equilibrium state. With reference to previous studies [10] and repeated discussions with relevant industry experts and scholars, and in an effort to be able to derive generalizable conclusions, we adjusted the initial simulation data. Given the distinct constraint conditions in Propositions 4, 5, we assign two distinct sets of initial parameter values. The parameter values reflect relative rather than absolute magnitudes (Table 7).
TABLE 7
| Cases | ESS | Conditions | Parameters values | |||||||||||||
|---|---|---|---|---|---|---|---|---|---|---|---|---|---|---|---|---|
| Case 1 | and | 0.8 | 0.6 | 6 | 5 | 0.2 | 0.3 | 8 | 5 | 0.5 | 4.5 | 4 | 0.3 | 8 | 1 | |
| Case 2 | and | 0.8 | 0.6 | 6 | 5 | 0.2 | 0.3 | 8 | 5 | 0.5 | 7 | 4 | 0.3 | 2 | 3 | |
Different initial parameter values for satisfying the different conditions.
5.1 The evolutionary trajectories of players
The values for Cases 1 and 2 satisfy the constraints of Propositions 4 and 5, respectively. Figure 3 displays the trends of change for the two scenarios, developed over 50 iterations from various initial strategy combinations. From the simulation results in Figure 3a, it is evident that the system only has one evolutionary stable strategy combination (ecological cooperation, ecological cooperation, supervision) at this time, which is consistent with the conclusion of Proposition 4. Figure 3b shows that the system has only one evolutionary stabilization point (ecological cooperation, ecological cooperation, and non-supervision) under the constraints of Proposition 5, which also verifies the conclusion of Proposition 5.
FIGURE 3
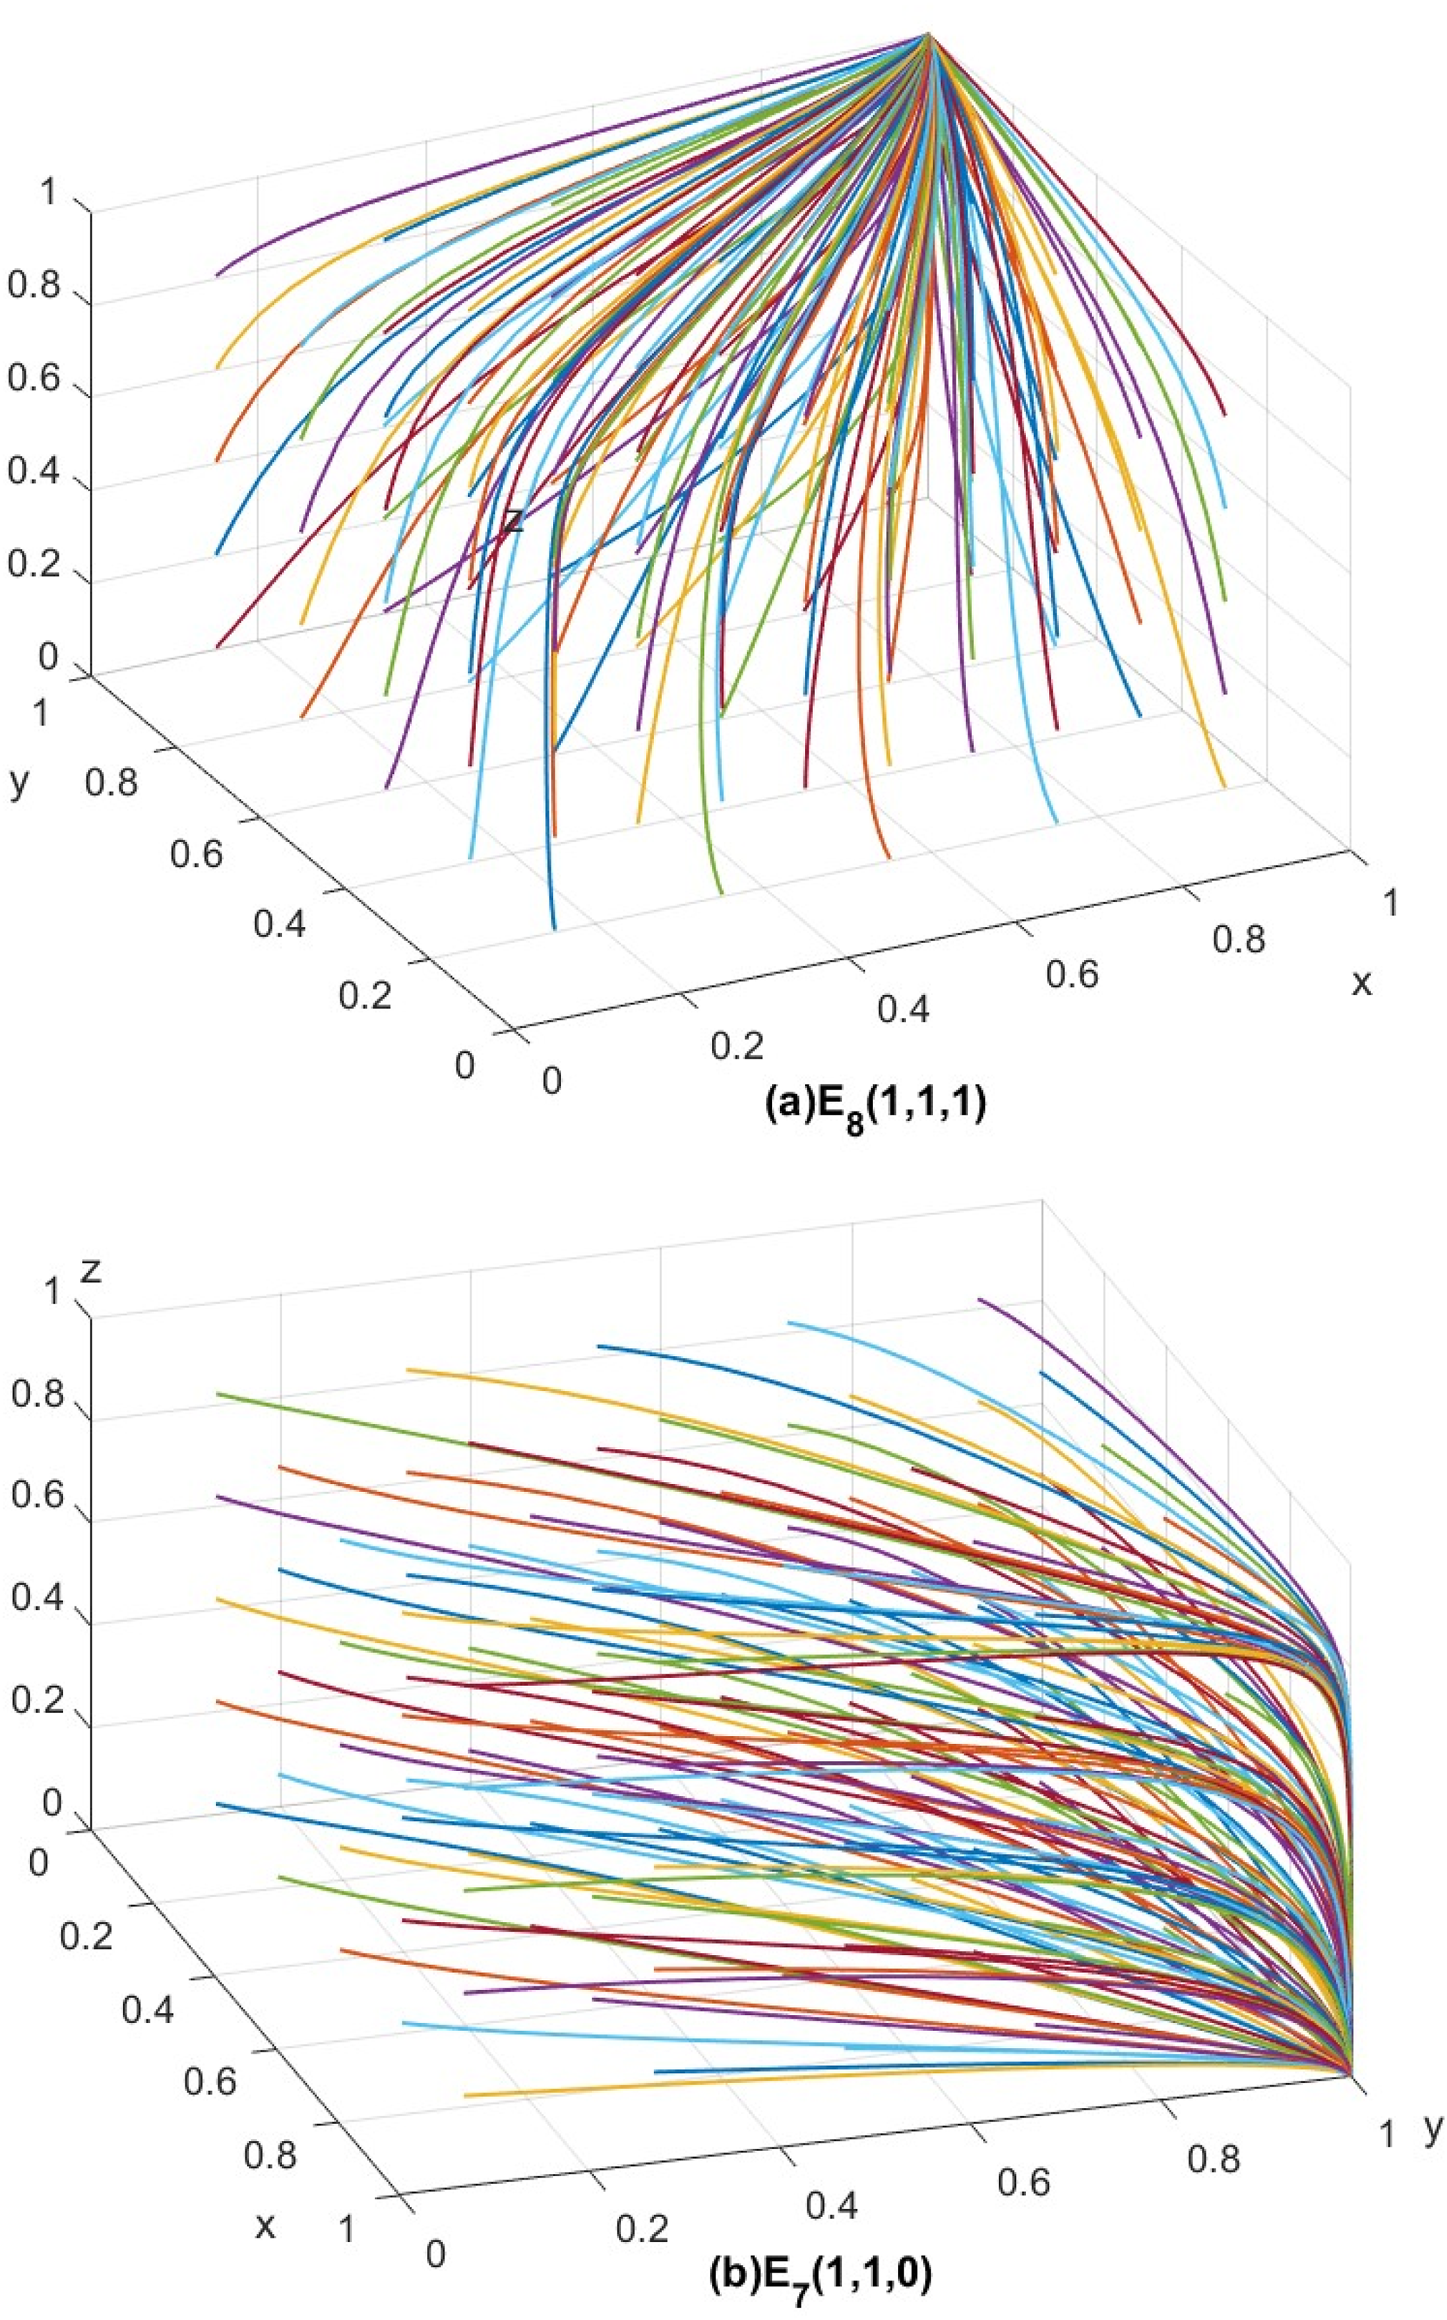
(a) E8(1, 1, 1). (b) E7(1, 1, 0). The evolutionary trajectories of players at the ESS.
Given that the initial probabilities of the three parties, , and , are distributed at random distributions between [0, 1], the path evolution of the three-party game system with different initial probabilities is first examined. The specific analysis will be performed with the values of Case 1 () as an example. We set the initial probability of to 0.2, 0.5, or 0.7; as time changes, the probabilities of in Figure 4 tend to stabilize. The findings in Figure 4 demonstrate that when the conditions are met, the ESS point is (1,1,1) irrespective of the initial probability combination of the three-game subjects' strategies. Therefore, the conclusion from Proposition 4 can be verified. We can also obtain the third conclusion from Figure 4. The larger the initial probability of three subjects, the shorter the time for the system to reach a stable state.
FIGURE 4
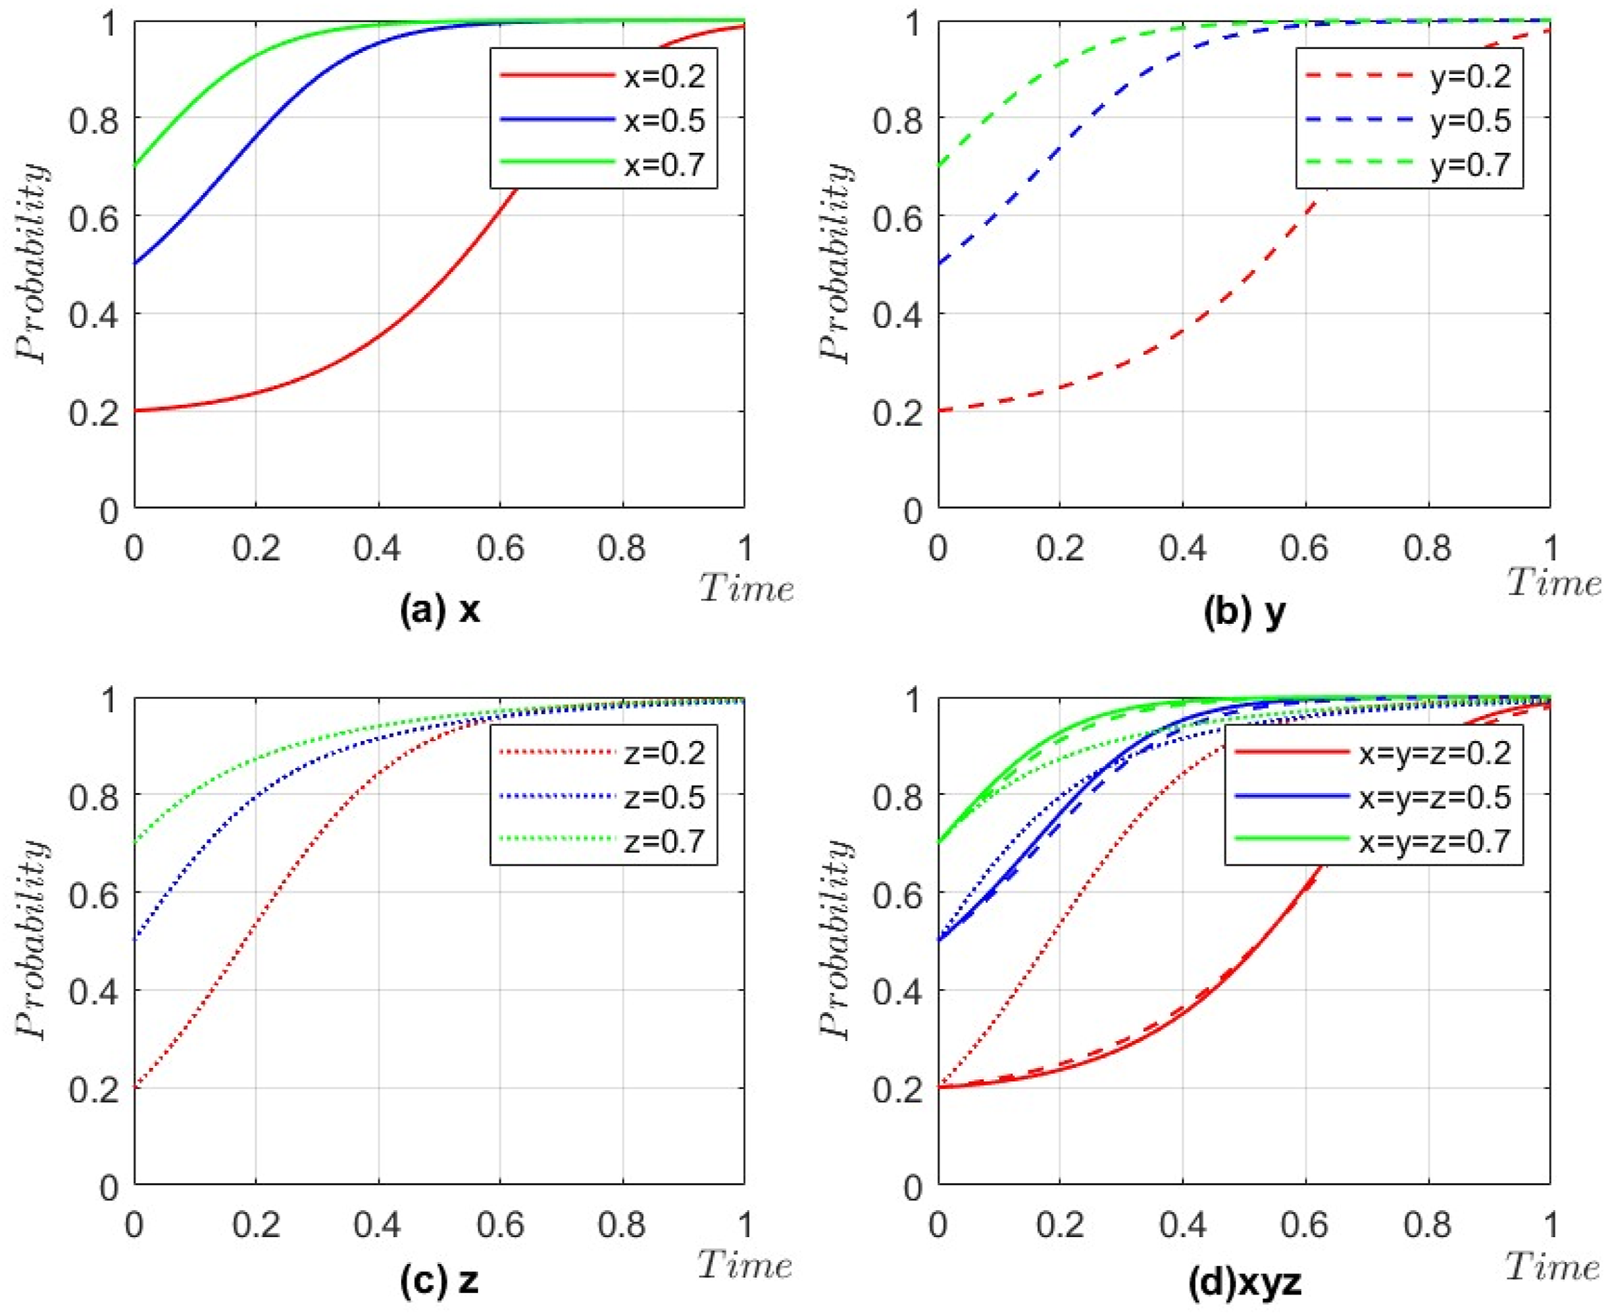
(a) x. (b) y. (c) z. (d) xyz. The evolution path under different initial probabilities.
5.2 Parameter sensitivity analysis
Theoretically, we hold that companies can modify their own strategies to promote ecological cooperation and mutually beneficial outcomes. Governments may also be able to successfully carry out their regulatory duties at the same time, increasing the legitimacy of government and encouraging social and economic transformation. Consequently, we will concentrate more on the effects of changing various elements on the equilibrium of the evolutionary game in what follows. According to the above analysis, the ecological sensitivity (), compensation fee (), and allocation coefficient () for enterprises and the subsidy coefficient () and extra costs () for the government are chosen as the primary parameters for the sensitivity analysis. All initial probabilities in this section are set as 0.5, meaning that . The parameter values are also set in case 1, for example.
5.2.1 Ecological sensitivity ()
All other parameters in this analysis are kept constant, except for ecological sensitivity (). The different values of are listed in Figure 5, and the analysis findings are also displayed.
FIGURE 5
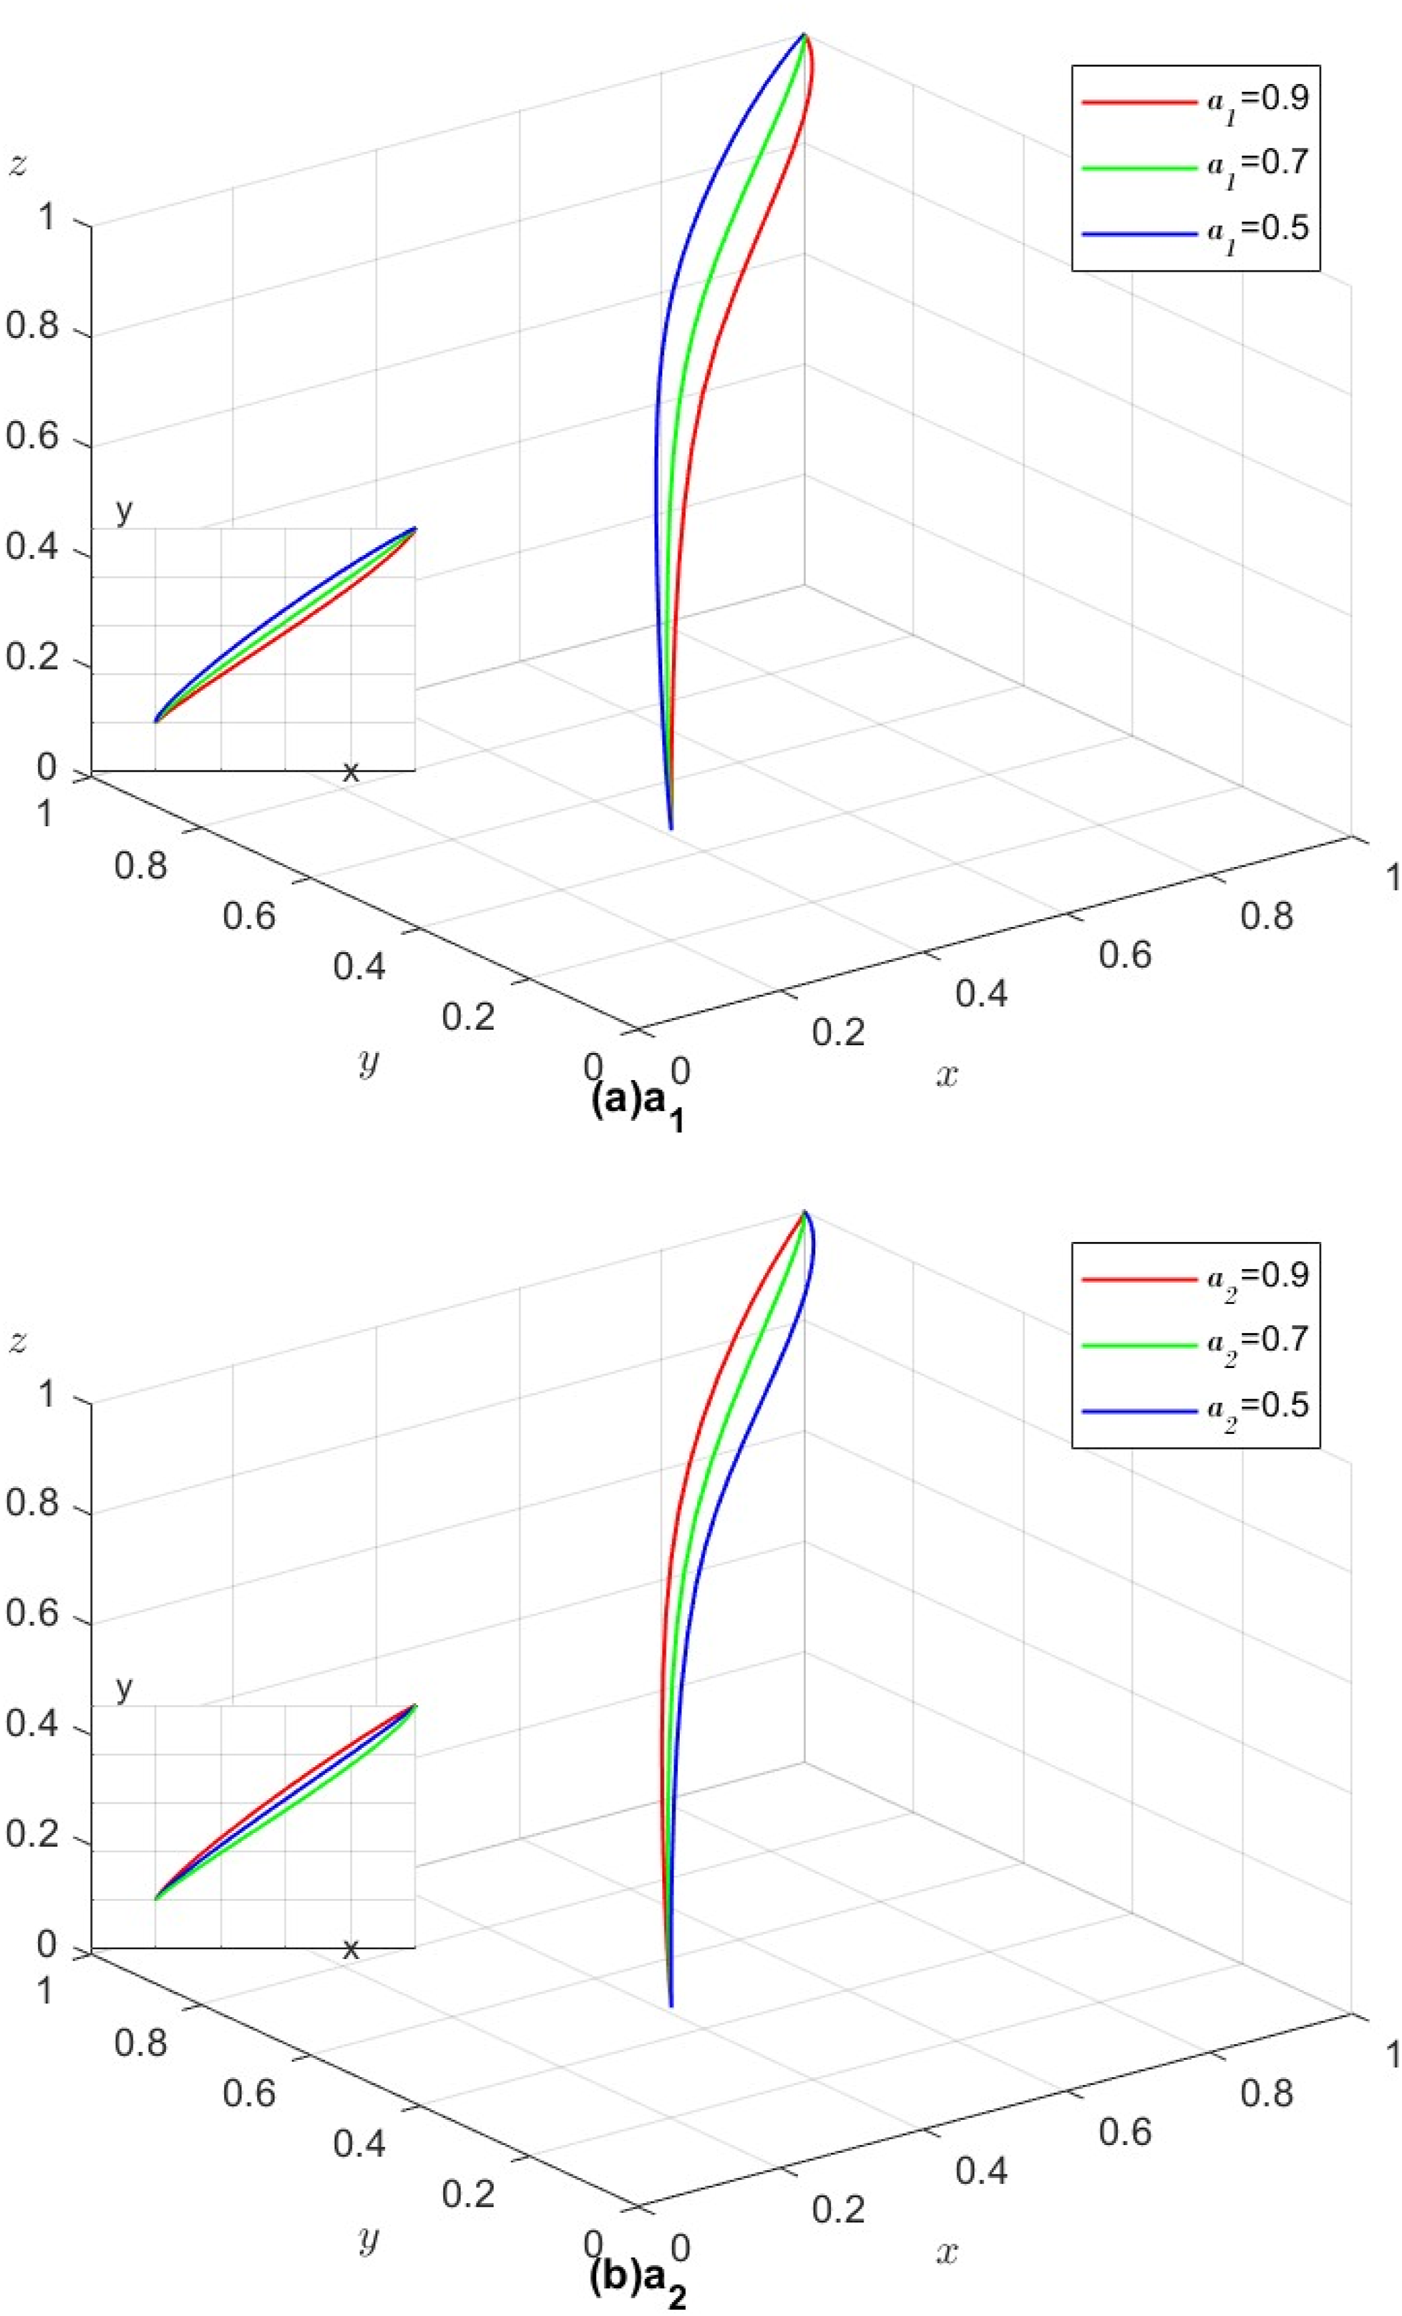
(a) a1. (b) a2. Decisions of the three parties influenced by different ecological sensitivities ().
According to Figure 5a, when increases from 0.5 to 0.9, increases, decreases, and finally stabilizes at 1. This indicates that with increasing ecological sensitivity (), suppliers can obtain more innovation benefits from ecological cooperation and have greater absorption capacity for resources generated by ecological cooperation; at the same time, manufacturers are at a disadvantage. The same analysis can be used for Figure 5b, but the situation is reversed. In this process, the change trends of are not sensitive.
In practice, this situation is understandable. When upstream suppliers have keen market insight and the ability to absorb the data, information and other kinds of resources generated in ecological cooperation for their own benefit, suppliers will have a stronger willingness to carry out ecological cooperation. The same is true for downstream manufacturers. Eco-cooperation is not a zero-sum game; all members can enjoy the resources generated by eco-cooperation. This paper argues that the innovation benefits of eco-cooperation depend on the eco-sensitivity () of enterprises, which is closely related to their own capabilities. When other conditions remain unchanged, the strength between partners is comparable, which is more conducive to the realization of ecological cooperation.
5.2.2 Compensation fee ()
In this section, the parameters in the evolution model are held except for the compensation fee (), which is set to 2, 5, and 8. The results are shown in Figure 6.
FIGURE 6
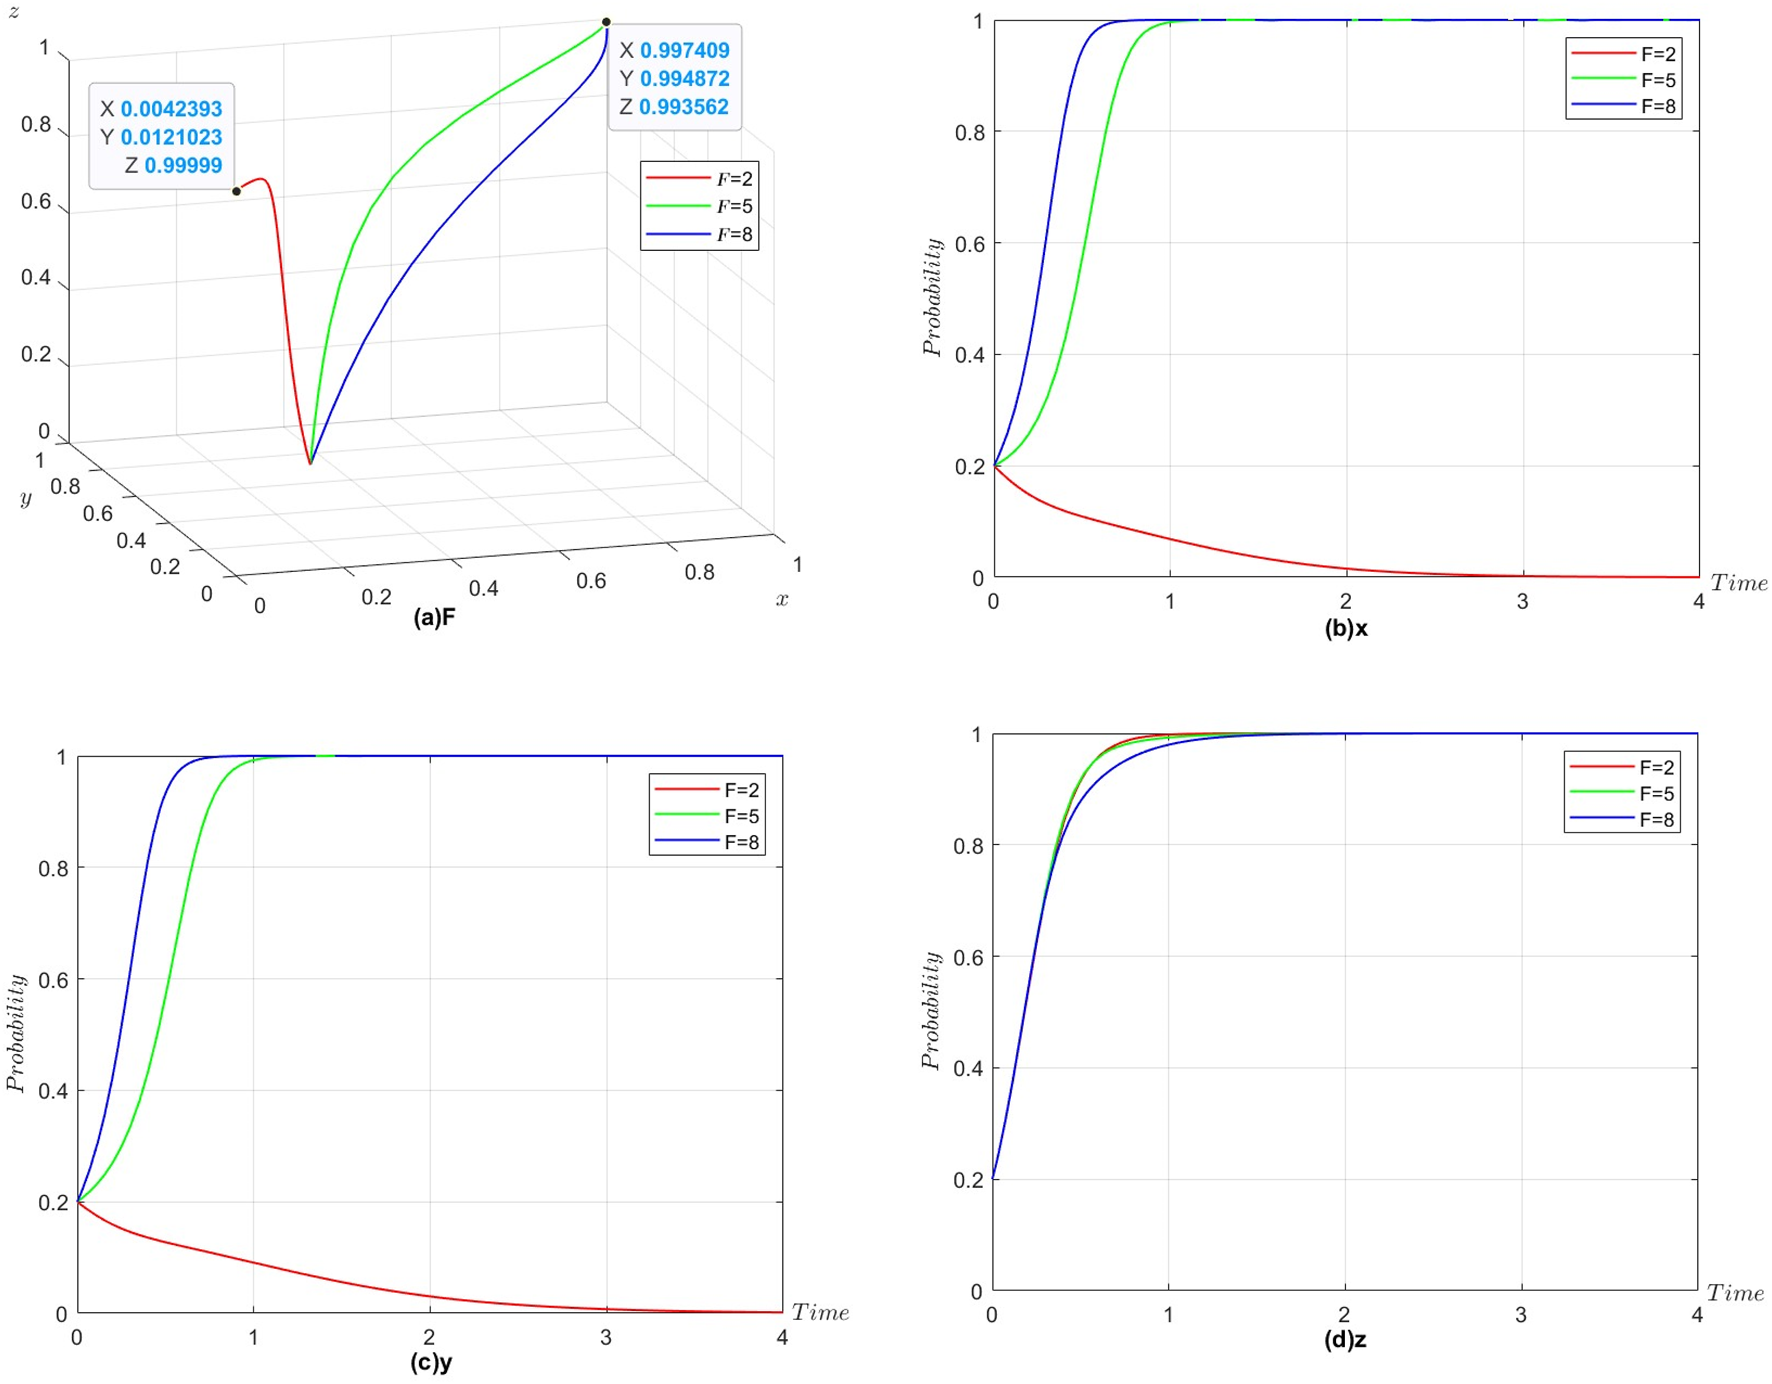
(a) F. (b) x. (a) y. (d) z. Decisions of three parties influenced by different compensation fees ().
It is obvious from Figure 6a that under the condition that Proposition 4 is satisfied, the value of affects the decisions of the suppliers and manufacturers when the other parameters are taken constantly. It may be that under certain conditions, suppliers and manufacturers will tend to refrain from eco-cooperation when is less than a particular value, and their strategies will stabilize in eco-cooperation when it is greater than this particular value. In contrast, governments are not sensitive. An increase in will cause the conversion from to . When is different, the graphs of with time are illustrated in Figures 6b–d.
In reality, compensation fees are an effective means of securing business-to-business cooperation. Since enterprises need to invest certain costs in advance when they choose to carry out ecological cooperation and will open certain enterprise resources to partners, when free-riding behavior occurs, enterprises will suffer economic losses. Setting compensation fees in cooperation will effectively put financial pressure on partners, reduce the speculative behavior of enterprises and enhance their confidence in carrying out ecological cooperation. Consequently, fair remuneration rates can encourage collaboration between manufacturers and suppliers.
5.2.3 Extra costs of the enterprises ()
The other parameters in the model are kept constant, and the results of and are shown in Figure 7 by changing the values of and .
FIGURE 7
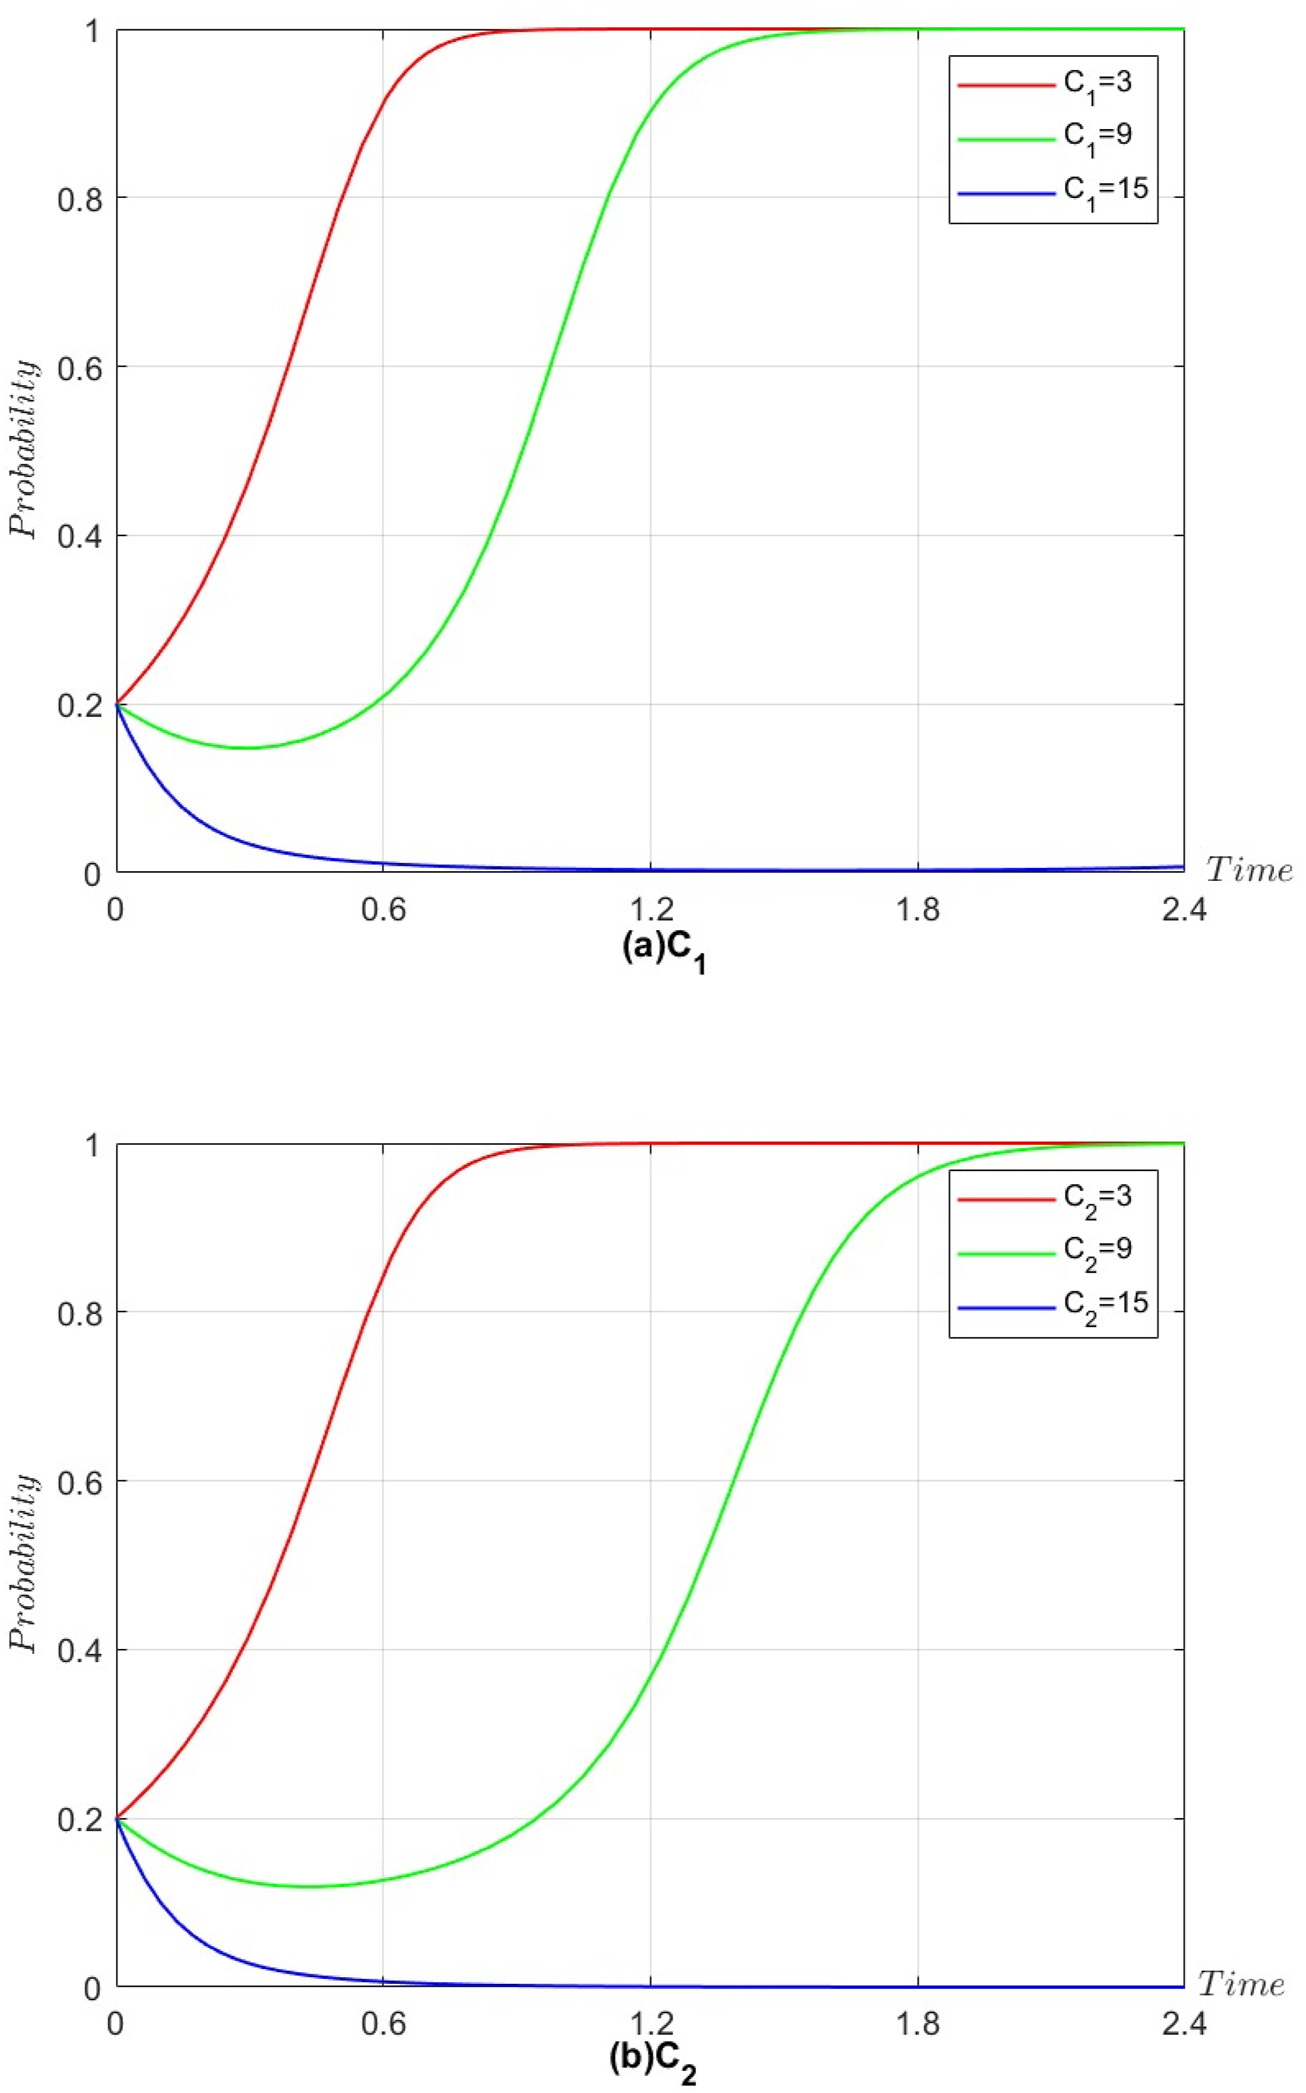
(a) C1. (b) C2. Effect of on the suppliers’ decisions and effect of on the manufacturers’ decisions.
As shown in Figure 7a, the willingness of suppliers to engage in eco-cooperation gradually decreases as the extra cost increases; when the cost is higher than a specific value, suppliers choose not to engage in eco-cooperation. The same is true for the manufacturers, but the difference is that the cost threshold for whether the manufacturers engage in eco-collaboration is lower than that of the suppliers (Figure 7b). This phenomenon is related to the initial parameter settings. In addition, a comparison of Figures 7a and b shows that when other parameters are constant, the suppliers will stabilize faster than the manufacturer if the costs invested in achieving eco-cooperation are the same.
Whether companies choose to engage in eco-cooperation is closely related to its costs in practice. In our initial value setting, upstream suppliers have an information and resource advantage over downstream manufacturers (), so it is not difficult to explain why upstream suppliers have a greater tolerance for costs than downstream manufacturers. Both suppliers and manufacturers will take longer to achieve eco-cooperation as its cost continues to increase, or they may even eventually choose not to do so.
5.2.4 Allocation coefficient ()
The parameters of the game model are fixed, except for the allocation coefficient (), which is set to values of 0.8, 0.5, and 0.2 to study the sensitivity of this parameter. Figure 8 shows the results.
FIGURE 8
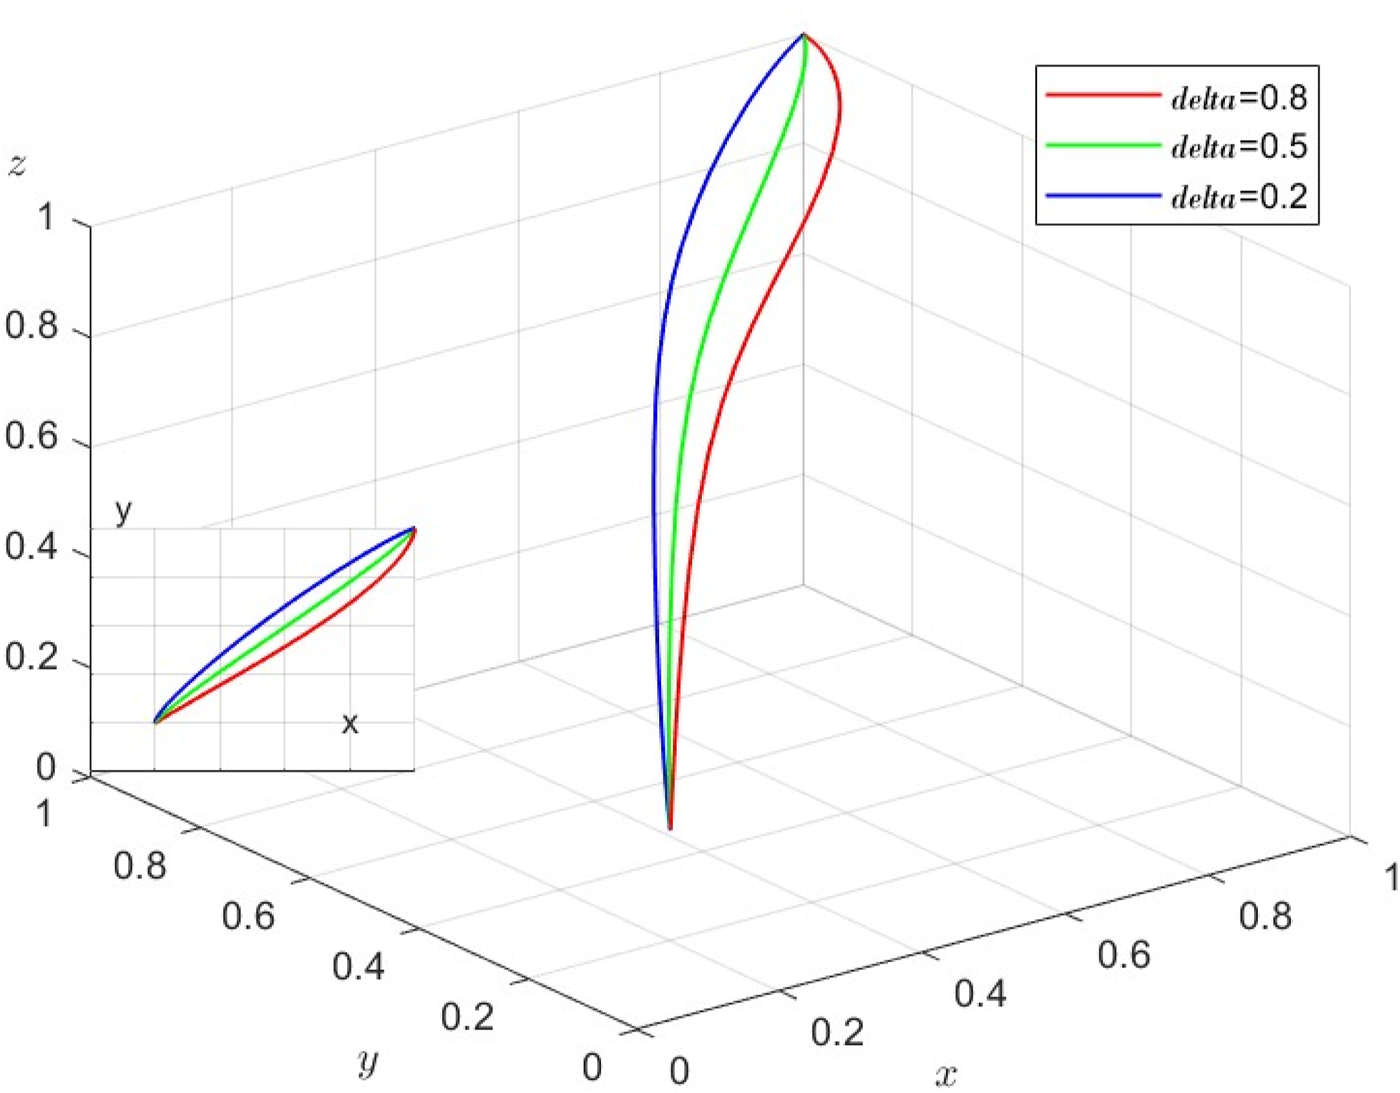
The decisions of the three parties influenced by different allocation coefficients ().
With the increase in the allocation coefficient, increases, decreases, and finally stabilizes at 1. In this process, governments are not sensitive enough. The allocation coefficient () determines the level of common risk-based benefits that suppliers and manufacturers receive as a result of improved overall supply chain market competitiveness when they engage in ecological cooperation. According to Figure 8, a balanced distribution of common benefits among partners will facilitate a faster realization of ecological cooperation.
Thus, as the allocation coefficient increases, upstream suppliers can gain more benefits from ecological cooperation, but downstream manufacturers may decrease their willingness to participate in ecological cooperation because they are at a disadvantage in the distribution of benefits. This is in line with reality. We also know that changes in this single factor do not affect the choice of this three-party strategy.
5.2.5 Subsidy coefficient ()
According to Proposition 4, the equilibrium condition of is expressed as ; when other parameters are fixed, we will study the effect of the change in the government subsidy coefficient () on the strategy choices of the three subjects (Figure 9). According to the initial value setting of case 1, the government subsidy coefficient is 0.4, 0.6, and 0.8.
FIGURE 9
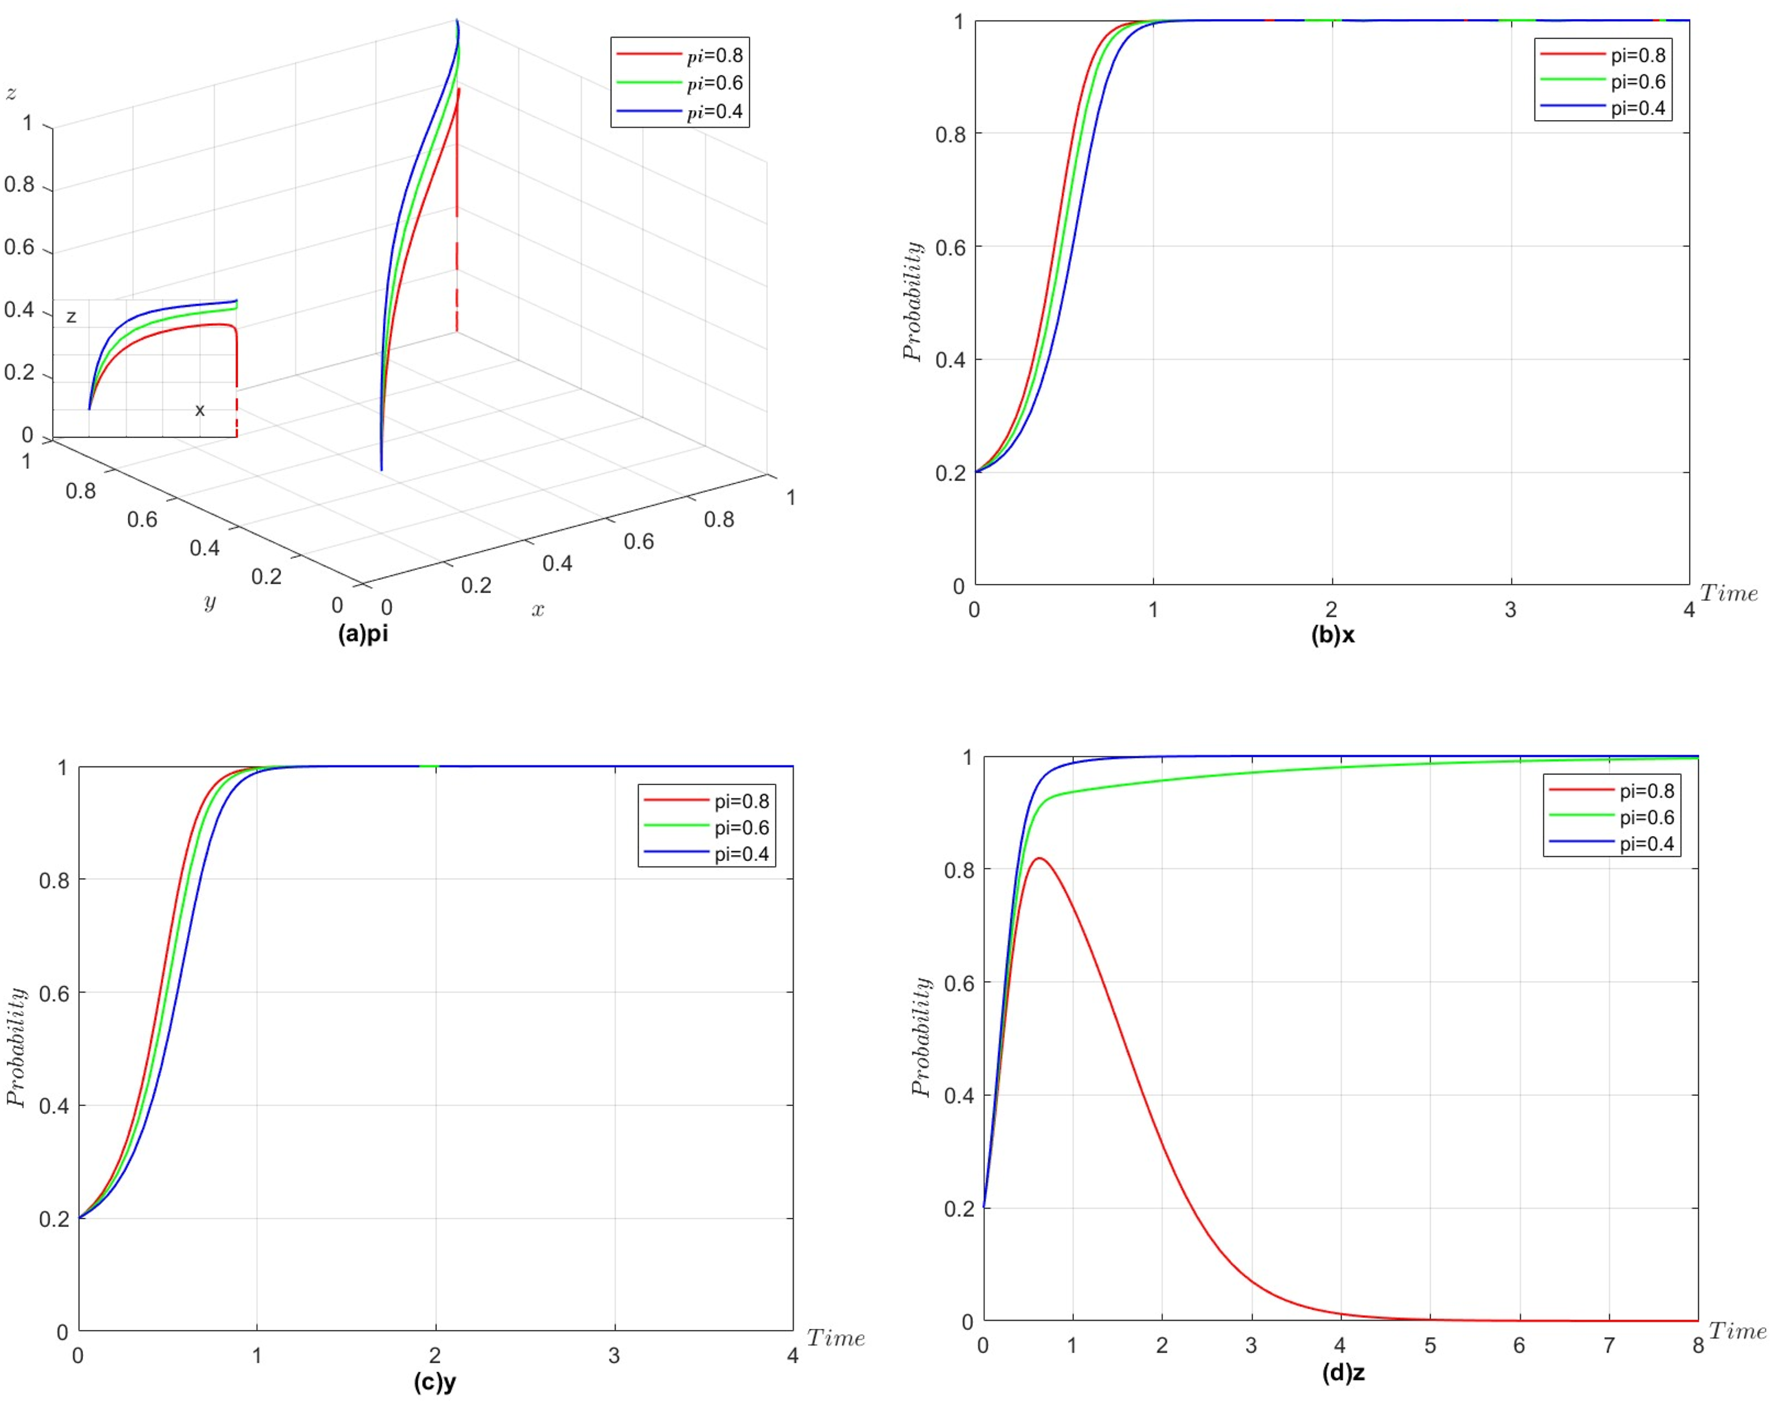
(a)pi. (b)x. (c)y. (d)z. Decisions of the three parties influenced by different subsidy coefficients ().
According to Figure 8, the government is more sensitive to the subsidy factor than suppliers and manufacturers. When , as increases, first increases and then decreases to eventually stabilize at 0. When satisfies the above constraint, the changes in and are roughly the same and finally stabilize at 1. With increasing , the equilibrium point will change from to . To more intuitively represent the effect of the change in pi on , the results are shown in Figures 9b–d.
In general, the subsidy coefficient is an important factor that influences government decisions and determines the cost of government incentives for firms to cooperate ecologically. The government’s cost subsidy to enterprises will effectively reduce the cost of enterprise eco-cooperation, which is a direct means of encouraging cooperation. However, the government also needs to consider its input‒output effect, and a reasonable subsidy coefficient will achieve a win‒win situation for all three parties.
5.2.6 Extra costs of government ()
To analyze the sensitivity of the extra costs of government (), the other parameters in this model are fixed. The extra costs of the government () are set to different values, as shown in Figure 10.
FIGURE 10
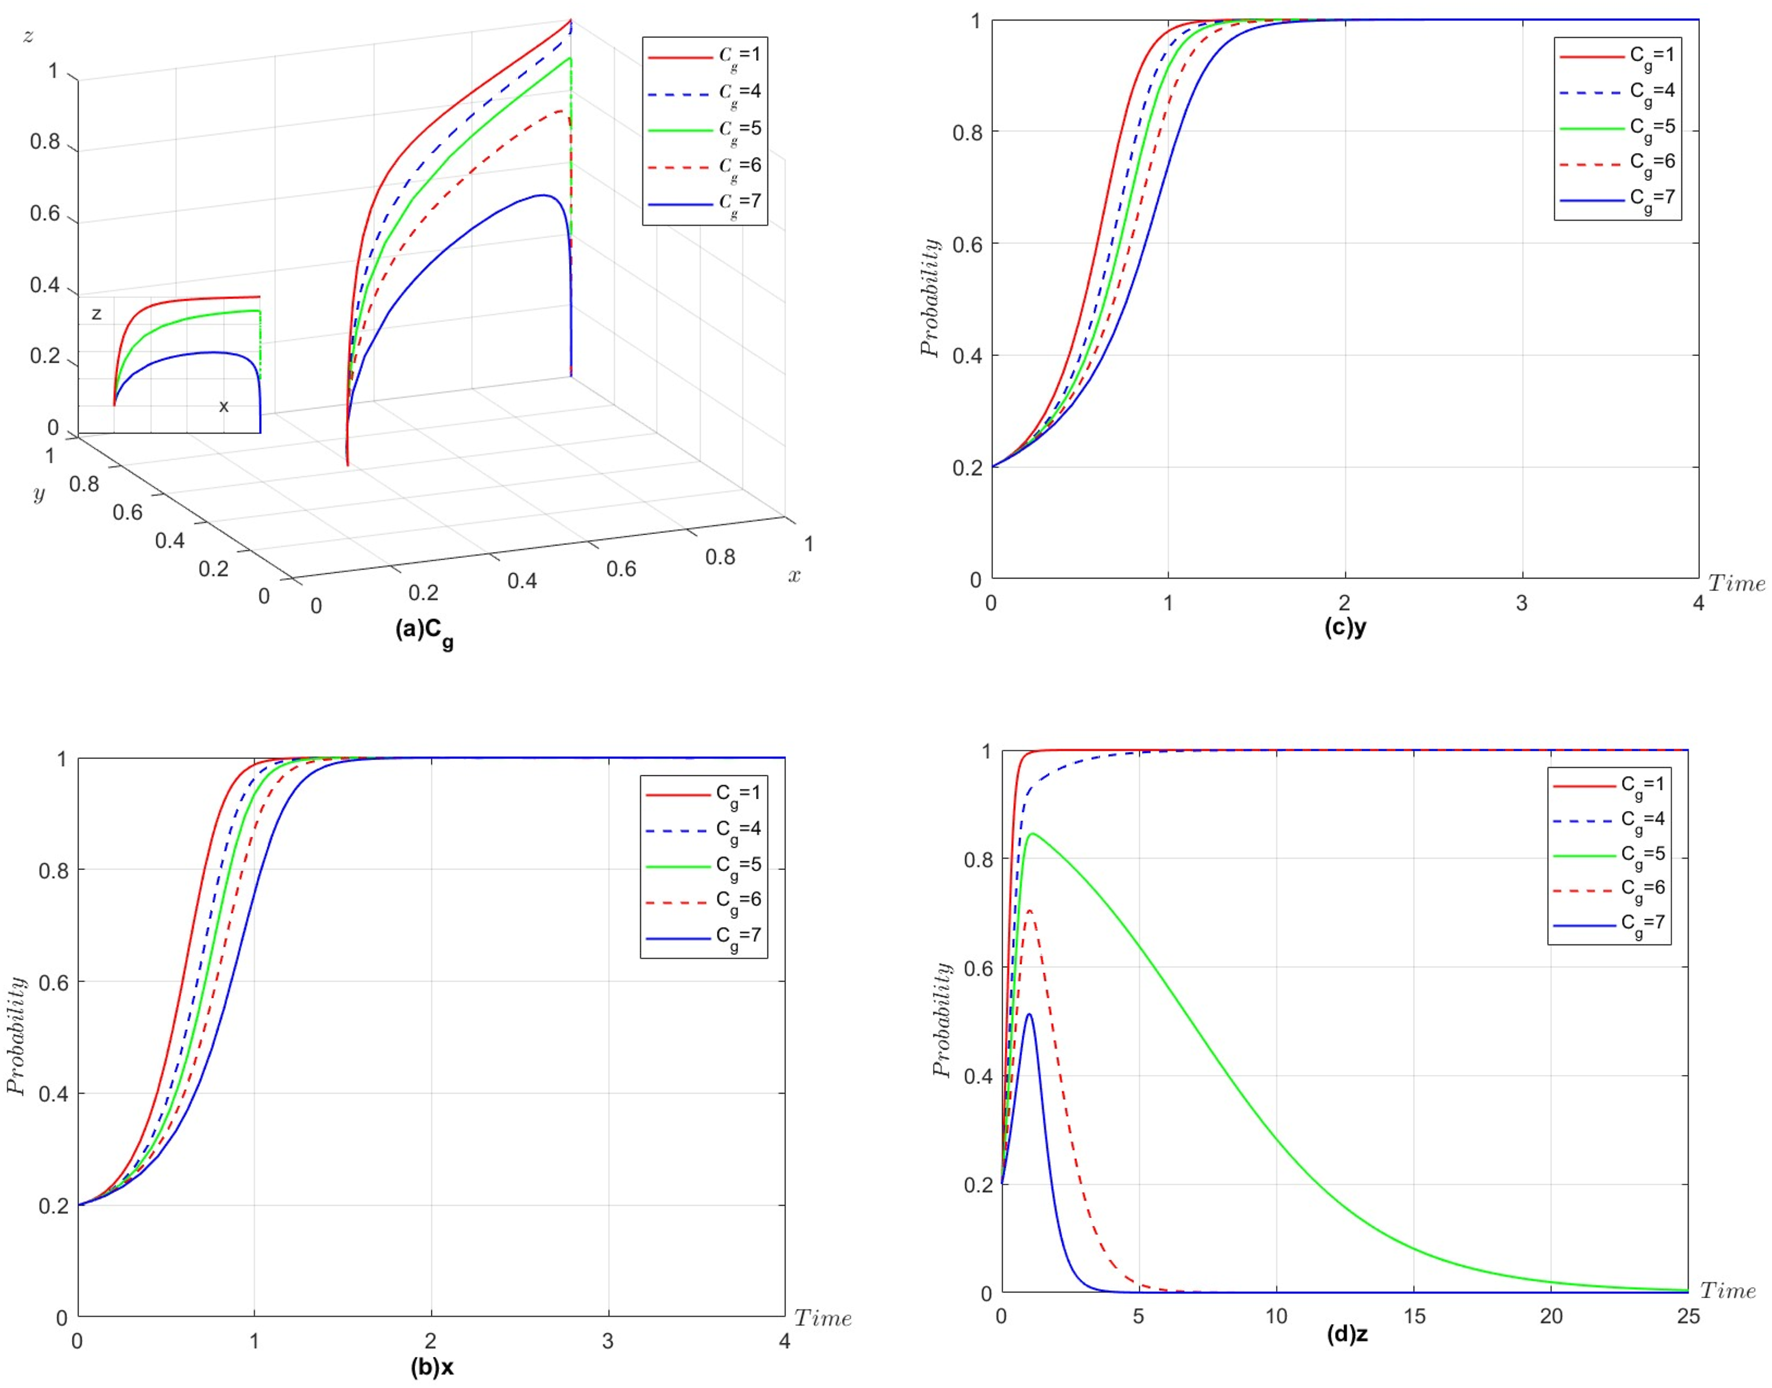
(a)Cg. (b)x. (c)y. (d)z. Decisions of the three parties influenced by different extra costs of government ().
Under the numerical conditions of case 1, changing the value of will mainly affect the government’s decision-making and have little effect on the suppliers and manufacturers. As shown in Figures 10a and d, eventually stabilizes at 1 when gradually increases from 1 to 4. However, after is greater than or equal to 5, increases and then decreases and eventually tends to 0 as time increases. The gradual increase in causes the system equilibrium point to change from to . In addition, according to Figures 10b and c, all else being equal, the suppliers and manufacturers will achieve ecological cooperation more quickly with low government regulatory costs.
In practice, governments will incur additional costs in active regulation to establish policies of incentives and penalties and other administrative expenses. According to the above analysis, government costs () are among the most important factors that influence the government decisions. When these costs are too high, the willingness of the government to actively regulate will decrease, and the lack of cost subsidies from the government will also affect enterprises’ decisions. Reasonable government costs will contribute to the sound development of the whole system.
6 Conclusions and implications
6.1 Main conclusions
This paper examines the mechanism by which supply chain companies carry out ecological cooperation, taking into account a two-level supply chain composed of suppliers and manufacturers that is regulated by the government, against the backdrop of the development of the digital economy and business ecosystem. Using evolutionary game theory, we build a three-party model involving suppliers, manufacturers, and the government. The model is grounded in literature review and calibrated through empirical validation. We also analyze the stability of each party’s strategy choice and the stability of the system equilibrium strategy combination. We draw several theoretical and practical findings from our investigation.
(1) In this study, there are two ideal game equilibrium points: and . Governments play an important role in promoting ecological cooperation among supply chain companies, and setting a cost subsidy factor is an effective means to promote eco-cooperation; however, the cost of spending for this purpose is an important consideration for the government to actively regulate. When there is no government regulation, if enterprises want to achieve ecological cooperation with their partners, they need to set reasonable compensation fees and allocation coefficients between each other to guarantee the benign development of eco-cooperation, while their ability and the costs of conducting ecological cooperation are also important influencing factors that affect their strategy choice. The specific implications will be described in detail below.
(2) A company’s ecological sensitivity represents its ability to absorb the benefits of innovation from eco-cooperation and needs to be enhanced as it develops; the higher the eco-sensitivity is, the more advantageous it is in eco-cooperation.
(3) Setting a reasonable compensation fee is an effective means of ensuring that eco-cooperation is carried out; it will reduce the speculative behavior of enterprises and ultimately influence supplier and manufacturer decisions.
(4) A company’s cost investment in eco-cooperation is an important influencing factor on whether it engages in eco-collaboration. High costs increase the time needed to achieve ecological cooperation between suppliers and manufacturers; when a certain amount of time is exceeded, companies choose not to ecologically cooperate. In addition, upstream suppliers are more tolerant of costs than downstream manufacturers.
(5) Reasonable benefit allocation coefficients will contribute to ecological cooperation.
(6) The government can influence the equilibrium of the whole system by adjusting the subsidy coefficient and the cost of regulation. If the subsidy coefficients are set appropriately to control the cost of regulation, a win‒win situation for all three parties can be achieved.
(7) An optimal strategy set that may ultimately be achieved, given a random initial probability distribution among suppliers, manufacturers, and governments, is {ecological cooperation, ecological cooperation, and supervision}. Additionally, the system will attain a steady state more quickly when the initial probability is higher.
6.2 Policy recommendations
(1) Governments should actively regulate supply chain ecological cooperation by tailoring interventions to market contexts. In strictly regulated markets (e.g., EU electronics), fixed subsidies (e.g., 30% of eco-certification costs) should be combined with escalating penalties for data misuse (e.g., 2%–5% of annual revenue). In developing economies, phased supervision is desirable—initial tax incentives for voluntary cooperation (e.g., 10% R&D deductions) transitioning to mandatory blockchain-tracked audits once digital infrastructure matures. Clear policy frameworks must balance standardization with flexibility to ensure that technological innovations like green manufacturing translate equitably across industries into tax revenues and social benefits.
(2) When adopting non-specialized supervision, collaboration mechanisms should be contextualized. For technology-driven sectors (e.g., renewable energy), AI-powered contract platforms should be co-developed with industry alliances to dynamically adjust revenue-sharing coefficients based on real-time market data (e.g., carbon credit prices). In fragmented traditional sectors (e.g., textiles), centralized data hubs managed by trade associations should be established to enforce standardized compensation fees (e.g., 15% of speculative gains) while mitigating monopoly risks. Cross-sector benchmarks should account for disparities in digital readiness, particularly in monitoring information security across globalized supply networks.
6.3 Limitations and research outlook
While this study provides valuable insights into the dynamics of ecological cooperation within supply chain ecosystems, it has certain limitations that open avenues for future research. First, this research focuses on a two-tier supply chain involving upstream suppliers and downstream manufacturers. Future studies could expand this scope by incorporating more complex and realistic scenarios, such as multi-tier supply chains or cross-industry collaborations to better reflect the intricacies of real-world supply chain ecosystems.
Furthermore, certain limitations in parameter settings should be acknowledged. The current model assumes static interaction parameters, which may oversimplify real-world dynamics where factors like evolving trust levels, asymmetric information sharing, and time-dependent technological compatibility significantly influence cooperation outcomes. Additionally, the fixed subsidy-penalty ratios and ecological sensitivity coefficients do not fully capture how regulatory frameworks or innovation capabilities might shift across different industry contexts or economic cycles. These constraints could affect the generalizability of equilibrium predictions, particularly in sectors with rapid technological disruption or volatile policy environments. Future iterations could address these gaps by incorporating adaptive parameter mechanisms and scenario-based sensitivity testing to better reflect the temporal and contextual complexities of supply chain ecosystems.
Third, this study employs an evolutionary game approach, which assumes full interaction among participants. However, as highlighted recently (e.g., Li, X., et al., 2024), incomplete and asymmetric interactions have become a critical area of research [29, 30]. Future work could explore scenarios where information is imperfectly shared or where participants have varying levels of influence and decision-making power. This would align with real-world conditions where supply chain actors often operate under constraints such as limited information or unequal bargaining power.
Finally, integrating prospect theory and risk preference into the evolutionary game framework could offer new perspectives on how firms make decisions under uncertainty. This approach would allow researchers to explore how risk attitudes and behavioral biases influence the evolution of cooperation strategies in supply chain ecosystems.
In conclusion, addressing these limitations and exploring these future directions will not only enhance the theoretical foundations of supply chain ecosystem research but also provide practical guidance for fostering sustainable and resilient supply chain collaborations in an increasingly complex and uncertain global environment.
Statements
Data availability statement
The original contributions presented in the study are included in the article/supplementary material; further inquiries can be directed to the corresponding authors.
Author contributions
ML: conceptualization, formal analysis, methodology, and writing – original draft. LY: conceptualization, formal analysis, methodology, writing – original draft, project administration, and supervision. MY: software, validation, visualization, and writing – original draft. LH: writing – review and editing.
Funding
The author(s) declare that financial support was received for the research and/or publication of this article. This research was funded by Shanghai Philosophy and Social Science Planning Project (2023BCK010).
Conflict of interest
The authors declare that the research was conducted in the absence of any commercial or financial relationships that could be construed as a potential conflict of interest.
Generative AI statement
The authors declare that no Generative AI was used in the creation of this manuscript.
Publisher’s note
All claims expressed in this article are solely those of the authors and do not necessarily represent those of their affiliated organizations, or those of the publisher, the editors and the reviewers. Any product that may be evaluated in this article, or claim that may be made by its manufacturer, is not guaranteed or endorsed by the publisher.
References
1.
Grybauskas A Stefanini A Ghobakhloo M . Social sustainability in the age of digitalization: a systematic literature Review on the social implications of industry 4.0. Technology Soc (2022) 70:101997. 10.1016/j.techsoc.2022.101997
2.
Kähkönen A. K. Evangelista P Hallikas J Immonen M Lintukangas K COVID-19 as a trigger for dynamic capability development and supply chain resilience improvement. Int J Prod Res (2023) 61(8):2696–2715.
3.
Sun Y Yu H Wang H . A systems perspective on the approach to industrial chain and supply chain ecology. SYSTEMS RESEARCH AND BEHAVIORAL SCIENCE (2024). 10.1002/sres.3041
4.
Wang L Kong X Wang W Gong Y . Pursuing supply chain ecosystem health under environmental turbulence: a supply chain learning approach. Int J Prod Res (2024) 62(8):2792–811. 10.1080/00207543.2023.2235019
5.
Xiong L Xue R . Evolutionary game analysis of collaborative transportation of emergency materials based on blockchain. Int J Logistics Res Appl (2023) 27:1633–54. 10.1080/13675567.2023.2173160
6.
Long Q Tao X Shi Y Zhang S . Evolutionary game analysis among three green-sensitive parties in green supply chains. IEEE Trans Evol Comput (2021) 25(3):508–23. 10.1109/tevc.2021.3052173
7.
Yu Z Rehman Khan SA . Evolutionary game analysis of green agricultural product supply chain financing system: COVID-19 pandemic. Int J Logistics Res Appl (2022) 25(7):1115–35. 10.1080/13675567.2021.1879752
8.
Gu W Wei L Zhang W Yan X . Evolutionary game analysis of cooperation between natural resource- and energy-intensive companies in reverse logistics operations. Int J Prod Res (2019) 218:159–69. 10.1016/j.ijpe.2019.05.001
9.
Zou X Chen J Gao S . Network effect in shared supply chain platform value co-creation behavior in evolutionary game. J Intell & Fuzzy Syst (2021) 41:4713–24. 10.3233/jifs-189958
10.
Sun H Wan Y Zhang L Zhou Z . Evolutionary game of the green investment in a two-echelon supply chain under a government subsidy mechanism. J Clean Prod (2019) 235:1315–26. 10.1016/j.jclepro.2019.06.329
11.
Mahmoudi R Rasti-Barzoki M . Sustainable supply chains under government intervention with a real-world case study: an evolutionary game theoretic approach. Comput & Ind Eng (2018) 116:130–43. 10.1016/j.cie.2017.12.028
12.
Liu W Zhao M Wang Y Rashidian S Baig F Liu R et al BayesGaze: a bayesian approach to eye-gaze based target selection. Int J Prod Econ (2021) 2021:231–40. 10.20380/GI2021.35
13.
Zhang YLXW . AI-driven demand forecasting in volatile markets: a post-pandemic perspective. J Operations Management (2024) 72(3):45–60.
14.
Ivanov DDAS . Digital twins for supply chain risk management: a simulation-based approach. Int J Prod Res (2024) 62(10):2345–64.
15.
Kumar SSRK . IoT and big data analytics for sustainable manufacturing supply chains. Sustainable Prod Consumption (2024) 35:102–15.
16.
Jacobides MG Cennamo C Gawer A . Towards a theory of ecosystems. Strateg Management J (2018) 39(39):2255–76. 10.1002/smj.2904
17.
Adner R . Ecosystem as structure: an actionable construct for strategy. J Management (2017) 43(1):39–58. 10.1177/0149206316678451
18.
Gueler MS Schneider S . The resource-based view in business ecosystems: a perspective on the determinants of a valuable resource and capability. J Business Res (2021) 133:158–69. 10.1016/j.jbusres.2021.04.061
19.
Ketchen DJ Jr. Crook TR Craighead CW . From supply chains to supply ecosystems:implications for strategic sourcing research and practice. J Business Logistics (2014) 35(3):165–71. 10.1111/jbl.12057
20.
Letaifa SB . The uneasy transition from supply chains to ecosystems——the value-creation/value-capture dilemma. Management Decis (2014) 52(2):278–95. 10.1108/MD-06-2013-0329
21.
Jian C Yunhui L . Operations management innovation enabled by digitalization and intellectualization:from supply chain to supply chain ecosystem. J Management World(chinese) (2021)(11) 227–40. 10.19744/j.cnki.11-1235/f.2021.0180
22.
Liu W Long S Wei S Xie D Wang J Liu X . Smart logistics ecological cooperation with data sharing and platform empowerment: an examination with evolutionary game model. Int J Prod Res (2021) 60(13):4295–315. 10.1080/00207543.2021.1925173
23.
Yan X Liu W Lim MK Lin Y Wei W . Exploring the factors to promote circular supply chain implementation in the smart logistics ecological chain. Ind Marketing Management (2022) 101:57–70. 10.1016/j.indmarman.2021.11.015
24.
Van der Borgh M Cloodt M Romme AGL . Value creation by knowledge-based ecosystems: evidence from a field study. R&D Management (2012) 42(42):150–69. 10.1111/j.1467-9310.2011.00673.x
25.
Ming Z Hao L . New evolutionary game model of the regional governance of haze pollution in China. Appl Math Model (2018)(63) 577–90.
26.
Friedman D . On economic applications of evolutionary game theory. J.Evol.Econ (1998) 8(1):15–43. 10.1007/s001910050054
27.
Xu L Di Z Chen J . Evolutionary game of inland shipping pollution control under government co-supervision. Mar Pollut Bull (2021) 171:112730. 10.1016/j.marpolbul.2021.112730
28.
Friedman D . Evolutionary games in economics. Econometrica (1991) 59(3):637–66. 10.2307/2938222
29.
Li X Wang Z Xu Y Zhang H Yu G . Asymmetrical interactions driven by strategic persistence effectively alleviate social dilemmas. Chaos, Solitons & Fractals (2024) 184:115054. 10.1016/j.chaos.2024.115054
30.
Li X Hao G Zhang Z Xia C . Evolution of cooperation in heterogeneously stochastic interactions. Chaos, Solitons & Fractals (2021) 150:111186. 10.1016/j.chaos.2021.111186
Summary
Keywords
ecological cooperation, evolutionary game, supply chain, ecosystem government supervision, supply chain management
Citation
Luan M, Yin L, Ye M and Huang L (2025) Evolutionary game analysis of ecological cooperation in a supply chain ecosystem under government supervision. Front. Phys. 13:1544607. doi: 10.3389/fphy.2025.1544607
Received
11 January 2025
Accepted
22 April 2025
Published
21 July 2025
Volume
13 - 2025
Edited by
Chengyi Xia, Tianjin Polytechnic University, China
Reviewed by
Xiaopeng Li, Tianjin University of Technology, China
Dun Han, Jiangsu University, China
Updates
Copyright
© 2025 Luan, Yin, Ye and Huang.
This is an open-access article distributed under the terms of the Creative Commons Attribution License (CC BY). The use, distribution or reproduction in other forums is permitted, provided the original author(s) and the copyright owner(s) are credited and that the original publication in this journal is cited, in accordance with accepted academic practice. No use, distribution or reproduction is permitted which does not comply with these terms.
*Correspondence: Linsen Yin, yls@lixin.edu.cn
Disclaimer
All claims expressed in this article are solely those of the authors and do not necessarily represent those of their affiliated organizations, or those of the publisher, the editors and the reviewers. Any product that may be evaluated in this article or claim that may be made by its manufacturer is not guaranteed or endorsed by the publisher.