 Chunyou Ye
 Yaqing Jia1
- 1School of Biomedical Engineering, Anhui Medical University, Hefei, China
- 2Department of Neurosurgery, The First Affiliated Hospital of Anhui Medical University, Hefei, China
- 3Department of Orthopedics, Hefei BOE Hospital, Teaching Hospital of Shanghai, Hefei, China
- 4Department of Radiation Oncology, Peking University Shenzhen Hospital, Shenzhen, China
Introduction: Electrical properties (EPs) are widely used to assign values to electromagnetic simulation models, providing the comprehensive datasets needed for data-driven electrical properties tomography (EPT) reconstruction. However, the key limitations in current research on glioma EPs are the small sample sizes and the lack of EPs at certain Larmor frequencies. Therefore, this study aims to provide accurate glioma EPs in the full frequency range required for EPT.
Methods: We measured 128 samples, including 81 gliomas and 47 adjacent surrounding tissues, in the frequency range of 50 MHz to 4 GHz using an open-ended coaxial probe (OCP) method. The accuracy of our measurements was verified through uncertainty analysis. Using the Cole–Cole model, we obtained the EPs across the full frequency spectrum. Subsequently, we developed a human simulation model to evaluate the impact of different EPs on the simulated B1 field. At frequencies of 64 MHz, 128 MHz, 213 MHz, and 298 MHz, the model was assigned either the EPs measured in this study or those reported in the literature, and the relative differences in the simulated fields were calculated.
Results: We first analyzed the discrepancies between our measured EPs and those from previous studies. The results suggested that small sample sizes may introduce bias, potentially compromising the reliability of the findings. Moreover, interpolated data may fail to reflect the frequency-dependent behavior of EPs, leading to reduced accuracy. Simulation results indicate that differences in EPs can lead to measurable deviations in magnetic field simulations. This variation in the
Discussion: These findings underscore the importance of precise EPs measurements, as errors in the training dataset may compromise the performance of models. Therefore, the reliable EPs of glioma provided in this study have the potential to enhance the accuracy of data-driven EPT, thereby assisting clinical diagnosis and treatment.
1 Introductions
Electrical properties (EPs), including conductivity and relative permittivity, offer insights into both normal and abnormal tissue conditions, making them valuable biomarkers for disease detection and diagnosis [1–3]. Moreover, EPs as inherent physical parameters, dictate the behavior of electromagnetic field. The distribution of electromagnetic fields in the body has a significant impact on the outcomes of electromagnetic field-based treatments, such as radiofrequency/microwave ablation [4], neuromodulation with electromagnetic stimulation [5, 6], and tumor treating fields therapy [7]. Therefore, accurate acquisition of the EPs allows for better prediction of treatment outcomes.
Magnetic resonance electrical properties tomography (MR-EPT) is an emerging non-invasive technique used to map EPs inside the human bodies [8]. To achieve this goal, various MR-EPT reconstruction algorithms have been proposed based on different arrangements of Maxwell’s equations [9–15]. Most MR-EPT approaches apply certain assumptions to derive simplified formulations. For example, Electrical Properties Tomography based on the Helmholtz equation (H-EPT) assumes that the tissue properties are locally homogeneous [10, 16]. However, this assumption leads to artifacts at tissue boundaries, where spatial homogeneity is disrupted. To address the limitations of the homogeneity assumption, the Helmholtz equation can be reorganized by introducing a convection-reaction term, leading to the convection-reaction EPT (cr-EPT) formulation [9]. Nevertheless, both H-EPT and cr-EPT rely on numerical approximations of the noisy measured
Recently, data-driven reconstruction methods have been introduced for EPs reconstruction [20–22]. These methods utilize an end-to-end neural network model, employing supervised learning to map the
This study aims to provide EPs for data-driven EPT of gliomas. Although LU et al. have provided EPs for gliomas and adjacent surrounding tissues [27], their data are limited to a few frequency points within the 5–500 MHz range and lack EPs at the certain Larmor frequency, thus not covering the parameters at 64 MHz (1.5 T), 213 MHz (5 T), and 298 MHz (7 T). A common approach to address missing frequency points is to use interpolation; however, this can introduce model errors, as the interpolation may not accurately capture the true frequency-dependent behavior of the EPs. Therefore, in this study, we measured the EPs of 128 samples within the frequency range of 50 MHz-4 GHz using the open-ended coaxial probe (OCP) method. These samples included 81 glioma samples and 47 adjacent surrounding tissue samples. Additionally, we applied the Cole-Cole model to derive fitting parameters and used these parameters to calculate the EPs at 1.5 T, 3 T, 5 T, and 7 T. The data in this study provide accurate and valuable EPs for gliomas which can contribute to EPT research while promising to assist with clinical diagnoses and treatment effectively.
2 Materials and methods
The overall scheme of this paper is illustrated in Figure 1, which is divided into three parts. First, during data collection, we measured the EPs of tissues using the OCP method and obtained the Cole-Cole fitting parameters from the measured EPs, which were then used to calculate the EPs at the Larmor frequencies. The second part involves establishing simulation models, where the EPs at the Larmor frequencies from both our study and previous work were assigned to the models to obtain the

Figure 1. Schematic diagram of this study.
2.1 Data collection
This study was conducted at the First Affiliated Hospital of Anhui Medical University and approved by the Ethics Committee of Anhui Medical University (NO. 81220280). Before the study, all patients provided written informed consent. A total of 128 samples were measured, including 81 malignant samples and 47 adjacent surrounding tissue samples.
EPs of tissues were measured using the OCP method and the measurement system mainly consists of the following components: a vector network analyzer (VNA, 3680A, Ceyear Technologies Co., Ltd, China), a coaxial cable with a characteristic impedance of 50 Ω, a laptop, a 20 cm coaxial probe (with an outer diameter of 3.58 mm and a central conductor diameter of 0.91 mm), and a thermometer (VC6801, Victor Technologies Co., Ltd, China), as shown in Figure 2.

Figure 2. The experimental setup of this work, including a laptop, a thermometer, a vector network analyser, the calibration liquid, the sample to be measured, and the open-ended coaxial probe.
Before the measurements, calibration was performed at the tip of the probe, including open circuit, short circuit, and deionized water. The open circuit termination was achieved by suspending the probe tip in air, while the short circuit termination was established by making contact between the probe tip and an indium sheet under appropriate pressure [25]. The probe was securely fixed on a metal stand to ensure its stability during the measurement process. A lift table was used to adjust the position of the sample, ensuring proper contact between the tissue sample and the probe for surface measurements. In addition, to minimize the impact of pressure variation on the measurement results, we monitored the S-parameter response on the VNA throughout the measurement process. A noticeable change in the S-parameter indicated the initial contact between the probe and the sample. We then applied slight additional pressure until no further changes were observed in the S-parameter curve, at which point the contact was considered stable.
In this study, a frequency range from 50 MHz to 4 GHz (3,951 points in total) was selected. This range was chosen to mitigate electrode polarization effects at low frequencies [25], meet the requirements of high-field MREPT applications, and provide sufficient bandwidth for accurate Cole-Cole fitting. Freshly excised malignant tissues and adjacent surrounding tissues from patients undergoing tumor resection surgery were measured. To ensure the accuracy of the measurements, the sample were immediately transported to the measurement room after excision. Before the measurement, any blood on the tissue surface was gently removed using clean, sterile gauze to avoid interference from blood or chemical agents. Measurement sites were then promptly selected, and data acquisition was completed within approximately 5 minutes after resection. Temperature was recorded before starting the measurements. The malignancy or benignity of the tissue at the measurement points was initially assessed by a pathologist based on experience. After the measurements were completed, the samples were further examined by a pathologist for histological confirmation.
The reconstruction algorithm based on transmission line theory converts the reflection coefficient into the complex permittivity of the tissue [28]. In this theory, the relationship between the EPs and the reflection coefficient is expressed in Equation 1:
where
To convert the discrete frequency-point EPs into continuous EPs and enhance the applicability of the measurement data, this study employed the widely used Cole-Cole model to fit the data from 81 glioma samples and 47 samples of adjacent surrounding tissue. To improve fitting accuracy and determine the appropriate model complexity, both first- and second-order Cole-Cole models were evaluated (see Supplementary Figure S1; Supplementary Table S1). Based on this evaluation, the second-order Cole–Cole model was adopted in this study [30], as shown in Equation 2:
here,
For comparison, we referred to the study by Lu et al. [27], in which the EPs of gliomas and adjacent surrounding tissues from five patients were measured. To estimate the EPs at the Larmor frequencies (64, 128, 213, and 298 MHz), we interpolated and averaged Lu et al.’s data, allowing for consistent comparison with our own measurements.
2.2 Electromagnetic simulation
A human model from the IT’IS database was used, comprising 94 distinct tissue types [31]. To reduce computational complexity, we truncated the human model at the chin. The truncated head model had a spatial resolution of 0.51 × 0.51 × 1 mm3 and included 26 different tissue types. We assigned the EPs of glioma and adjacent surrounding tissues as measured by Lu et al. and this study to the model. Simulations were then performed at 1.5 T, 3 T, 5 T, and 7 T. The model consisted of two concentric spherical regions, with the inner sphere (with a radius of 13 mm) representing the glioma and the outer sphere (with a radius of 18 mm) representing the surrounding peritumoral tissue, designed to approximate realistic dimensions as described in [32]. The EPs for other tissues were referenced from the work of Gabriel et al. [24–26]. Subsequently, the realistic head model was loaded in a 16-leg birdcage coil employed as both the transmit and receive coil. Numerical simulations were performed using the FDTD method, with the electromagnetic solver Sim4Life (Zurich MedTech, Zurich, Switzerland). The simulations were conducted for transmission and reception in both quadrature (QA) and anti-quadrature (AQ) modes, as reported in previous literature [20].
The birdcage coil had a diameter and length of 280 mm. The head model was positioned at the center of the coil, which was excited using Gaussian voltage-current pulses centered at 64, 128, 213, and 298 MHz, with corresponding bandwidths of 96, 192, 320, and 447 MHz. The excitation was applied via two voltage sources, tuned using a ring capacitor, with a 90° phase shift between them. For each configuration, the input power was normalized to 1 W.
2.3 Performance evaluation
In this study, to ensure the reliability of the measurement system and the accuracy of the results, we conducted a detailed uncertainty analysis, including both Type A and Type B uncertainties, as described in the Guide to the Expression of Uncertainty in Measurement (GUM) [33]. For Type A uncertainty, we performed six independent repeated measurements of the EPs of a methanol solution. The percentage standard deviation of the mean (SDM) EPs was calculated at each frequency point. For Type B uncertainty, we assessed the accuracy of the measurement system and the effectiveness of the calibration method by comparing the measured values of the methanol solution (
To evaluate the impact of different simulation parameters on the magnetic field, we compared the RF electromagnetic field step-by-step in the electromagnetic model using the relative differences (RD), defined in Equation 3:
Here,
3 Results
3.1 Measurement uncertainty
Following the method described in Ref. [33], we evaluated the uncertainty of the measurement system by measuring the methanol solution and calculating the standard uncertainty based on the standard deviation of the mean (SDM) and the deviation from the reference values. The corresponding results are summarized in Table 1. Temporal drift was excluded as an independent component of uncertainty, as repeated measurements performed at 30-min intervals confirmed that its contribution was negligible (see Supplementary Figure S2). The analysis of inter-subject variability and tissue heterogeneity across 14 patients is presented in Supplementary Tables S2–S4, respectively.

Table 1. The uncertainty of the relative permittivity and conductivity of the methanol solution at the Lamor frequency, which is expressed as a percentage of the relevant parameters for all terms.
3.2 EPs of gliomas and adjacent surrounding tissues
We measured the freshly excised glioma tissues from 14 patients, obtaining a total of 81 malignant tissue samples (MT) and 47 adjacent surrounding tissue samples (ST). The average EPs for the MT and ST are shown in Figures 3A,B, with standard deviations represented by error bars. The Cole-Cole model was individually fitted to each of the 128 samples. The resulting fitting parameters are listed in Supplementary Tables S5, S6, and the reconstructed EPs based on these parameters are illustrated in Supplementary Figures S3, S4.

Figure 3. EPs measurement results of MT and ST with error bars indicating the standard deviation. (A) Relative permittivity and (B) conductivity. For clarity, only 40 representative frequencies are displayed, sampled at approximately 100 MHz intervals from the full dataset of 3,951 frequency points.
3.3 Comparison with previous works
The EPs at the Larmor frequencies are presented in Tables 2, 3. We reported statistical indicators including the mean, standard deviation (SD), and the intervals from the minimum to the maximum values. Compared to previously published data, the MT and ST values obtained in this study exhibit observable differences. To further assess these differences, we performed statistical comparisons using Welch’s t-tests. The results indicate that, overall, our dataset is significantly different from that of Lu et al. (see Supplementary Table S7). Notably, the values obtained in this work are consistently higher across the entire frequency range and encompass the data reported by Lu et al.

Table 2. The mean ± SD of the relative permittivity of gliomas and adjacent surrounding tissues, as well as the intervals from the minimum to the maximum.

Table 3. The mean ± SD of the conductivity of gliomas and adjacent surrounding tissues, as well as the intervals from the minimum to the maximum (Unit: S/m).
3.4 Distribution of RF electromagnetic fields
To intuitively present the simulation results based on the EPs measured in this study, Figures 4, 5 visualize the spatial distributions of the
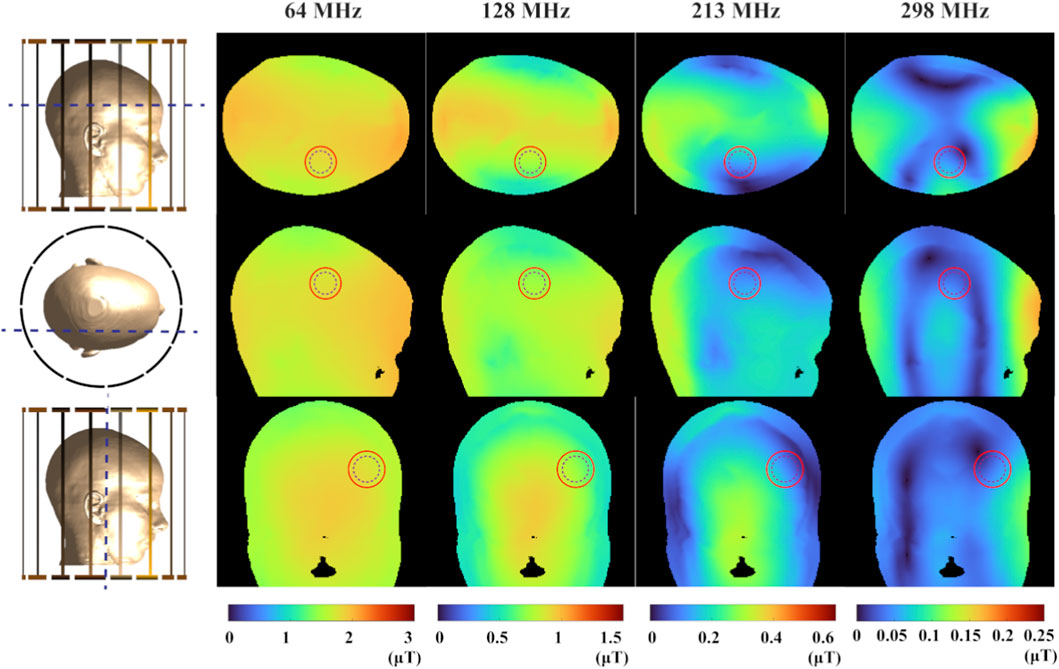
Figure 4. The magnitude distribution of the
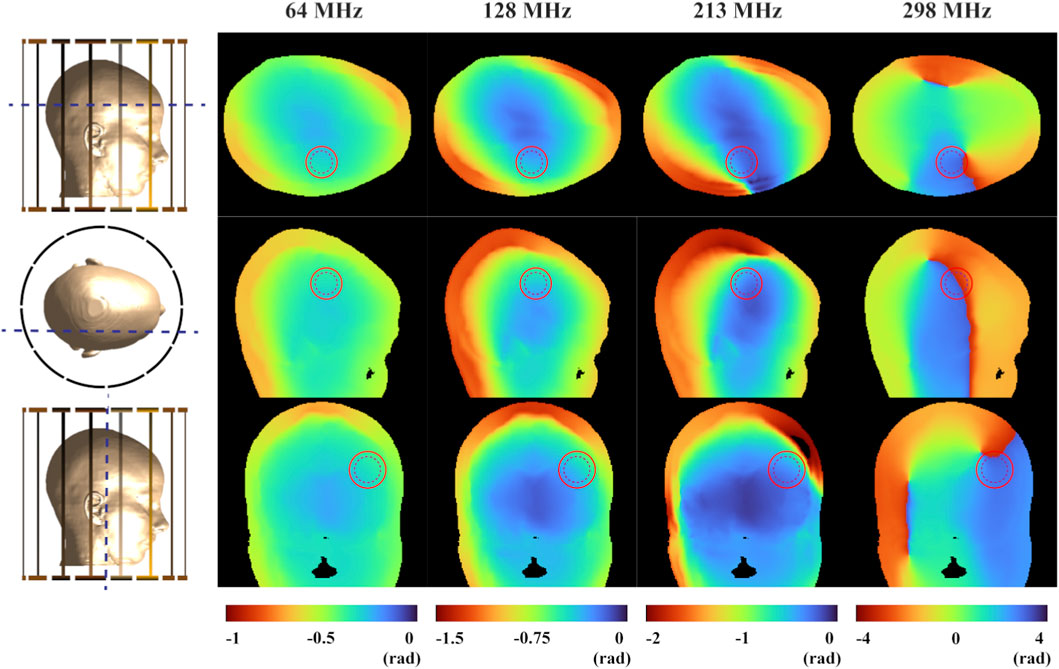
Figure 5. The phase distribution of the
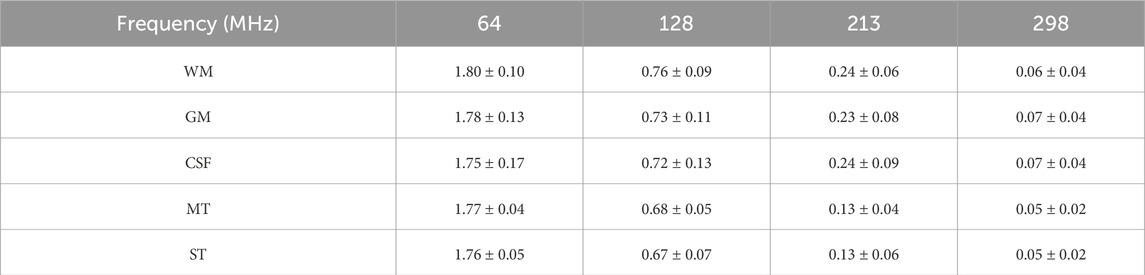
Table 4. The mean ± SD of the
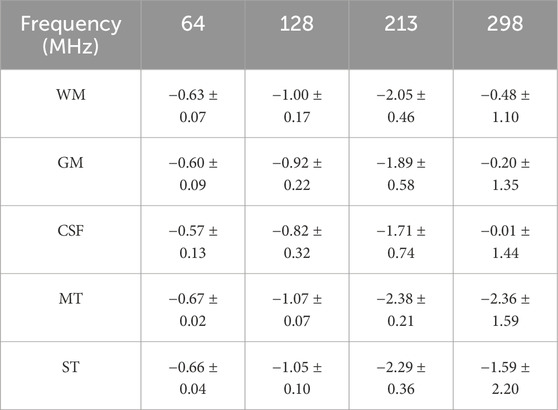
Table 5. The mean ± SD of the

Table 6. The RD of
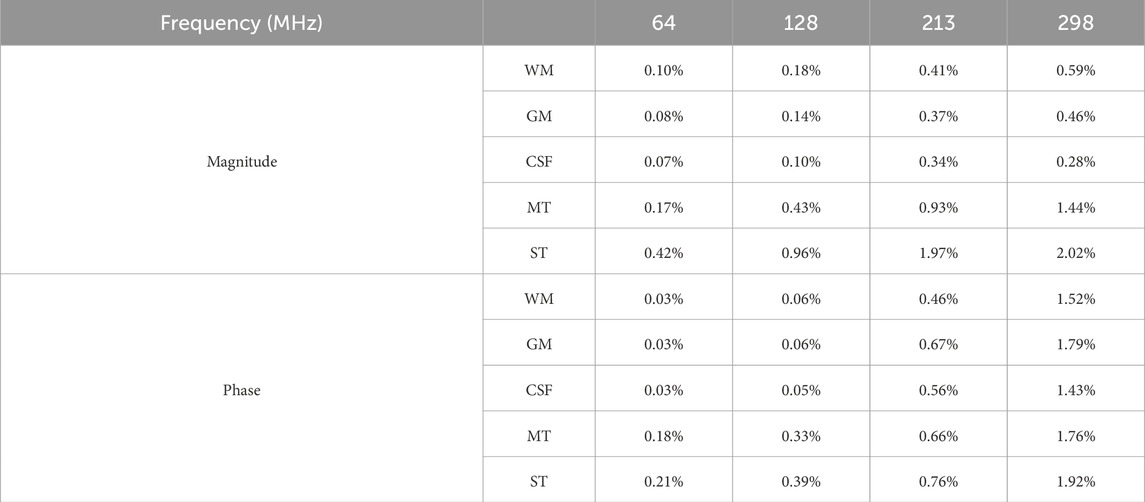
Table 7. The RD of
4 Discussion
This study aims to provide EPs of gliomas tailored for EPT. Using the OCP method, we measured EPs of glioma within the 50 MHz-4 GHz range from 128 samples. To ensure the accuracy of the measurement data, the total uncertainty of the methanol solution was calculated. The Cole-Cole model was applied to obtain fitting parameters for the EPs of both tumor and adjacent surrounding tissues, allowing for the reconstruction of EPs across the full frequency range. Four Larmor frequencies were selected: 64 MHz, 128 MHz, 213 MHz, and 298 MHz. We reported differences in EPs compared to previous studies and evaluated the impact of these differences on the simulated
In this study, the robustness of the measured EPs values was confirmed through standardized measurement procedures and a dedicated uncertainty evaluation. First, we adopted the OCP method, which is widely used for measuring the EPs of biological tissues due to its broad frequency range and well-documented accuracy. Secondly, the reliability of the measurement system and the accuracy of the obtained EPs were evaluated through a dedicated uncertainty analysis based on methanol calibration measurements. Specifically, when quantifying the deviation between the measured and reference values of methanol, a rectangular distribution was assumed to account for potential underestimation or overestimation. The uncertainty intervals were set to (0, 0.80] for permittivity and (0, 0.03] for conductivity. These values reflect the combined effects of instrumental repeatability and reference deviation, as detailed in Table 1. Temporal drift was excluded as an independent component of uncertainty, as repeated measurements conducted at 30-min intervals confirmed its negligible contribution (as shown in Supplementary Figure S2). It is worth noting that the uncertainty associated with biological tissue measurements was not included in the formal uncertainty budget, as such variability is largely influenced by sample heterogeneity and inter-subject differences. In fact, as illustrated in Table 1; Supplementary Tables S2–S4, the uncertainty observed in methanol measurements is generally lower than the variability arising from tissue heterogeneity and individual differences. Notably, the measurement uncertainty of conductivity at lower frequencies (e.g., 64 MHz and 128 MHz) was found to be relatively higher compared to other frequency ranges. This behavior may reflect the inherent challenges of OCP techniques under such conditions, where the sensitivity to conductivity decreases and signal-to-noise ratio is reduced at lower frequencies. Despite these exceptions, the overall uncertainty remains lower than the biological variability observed across samples in most cases. This is primarily attributed to the structural complexity and inherent heterogeneity of biological samples. Specifically, such variability arises from multiple factors, including tumor cell density, vascular structure, the presence of necrosis, and patient-specific physiological conditions, even within a single lesion [34, 35]. These can lead to measurable differences in the EPs of gliomas and adjacent surrounding tissues. The quantification of this type of variability not only provides more realistic training boundaries for data-driven models, but also offers potential EPs-based markers for glioma identification in clinical settings. However, it is important to note that these findings highlight the need for future efforts in data-driven modeling or EPT reconstruction to place greater emphasis on biological variability, rather than focusing solely on reducing instrumental error. Incorporating the EPs distribution observed across different tissue locations and subjects may lead to more robust and generalizable simulation outcomes.
We compared the EPs of glioma and adjacent tissues obtained in this study with those reported by Lu et al., as shown in Tables 2, 3, and found that the values reported in the earlier study are consistently lower. Moreover, the range between the minimum and maximum values in our data indicates that our measurements encompass the EPs reported in the previous study. This discrepancy may be attributed to the limited sample size in Lu’s work, which included only five patients. While the values reported in the literature can serve as a useful reference, such a small sample size may fail to capture the variability of the data, thereby reducing its reliability. We measured the EPs of 128 samples, covering all the EPs measured in their study. Therefore, our results are more generalizable and widely applicable. In addition, the EPs in our study were measured across broad frequencies range from 50 MHz to 4 GHz, covering commonly used Larmor frequencies. In contrast, the measurements reported by Lu et al. were limited to the 5–500 MHz range and provided data at only 12 discrete frequency points: 5, 20, 39, 65, 91, 128, 180, 253, 300, 356, 422, and 500 MHz. Due to the sparsity and limited number of frequency points in their dataset, directly fitting a Cole-Cole model led to substantial fitting errors in certain tissue samples. Therefore, to estimate the EPs at specific frequencies relevant to our analysis—namely 64 MHz, 213 MHz, and 298 MHz—we opted for interpolation as a relatively better alternative. However, it should be noted that interpolation may still introduce model-related errors and reduce accuracy. This is particularly the case when the spacing between available frequency points is large, as sparse data limits the precision and reliability of the interpolated values.
As inherent characteristics of human tissues, EPs play a decisive role in the propagation and distribution of electromagnetic fields. As shown in Tables 6, 7, even when only the EPs of the glioma and surrounding tissues are modified in the simulation settings, the resulting magnetic fields across the entire region are affected. In addition, since EPs are frequency-dependent, this property may also influence the simulated magnetic field distributions. As observed in Tables 6, 7, an overall trend of increasing RD between tissues can be observed as frequency increases. It is worth noting that this trend may result from a combination of factors, including increased
Importantly, the most pronounced field differences are primarily located in the tumor and adjacent surrounding tissues, which are the areas of greatest clinical interest for EPT. These findings quantitatively illustrate the response of simulated
In our electromagnetic simulations, we used a truncated head model to reduce computational requirements. Although this approach retains the intracranial geometry necessary for evaluating glioma-related EPs and speeds up the simulation process, it alters the current propagation paths and introduces boundary effects at the truncation plane, which may lead to overestimation or underestimation of the local magnetic field in the neck region [36]. It is important to note that the focus of this study is to analyze the influence of different EPs on the B1 field within the brain, where our conclusions remain valid within a reasonable range.
This study was conducted using ex vivo measurements. However, it is important to note that ex vivo conditions are fundamentally different from in vivo environments. Although we minimized potential errors by performing measurements quickly and recording tissue temperature before each acquisition, deviations from physiological values may still occur. These deviations can result from tissue dehydration, structural degradation, and temperature changes after resection. Previous studies have shown that the EPs of biological tissues are temperature dependent. For example, Bao et al. reported that, between room temperature and body temperature, the temperature coefficient for rat brain tissue ranged from −0.4% to +2% per degree Celsius for permittivity, and from −2% to +2% per degree Celsius for conductivity [37]. Schmid et al. also observed similar values in porcine gray matter at 0.9 and 1.8 GHz [38]. We acknowledge this as a limitation of our current measurement approach. In future work, to improve the physiological relevance of our data, we plan to develop a temperature compensation model based on polynomial fitting. Specifically, we will measure the EPs of the same tissue samples under controlled temperature conditions and fit their temperature dependence using first- or second-order polynomial models [39, 40]. This will allow us to estimate EPs at physiological temperatures with improved accuracy.
In clinical MR system, there exists a tendency to enhance magnetic field strength gradually since the signal-noise-ratio and image resolution improved along with the magnetic field increased [41]. Notably, the EPs data obtained in this study are not only applicable to existing MRI field strengths. This work provided parameters of Cole-Cole model to compute EPs at specific frequency, exhibiting excellent scalability to support the glioma research in EPT using future higher-field-strength equipment. In addition, the EPs maps presented in this study can be directly incorporated into electromagnetic simulations to improve patient-specific RF field modeling in MRI- or microwave-based interventions. In EPT applications, accurate tissue EPs are essential, which may reveal tumor boundaries, infiltration, or treatment response. Such information can assist surgeons in precisely delineating and removing tumor tissue. To bridge the gap between ex vivo findings and clinical application, future work will focus on in vivo validation of these EPs using MR-EPT. Such validation is critical to ensure the consistency of EPs under physiological conditions and to support their integration into routine clinical workflows.
5 Conclusion
This study provides accurate EPs data for gliomas specifically for data-driven EPT research. We obtained the fitting parameters through the Cole-Cole model, allowing us to derive EPs across the full frequency range, including all Larmor frequencies. These data not only improve the simulation accuracy but also lay the foundation for more precise diagnosis and treatment planning of gliomas. In future work, we plan to continue collecting more data on gliomas to further advance clinical diagnosis and treatment.
Data availability statement
The raw data supporting the conclusions of this article will be made available by the authors, without undue reservation.
Ethics statement
The studies involving humans were approved by the Ethics Committee of Anhui Medical University. The studies were conducted in accordance with the local legislation and institutional requirements. The participants provided their written informed consent to participate in this study.
Author contributions
CY: Conceptualization, Data curation, Formal Analysis, Investigation, Methodology, Software, Supervision, Validation, Visualization, Writing – original draft, Writing – review and editing. YJ: Conceptualization, Data curation, Software, Validation, Visualization, Writing – review and editing. WC: Data curation, Writing – review and editing. GL: Data curation, Writing – review and editing. WJ: Data curation, Writing – review and editing. XH: Writing – review and editing. XL: Writing – review and editing. FH: Writing – review and editing. JH: Funding acquisition, Writing – review and editing.
Funding
The authors declare that financial support was received for the research and/or publication of this article. This work is supported by the Scientific research fund project of Anhui Translational Medicine Research Institute (Grant No. 2023zhyx-C15), the Hefei Natural Science Foundation Funded Project (No. 202338), and the Shenzhen Science and Technology Program (No. JCYJ20220530160210023).
Acknowledgements
The authors would like to thank all study participants and the Center for Scientific Research of School of Biomedical Engineering, Anhui Medical University for valuable help in our experiment. Thanks to the First Affiliated Hospital of Anhui Medical University for providing valuable clinical data support.
Conflict of interest
The authors declare that the research was conducted in the absence of any commercial or financial relationships that could be construed as a potential conflict of interest.
Generative AI statement
The authors declare that no Generative AI was used in the creation of this manuscript.
Any alternative text (alt text) provided alongside figures in this article has been generated by Frontiers with the support of artificial intelligence and reasonable efforts have been made to ensure accuracy, including review by the authors wherever possible. If you identify any issues, please contact us.
Publisher’s note
All claims expressed in this article are solely those of the authors and do not necessarily represent those of their affiliated organizations, or those of the publisher, the editors and the reviewers. Any product that may be evaluated in this article, or claim that may be made by its manufacturer, is not guaranteed or endorsed by the publisher.
Supplementary material
The Supplementary Material for this article can be found online at: https://www.frontiersin.org/articles/10.3389/fphy.2025.1553958/full#supplementary-material
References
1. Hand JW. Modelling the interaction of electromagnetic fields (10 MHz–10 GHz) with the human body: methods and applications. Phys Med Biol (2008) 53:R243–86. doi:10.1088/0031-9155/53/16/R01
2. Collins CM, Wang Z. Calculation of radiofrequency electromagnetic fields and their effects in MRI of human subjects: RF field calculations in MRI. Magn Reson Med (2011) 65:1470–82. doi:10.1002/mrm.22845
3. Holder DS. Detection of cerebral ischaemia in the anaesthetised rat by impedance measurement with scalp electrodes: implications for non-invasive imaging of stroke by electrical impedance tomography. Clin Phys Physiol Meas (1992) 13:63–75. doi:10.1088/0143-0815/13/1/006
4. Balidemaj E, Kok HP, Schooneveldt G, Van Lier ALHMW, Remis RF, Stalpers LJA, et al. Hyperthermia treatment planning for cervical cancer patients based on electrical conductivity tissue properties acquired in vivo with EPT at 3 T MRI. Int J Hyperthermia (2016) 32:558–68. doi:10.3109/02656736.2015.1129440
5. George MS, Lisanby SH, Sackeim HA. Transcranial magnetic stimulation. Arch Gen Psychiatry (1999) 56:300–311. doi:10.1001/archpsyc.56.4.300
6. Cook IA, Espinoza R, Leuchter AF. Neuromodulation for depression. Neurosurg Clin N Am (2014) 25:103–16. doi:10.1016/j.nec.2013.10.002
7. Zurbuchen U, Poch F, Gemeinhardt O, Kreis ME, Niehues SM, Vahldieck JL, et al. Determination of the electrical conductivity of human liver metastases: impact on therapy planning in the radiofrequency ablation of liver tumors. Acta Radiol (2017) 58:164–9. doi:10.1177/0284185116639765
8. Haacke EM, Petropoulos LS, Nilges EW, Wu DH. Extraction of conductivity and permittivity using magnetic resonance imaging. Phys Med Biol (1991) 36:723–34. doi:10.1088/0031-9155/36/6/002
9. Hafalir FS, Oran OF, Gurler N, Ider YZ. Convection-reaction equation based magnetic resonance electrical properties tomography (cr-MREPT). IEEE Trans Med Imag (2014) 33:777–93. doi:10.1109/TMI.2013.2296715
10. Katscher U, Voigt T, Findeklee C, Vernickel P, Nehrke K, Dössel O. Determination of electric conductivity and local SAR via B1 mapping. IEEE Trans Med Imag (2009) 28:1365–74. doi:10.1109/TMI.2009.2015757
11. Liu J, Zhang X, Schmitter S, Van De Moortele P, He B. Gradient-based electrical properties tomography (g EPT): a robust method for mapping electrical properties of biological tissues in vivo using magnetic resonance imaging. Magn Reson Med (2015) 74:634–46. doi:10.1002/mrm.25434
12. Balidemaj E, Van Den Berg CAT, Trinks J, Van Lier ALHMW, Nederveen AJ, Stalpers LJA, et al. CSI-EPT: a contrast source inversion approach for improved MRI-based electric properties tomography. IEEE Trans Med Imag (2015) 34:1788–96. doi:10.1109/TMI.2015.2404944
13. Lee S-K, Bulumulla S, Hancu I. Theoretical investigation of random noise-limited signal-to-noise ratio in MR-based electrical properties tomography. IEEE Trans Med Imag (2015) 34:2220–32. doi:10.1109/TMI.2015.2427236
14. Voigt T, Katscher U, Doessel O. Quantitative conductivity and permittivity imaging of the human brain using electric properties tomography. Magn Reson Med (2011) 66:456–66. doi:10.1002/mrm.22832
15. Guo L, Jin J, Liu C, Liu F, Crozier S. An efficient integral-based method for three-dimensional MR-EPT and the calculation of the RF-coil-induced Bz field. IEEE Trans Bio-med Eng (2018) 65:282–93. doi:10.1109/TBME.2017.2763590
16. Van Lier AL, Brunner DO, Pruessmann KP, Klomp DWJ, Luijten PR, Lagendijk JJW, et al. B+1 phase mapping at 7 T and its application for in vivo electrical conductivity mapping. Magn Reson Med (2012) 67:552–61. doi:10.1002/mrm.22995
17. Mandija S, Sbrizzi A, Katscher U, Luijten PR, Van DBCAT. Error analysis of helmholtz-based MR-electrical properties tomography. Magn Reson Med (2018) 80:90–100. doi:10.1002/mrm.27004
18. Wen H. Non-invasive quantitative mapping of conductivity and dielectric distributions using the RF wave propagation effects in high field MRI.
19. Van Lier ALHMW, Raaijmakers A, Voigt T, Lagendijk JJW, Luijten PR, Katscher U, et al. Electrical properties tomography in the human brain at 1.5, 3, and 7T: a comparison study. Magn Reson Med (2014) 71:354–63. doi:10.1002/mrm.24637
20. Mandija S, Meliadò EF, Huttinga NRF, Luijten PR, Den Berg V, et al. Opening a new window on MR-based electrical properties tomography with deep learning. Sci Rep (2019) 9:8895. doi:10.1038/s41598-019-45382-x
21. Gavazzi S, Van Den Berg CAT, Savenije MHF, Kok HP, De Boer P, Stalpers LJA, et al. Deep learning-based reconstruction of in vivo pelvis conductivity with a 3D patch-based convolutional neural network trained on simulated MR data. Magn Reson Med (2020) 84:2772–87. doi:10.1002/mrm.28285
22. Jung K, Mandija S, Cui C, Kim J, Al-masni MA, Meerbothe TG, et al. Data-driven electrical conductivity brain imaging using 3 T MRI. Hum Brain Mapp (2023) 44:4986–5001. doi:10.1002/hbm.26421
23. Giannakopoulos II, Carluccio G, Keerthivasan MB, Koerzdoerfer G, Lakshmanan K, De Moura HL, et al. MR electrical properties mapping using vision transformers and canny edge detectors. Magn Reson Med (2025) 93:1117–31. doi:10.1002/mrm.30338
24. Gabriel C, Gabriel S, Corthout E. The dielectric properties of biological tissues: I. Literature survey. Phys Med Biol (1996) 41:2231–49. doi:10.1088/0031-9155/41/11/001
25. Gabriel S, Lau RW, Gabriel C. The dielectric properties of biological tissues: II. Measurements in the frequency range 10 hz to 20 GHz. Phys Med Biol (1996) 41:2251–69. doi:10.1088/0031-9155/41/11/002
26. Gabriel S, Lau RW, Gabriel C. The dielectric properties of biological tissues: III. Parametric models for the dielectric spectrum of tissues. Phys Med Biol (1996) 41:2271–93. doi:10.1088/0031-9155/41/11/003
27. Lu Y, Li B, Xu J, Yu J. Dielectric properties of human glioma and surrounding tissue. Int J Hyperthermia (1992) 8:755–60. doi:10.3109/02656739209005023
28. Bobowski JS, Johnson T. Permittivity measurements of biological samples by an open-ended coaxial line. Prog Electromagn Res B (2012) 40:159–83. doi:10.2528/PIERB12022906
29. Fornes-Leal A, Garcia-Pardo C, Cardona N, Sergio Castello-Palacios S, Valles-Lluch A. Accurate broadband measurement of electromagnetic tissue phantoms using open-ended coaxial systems. In: 2017 11th international symposium on medical information and communication technology (ISMICT) (Lisbon: IEEE). p. 32–6. doi:10.1109/ISMICT.2017.7891761
30. Constantino G. A program for the fitting of debye, cole–cole, cole–davidson, and havriliak–negami dispersions to dielectric data. J Colloid Interf Sci (2014) 419:102–6. doi:10.1016/j.jcis.2013.12.031
31. Baumgartner C, Hasgall PA, Di Gennaro F, Neufeld E, Lloyd B, Gosselin MC, et al. “IT’IS database for thermal and electromagnetic parameters of biological tissues,” (2024). doi:10.13099/VIP21000-04-2
32. Feucht D, Haas P, Skardelly M, Behling F, Rieger D, Bombach P, et al. Preoperative growth dynamics of untreated glioblastoma: description of an exponential growth type, correlating factors, and association with postoperative survival. Neuro-oncol Adv (2024) 6:vdae053. doi:10.1093/noajnl/vdae053
33. Jcgm J. Evaluation of measurement data—Guide to the expression of uncertainty in measurement[J]. Int Organ Stand Geneva ISBN, (2008), 50: 134. doi:10.59161/jcgm100-2008e
34. La GA, Porter E, Merunka I, Shahzad A, Salahuddin S, Jones M, et al. Open-ended coaxial probe technique for dielectric measurement of biological tissues: challenges and common practices. Diagnostics (2018) 8:40. doi:10.3390/diagnostics8020040
35. Sasaki K, Porter E, Rashed EA, Farrugia L, Schmid G. Measurement and image-based estimation of dielectric properties of biological tissues —past, present, and future. Phys Med Biol (2022) 67:14TR01. doi:10.1088/1361-6560/ac7b64
36. Wolf S, Diehl D, Gebhardt M, Mallow J, Speck O. SAR simulations for high-field MRI: how much detail, effort, and accuracy is needed? Magn Reson Med (2013) 69:1157–68. doi:10.1002/mrm.24329
37. Jian-Zhong B, Lu S-T, Hurt WD. Complex dielectric measurements and analysis of brain tissues in the radio and microwave frequencies. IEEE Trans Microwave Theor Techn (1997) 45:1730–41. doi:10.1109/22.641720
38. Schmid G, Neubauer G, Illievich UM, Alesch F. Dielectric properties of porcine brain tissue in the transition from life to death at frequencies from 800 to 1900 MHz. Bioelectromagnetics (2003) 24:413–22. doi:10.1002/bem.10122
39. Fu F, Xin SX, Chen W. Temperature- and frequency-dependent dielectric properties of biological tissues within the temperature and frequency ranges typically used for magnetic resonance imaging-guided focused ultrasound surgery. Int J Hyperthermia (2014) 30:56–65. doi:10.3109/02656736.2013.868534
40. Lazebnik M, Converse MC, Booske JH, Hagness SC. Ultrawideband temperature-dependent dielectric properties of animal liver tissue in the microwave frequency range. Phys Med Biol (2006) 51:1941–55. doi:10.1088/0031-9155/51/7/022
Keywords: electrical properties (EPs), electromagnetic simulation, glioma, electrical properties tomography (EPT), open-ended coaxial probe (OCP), radiofrequency magnetic field
Citation: Ye C, Jia Y, Chen W, Li G, Ju W, Huang X, Li X, He F and Han J (2025) Measurement of glioma electrical properties for data-driven electrical properties tomography. Front. Phys. 13:1553958. doi: 10.3389/fphy.2025.1553958
Received: 31 December 2024; Accepted: 11 November 2025;
Published: 27 November 2025.
Edited by:
Alex Hansen, NTNU, NorwayReviewed by:
Luca Zilberti, National Institute of Metrological Research, ItalyTaian Jin, Zhejiang University, China
Copyright © 2025 Ye, Jia, Chen, Li, Ju, Huang, Li, He and Han. This is an open-access article distributed under the terms of the Creative Commons Attribution License (CC BY). The use, distribution or reproduction in other forums is permitted, provided the original author(s) and the copyright owner(s) are credited and that the original publication in this journal is cited, in accordance with accepted academic practice. No use, distribution or reproduction is permitted which does not comply with these terms.
*Correspondence: Fang He, aGVmOTQyNEBnbWFpbC5jb20=; Jijun Han, aGFuamlqdW5AYWhtdS5lZHUuY24=