 Guijun Li1,2
 Zhongwei Xiong
 Shanshan Li
- 1Hebei Normal University, Shijiazhuang, China
- 2Center for Global Economy and Sustainable Development, Central University of Finance and Economics, Beijing, China
- 3School of Management Science and Engineering, Central University of Finance and Economics, Beijing, China
- 4School of Management Science and Information Engineering, Hebei University of Economics and Business, Shijiazhuang, China
- 5Institute of Finance and Economics, Central University of Finance and Economics, Beijing, China
Financial infrastructure provides a fundamental guarantee for the sound and efficient operation of financial markets. This paper constructs a provincial-level financial infrastructure resilience evaluation index system, measures the level of financial infrastructure resilience of 31 provinces in China from 2005 to 2020, reveals the dynamic evolution characteristics of financial infrastructure resilience in the spatial and temporal dimensions, and analyzes the barrier factors affecting the dynamic change of financial infrastructure resilience level. The results of the study show that: Provincial financial infrastructure resilience level overall upward trend, in which resilience of risk and control is in a stagnant growth state, resilience of recovery and stability, resilience of transformation and development is on the rise; The level of financial infrastructure resilience and the rate of change generally show a spatial distribution trend of “low west and high east, north-south concave,” with the “wooden barrel effect” evident in the eastern region; Provincial financial infrastructure resilience is in the medium-low coupling stage, affected by the spillover effect is prone to form a “club convergence” phenomenon; The industrial structure, shadow banking risk, real estate liability risk, and fintech level are the main barrier factors to the resilience of financial infrastructure, resilience of risk and control, resilience of recovery and stability and resilience of transformation and development’s barrier degree respectively show a rising, declining, stable trend of change. Therefore, the follow-up should promote the coordinated development of regional finance and form a regional financial development pattern with staggered development and distinctive features; prevent the risks of regional financial infrastructure; and enhance the resilience of risk and control and the resilience of transformation and development.
1 Introduction
The Chinese government attaches great importance to financial security, and has elevated financial infrastructure to a higher strategic position. In 2015, the State Council issued the Circular on the Plan for Promoting the Development of Inclusive Finance (2016–2020), which states that “financial infrastructure is an important pillar and platform for improving the operational efficiency and service quality of financial institutions”. In September 2019, the 10th Meeting of the Central Committee for Comprehensively Deepening Reform considered and adopted the Work Program for Coordinating and Supervising Financial Infrastructure, which pointed out that financial infrastructure is a fundamental guarantee for the sound and efficient operation of the financial market, and an important hand for implementing macro-prudential management and strengthening risk prevention and control. In March 2020, the People’s Bank of China and other six departments jointly issued the Work Program for Coordinating and Supervising Financial Infrastructure The Program further clarified that the scope of coordinated supervision of financial infrastructure includes six types of facilities and their operating institutions, including financial asset registration and custody systems, clearing and settlement systems, trading facilities, transaction report repositories, important payment systems and basic credit systems.
Financial infrastructure undertakes key functions such as payment, clearing, settlement and record keeping in financial market [1], and occupies a pivotal position in the operation of financial market [2, 3]. At present, the research on financial infrastructure at home and abroad is in the stage of transition from the embryonic stage to the development stage. The academic research on financial infrastructure covers the concept and function, risk management, governance and regulation. Risks existing in financial infrastructure have gradually been paid attention to by scholars, including liquidity and operational risks, and facility-associated risks. For example, Berndsen (2017) [4] constructs a financial infrastructure operational risk indicator based on daily transaction data, and then suggests the size of the risk by comparing it with the benchmark number. León (2018) [5] constructs a multilayered network to examine the correlation of systemic risk of Colombia’s financial infrastructures, and finds that the core financial institutions are cross-overlapping in the financial network, and their systemic importance is much higher than that of a single value measured in the network. Wendt (2015) [6] argues that central counterparties are highly interconnected with financial institutions and markets and suggests network analysis to assess potential losses and adopt alternative policy measures to reduce systemic risk. The construction of a multi-level financial infrastructure system by strengthening the integrated regulation of financial infrastructure can help prevent and mitigate financial risks [3, 7]. It has been shown that financial infrastructure has an important impact on economic development and financial stability, and in the context of continuous innovation and change in financial markets, risk management of financial infrastructure has become a hot topic.
With the continuous innovation and globalization of financial markets, the traditional risk management model is no longer able to cope with the challenges faced by increasingly complex financial infrastructures. Scholars have gradually explored how to enhance the resilience and recovery capacity of financial infrastructure when it encounters systemic risk from the perspective of resilience [8–10]. For example, Kass-Hanna (2022) [11] argues that improving digital literacy can increase financial infrastructure resilience, and Saligna (2019) [12] proposes to measure financial infrastructure resilience at the individual level. There are relatively few studies on financial infrastructure resilience, and there is still a lack of in-depth analysis and empirical data to support the performance of financial infrastructures in the face of shocks such as systemic risks, natural disasters, and technological failures, as well as their resilience in the aftermath of shock.
Financial infrastructure resilience refers to the ability of financial infrastructure to adjust its own functional structure in a timely manner according to the objective environment in response to the system’s own and external risk perturbations, and thus continue to provide critical financial services to the market [1]. Exploring the level of financial infrastructure resilience, dynamic evolution characteristics and resilience obstacle factors can not only enrich the knowledge system and theoretical framework in this field, and deeply understand its operation mechanism, risk management, and impact on the financial market, but also provide a powerful guidance for policy making and facility operation. Based on this, this paper intends to construct a financial infrastructure resilience evaluation index system to measure the level of financial infrastructure resilience in 31 provinces and regions of China from 2005 to 2020, and adopt the Dagum Gini coefficient, the degree of coupling coordination, and the spatial Markov chain model to reveal the dynamic evolution characteristics of the resilience of financial infrastructure. On this basis, the barrier degree model is introduced to analyze and determine the barrier factors affecting the dynamic change of the resilience level. The findings of this paper are conducive to the policy and behavioral adjustment of financial infrastructure, and effectively and efficiently improve the level of financial infrastructure resilience.
2 Methods and data sources
2.1 Methods
2.1.1 Entropy method
This paper adopts the entropy method to measure the weights of the indicators of financial infrastructure resilience level. At the same time, in order to ensure that all the indicators involved in the evaluation are comparable, and to avoid meaningless logarithmic calculation when seeking entropy value, this paper adopts the method of standardization of polar deviation, non-negativity of positive and negative indicators, and uniformly assigns a value of 0.01. The specific methods are as follows:
Positive indicators:
negative indicators:
2.1.2 Dagum Gini coefficient
The Dagum Gini coefficient can decompose the overall differences into intra-region differences, inter-region differences and hypervariance densities, which in turn can reveal the relative differences due to the sample spatial overlap problem [13–15]. In this paper, the Dagum Gini coefficient and its decomposition method are used to examine the relative differences in the resilience level of China’s provincial financial infrastructures, and the relevant calculation formula refers to Zhou et al [16, 17].
2.1.3 Degree of coupling coordination
In this paper, the degree of coupling coordination is used to examine the degree of harmonious development of internal components of financial infrastructure resilience and the dynamic development process of the system from disorder to order and from low level to high level gradually under the joint action of multiple internal and external factors. Define the coupling degree formula as:
the coordination degree formula:
Degree of coupling coordination formula:
2.1.4 Spatial Markov chain
This paper introduces the spatial Markov chain [18–20], which classifies the resilience level into four types (low, lower, medium-high, and high) according to the quartiles, denoted by
2.1.5 Barrier degree model
This paper introduces the barrier degree model, which can effectively measure the degree of influence of each barrier factor on the resilience of financial infrastructure. Where the factor contribution degree
2.2 Data sources
This paper explores the spatial-temporal evolutionary pattern of financial infrastructure resilience using 31 provinces in China as the study unit. The data are mainly obtained from official sources such as China Statistical Yearbook, China Financial Yearbook, China Securities Industry Yearbook, while web crawler technology is utilized to obtain supplementary parts of the data. For the missing part of the data, linear interpolation and other methods are used to complete the data. Although most of the data are relatively complete, there are still a small number of missing, such as local government debt data for individual years are missing, this paper uses linear interpolation and other methods to ensure the completeness of the overall data and the accuracy of the analysis.
By analyzing the historical process of China’s financial system reform, it can be found that, after the financial system reform in the 1980s and 1990s, the rapid development of financial subsectors and the initial construction of the pattern of sectoral supervision in the 21st century have gradually formed a complete and well-regulated financial infrastructure system. However, with the rapid development of financial integrated management and Internet finance, the layout of financial infrastructure does not match with the rapidly developing financial environment, and at the same time leads to new regulatory challenges. Based on this, this paper selects 2005–2020 as the research cycle to analyze the spatial-temporal evolution pattern of China’s financial infrastructure resilience.
3 Construction of the indicator system
3.1 Resilience dimension setting
This paper draws on the theory of economic resilience and sets up financial infrastructure resilience sub-dimensions in combination with financial infrastructure functions, including resilience of risk and control, resilience of recovery and stability, and resilience of transformation and development. There is a high degree of correlation between the operation of the economy and the financial system [21–23]. When the financial system is hit, the service capacity of financial institutions is impaired, leading to a decline in the efficiency of social capital allocation, which in turn affects the operation of the real economy. The theory of economic elasticity originated from the study of the ability of the economic system to cope with external shocks, focusing on the system’s ability to resist, recover, and the potential to achieve new development paths through structural optimization and technological innovation [24–26]. Based on the high correlation between the economic system and the financial system, economic resilience provides a feasible perspective for the sub-dimension setting of financial infrastructure resilience. Specifically, as the core pillar of the financial system, the resilience of the financial infrastructure is not only related to the ability to effectively prevent systemic risks, but also directly affects the recovery speed and transformation potential of the financial system in a crisis [27]. Economic resilience theory provides a multi-dimensional and dynamic evolutionary perspective, from the perspective of economic resilience’s shock resistance, recovery and innovation ability, the three dimensions of resilience of risk and control, resilience of recovery and stability, and resilience of transformation and development effectively delineate the resilience of the financial infrastructure, which effectively depicts its adaptive capacity and change potential in the face of complex environments. This framework helps to understand the key role of financial infrastructure in coping with shocks, supporting recovery and promoting transformation, and also provides theoretical support for the stability and development of the financial system in the face of dynamic change.
3.2 Resilience influencing factors
In this paper, with the help of Nvivo14 software, the three-tiered coding system of open coding, axial coding, and selective coding from grounded theory is used to categorize and generalize the factors affecting the resilience of financial infrastructures [28–30]. Open coding is the process of breaking up and then initially aggregating the data information. Based on the research topic, phrases or keywords that may be needed are identified as preliminary conceptual presentations, and then the abstracted concepts are clustered and integrated in constant comparison and form more abstracted categories such as categories. Twenty-six initial categories were obtained through open coding, and due to space constraints, only some of the open coding processes are presented in Table 1.
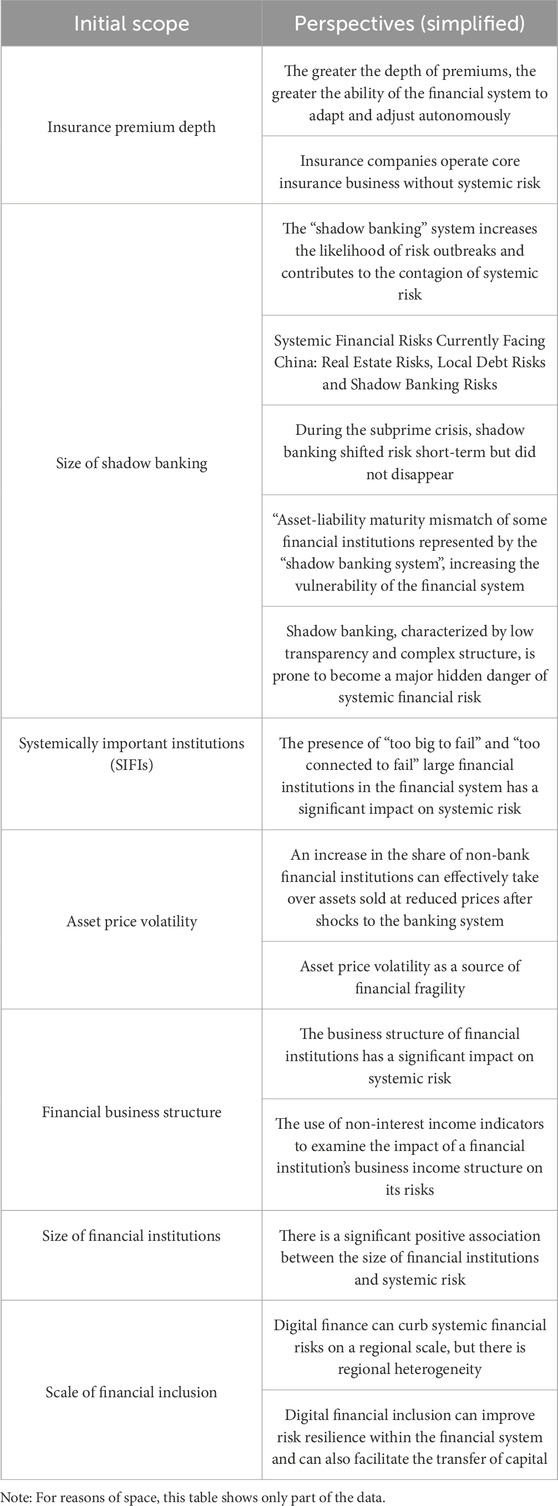
Table 1. Summary of factors affecting the resilience of financial infrastructure.
Axial coding refers to the further work of aggregating the disassembled data material to find new connections that reflect the meanings presented by the categories in a more generalized way. On the basis of open coding, further sorting and generalization is carried out to refine a total of five main categories: financial stability, financial liberalization, macroeconomics, government intervention, and actors. Finally, based on the data availability and word frequency coverage of the initial categories, the system of factors affecting the resilience of financial infrastructure containing 10 initial categories is retained, of which financial stability includes shadow banking scale, insurance depth, and non-performing loan ratio, financial liberalization includes the level of inclusive finance, and fintech level, macroeconomics includes real estate liability risk, and industrial structure, and government intervention includes government debt risk, financial regulatory intensity, and the actors include only information asymmetry.
3.3 Indicator system
Measurement indicators may have impact, resistance, adjustment, and transformation impacts on financial infrastructure, according to the qualitative viewpoints on measurement indicators in the existing literature in the grounded theory, the measurement indicators will be assigned to one of the resilience attributes of impact, resistance, adjustment, and transformation, and the measurement indicators will be matched and corresponded with the guideline layer, which will ultimately constitute the financial infrastructure resilience indicator system as shown in Table 2.
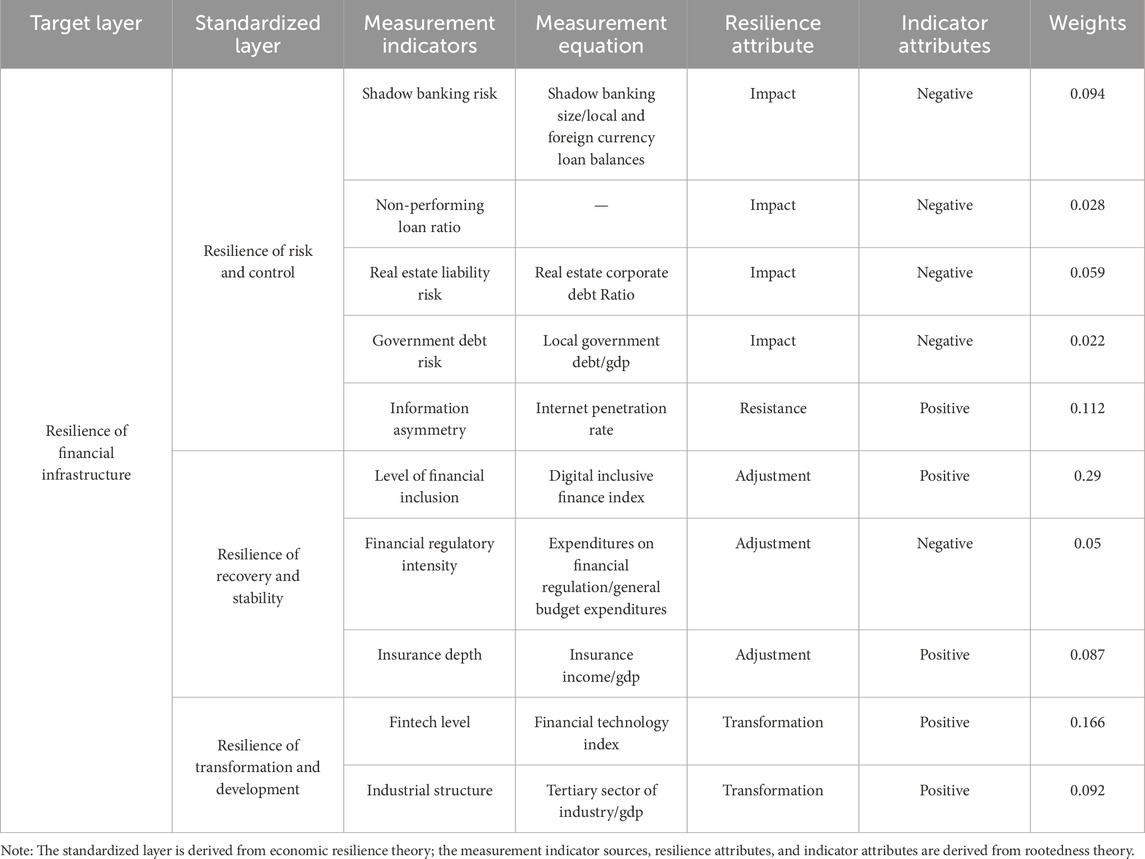
Table 2. Resilience indicator system for financial infrastructure.
Shadow banking is highly hidden, if directly measured and statistics are difficult, financial institutions do not have complete data [31–33]. Therefore, this paper is based on the borrower’s point of view, drawing on the unobserved credit method to calculate the size of shadow banking in 31 provinces, which is expressed by the formula:
where
China’s practice of financial inclusion and innovative digital finance show a strong correlation, and the new digital financial model has become an important source of impetus and growth for financial inclusion, the level of financial inclusion in this paper adopts the Peking University Digital Inclusive Finance Index. The current use of search engine data for modeling has become an effective and widely used research method [34–36], which provides insights into the use of Internet search to construct regional fintech development indicators. This paper utilizes Baidu search fintech related buzzword frequency to construct fintech index to reflect the development level of fintech.
4 Spatial-temporal dynamic evolution of provincial financial infrastructure resilience
4.1 Level of change in the resilience of provincial financial infrastructure
The changes in the resilience level of China’s provincial financial infrastructure are shown in Figure 1. The average value of provincial financial infrastructure resilience increased from 0.159 in 2005 to 0.704 in 2020, showing an overall upward trend. Before 2008, the resilience level has been maintained at a low level. With the subprime crisis, China began to pay attention to the construction of financial infrastructure, and the level of resilience was better improved, however, it began to fall back to a certain extent from 2015.
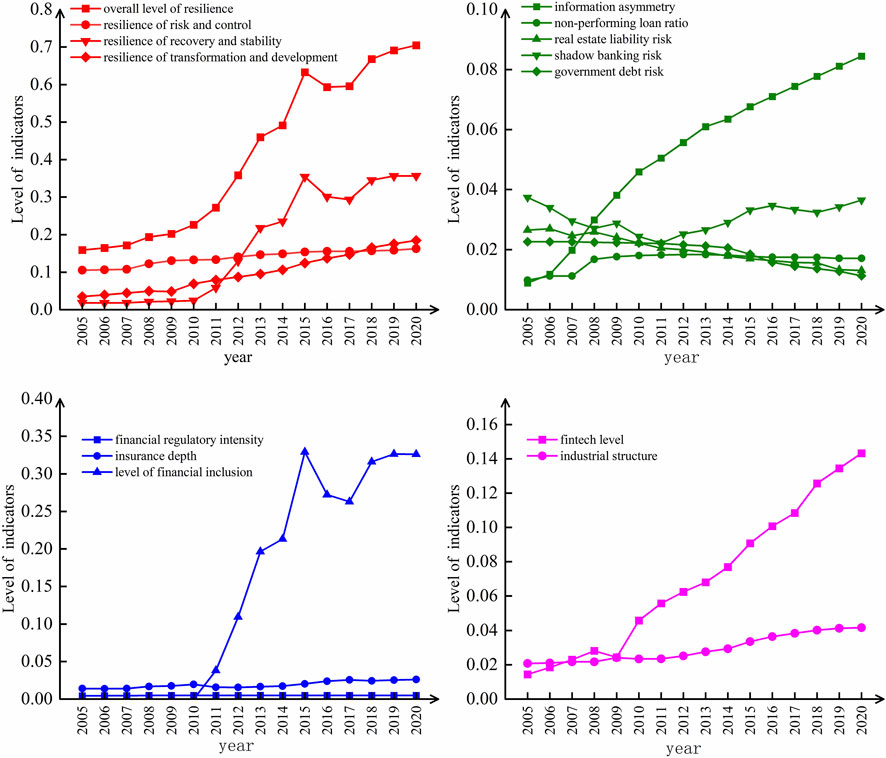
Figure 1. Resilience of China’s provincial financial infrastructure and changes in indicators from 2005 to 2020.
Resilience of risk and control refers to the ability of financial infrastructure to maintain its normal operation in the face of adverse factors interference, as can be seen in Figure 1. Resilience of risk and control is in a state of stagnant growth, with the resilience value rising from 0.105 in 2005 to 0.162 in 2020. In terms of specific sub-indicators, the level of information asymmetry has been mitigated, which has contributed to the enhancement of the risk control resilience, but the shadow banking risk, real estate liability risk, and government debt risk have reduced resilience of risk and control to a certain extent.
Resilience of recovery and stability refers to the ability of the financial infrastructure to better cope with the external environment by adjusting its structure in the face of external disturbances, as can be seen in Figure 1, the resilience of recovery and stability has shown a clear upward trend, with the resilience value rising from 0.018 in 2005 to 0.35 in 2020. The insurance depth and the development of financial inclusion have better contributed to the resilience of recovery and stability, and financial inclusion in particular has played an important role in mitigating external shocks and supporting economic restructuring.
Resilience of transformation and development refers to the ability of financial infrastructure to generate innovative development after continuous adaptation and self-learning, Figure 1 shows that the resilience of transformation and development has shown a slight upward trend, with the resilience value rising from 0.035 in 2005 to 0.18 in 2020. Specifically, the increase in resilience of transformation and development is mainly due to the steady rise in fintech level, compared with the relatively limited impact of the industrial structure on resilience of transformation and development, and fintech level is the main driver of the increase in resilience of transformation and development.
4.2 Spatial-temporal trend in the resilience of provincial financial infrastructures
4.2.1 Trend in spatial variation of financial infrastructure resilience
Based on the global trend analysis method, as shown in Figure 2, this paper plots the spatial trend of financial infrastructure resilience in China’s provincial areas over the entire sample period, as well as the 11th five-year plan, 12th five-year plan and 13th five-year plan periods, by setting the due east and due north directions as the X-axis and Y-axis, and the level of financial infrastructure resilience and the rate of change as the Z-axis.
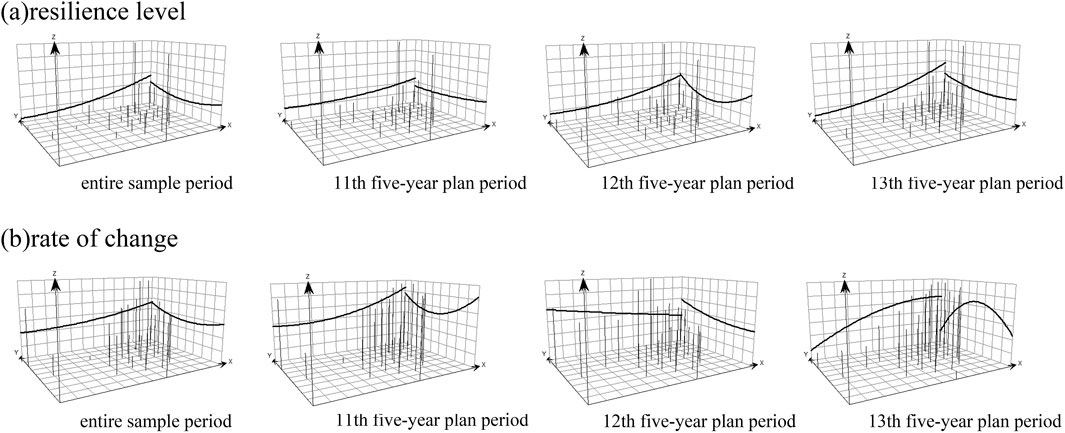
Figure 2. Trends in the spatial distribution of the level and rate of change of financial infrastructure resilience in provincial areas. (A) Resilience level. (B) Rate of change.
Over the entire sample period, as well as the 11th five-year plan, 12th five-year plan and 13th five-year plan periods, the spatial trend of financial infrastructure resilience show similar trends: The resilience level continues to rise from west to east, and shows a U-shaped trend from south to north. In terms of the spatial trend in the rate of change of financial infrastructure resilience, the entire sample period shows a trend of “low west and high east, north-south concave,” but there are differentiation phenomena in different periods. Specifically, from an east-west perspective, the rate of change during the 12th five-year plan period showed a decreasing trend. From a north-south perspective, the 11th five-year plan period showed a U-shaped trend of change, the 12th five-year plan period showed a slight upward trend, and the 13th five-year plan period showed an inverted U-shaped trend of change.
Based on the above analysis, it can be concluded that there are significant spatial variations in the resilience level and rate of change of China’s financial infrastructure, generally showing a “low west and high east, north-south concave” distribution trend, in which the spatial differentiation characteristics rate of rate of change is more obvious.
4.2.2 Spatial differentiation degree and sources of financial infrastructure resilience
The global trend analysis method reveals the absolute differences in the level of financial infrastructure resilience, but it is unable to describe the spatial and temporal evolution of the overall differences in the level of financial infrastructure resilience and the relative differences in China. Dagum Gini coefficient is able to measure the difference in resilience between different subsystems in the financial infrastructure, reflecting the vulnerability and imbalance of the financial system in the face of systemic risk. Based on this, this paper uses the Dagum Gini coefficient to analyze the numerical level of the overall differences in the resilience level of China’s financial infrastructure and its sources, and identifies the changes in the relative differences among the four major economic zones, as shown in Figure 3.
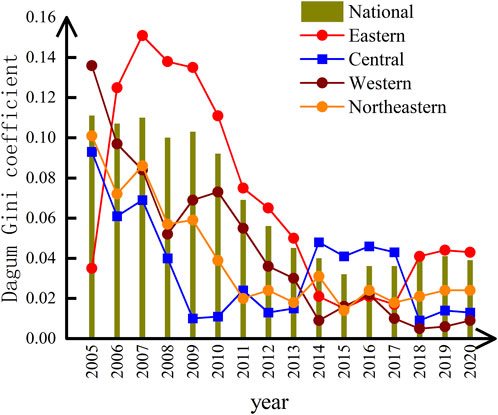
Figure 3. Dagum’s gini coefficient for provincial financial infrastructure resilience from 2005 to 2020.
The results show that, the Dagum Gini coefficient shows Eastern > Western > Northeastern > Central. The Dagum Gini coefficient in the western, northeastern and central regions generally shows a stepped downward trend, and the imbalance of financial infrastructure resilience within the region is narrowing; the Dagum Gini coefficient in the eastern region is significantly higher than other regions, and shows a trend of rising and then declining, which indicates that the resilience of the eastern provinces has a large gap between the level of the provinces, reflecting the obvious “wooden barrel effect”. Therefore, the driving role of financial centers such as Shanghai and Shenzhen should be brought into play to promote in-depth synergies between their financial infrastructures and those of their neighboring provinces, to form a demonstration effect and a radiation effect, and to promote the sharing of resources and the exchange of technology. Secondly, policy guidance and financial support should be increased to promote the rational distribution of financial resources within the eastern region and avoid excessive concentration in some specific cities. In addition, financial institutions can be encouraged to play a more active role in cross-provincial business expansion through the establishment of regional financial cooperation platforms.
By applying the inter-regional Dagum Gini coefficient, this paper deeply explores the spatial differences in the resilience of provincial financial infrastructures among the four major economic zones of China (eastern, northeastern, central, and western) in terms of the overall level and the resilience of risk and control, the resilience of recovery and stability, and the resilience of transformation and development, as shown in Figure 4.
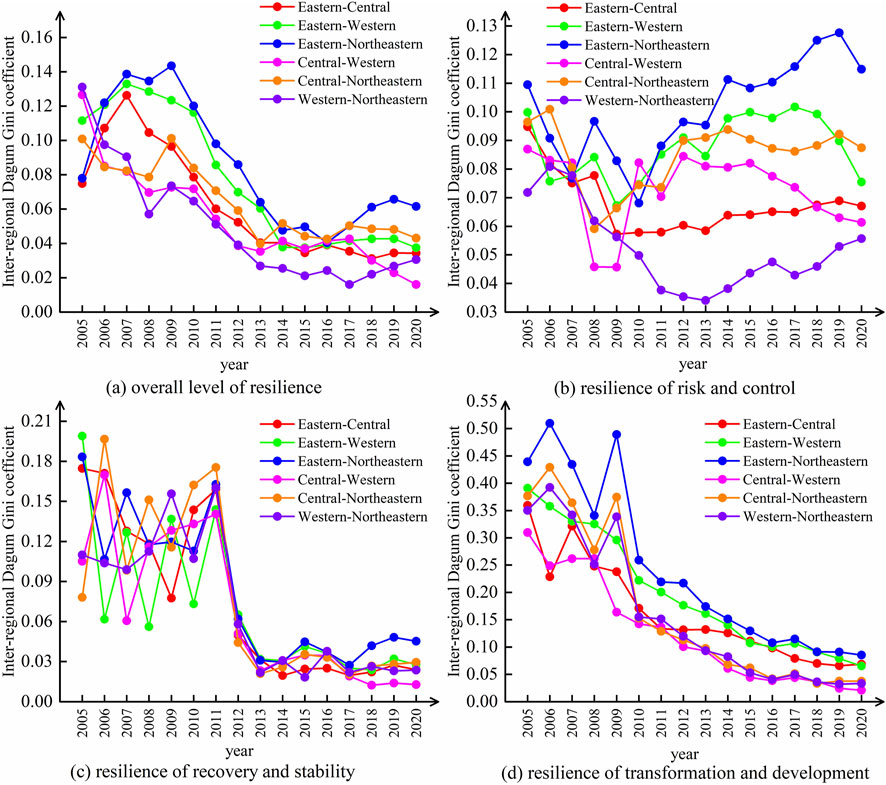
Figure 4. Interregional dagum gini coefficient for provincial financial infrastructure resilience from 2005 to 2020. (A) Overall level of resilience. (B) Resilience of risk and control. (C) Resilience of recovery and stability. (D) Resilience of transformation and development.
In terms of the overall level of resilience, the inter-regional differences roughly show Eastern-Northeastern > Eastern-Western > Central-Northeastern > Eastern-Central > Central-Western > Western-Northeastern, which indicates that Eastern lacks coordination with Northeastern and Western in the development of financial infrastructure resilience, Central has moderate differences with other regions, while Western and Northeastern have lower levels of financial infrastructure resilience and show similar development characteristics. Inter-regional differences show an overall downward trend, with a slight increase after 2017.
In terms of the resilience of risk and control, the inter-regional gap showed a trend of contraction several times from 2005 to 2010, indicating a gradual convergence in the ability of regions to cope with financial risks. However, the gap has been widening since 2010, especially between the eastern and the northeast, and between the eastern and the western, where the gap in risk resilience has become significantly wider. In terms of the resilience of recovery and stability, taking 2011 as the cut-off point, the inter-regional gap can be divided into two stages: before 2011, the gap was larger, and there were significant differences in the ability of regions to recover and stabilize financial services; after 2011, the gap was reduced and showed a wave-like trend of change. In terms of the resilience of transformation and development, except for the jump in inter-regional disparities in 2009, the overall trend is consistently downward, indicating that the differences in the ability of regions to cope with external changes through financial technology and innovation are gradually narrowing.
In terms of the contribution rate of regional disparities, as shown in Figure 5, the overall trend of inter-regional contribution rate is increasing, which indicates that in order to improve the overall level of provincial financial infrastructure resilience, more attention should be paid to inter-regional synergy and global coordinated development. The overall decreasing trend of inter-regional hypervariance density implies that the overlapping of inter-regional provincial samples also affects the spatial-temporal divergence of the resilience level, but the contribution rate of this effect is decreasing. In addition the intra-regional contribution rate consistently fluctuates between 20.14% and 29.13%, which is lower than the inter-regional contribution rate, but it should still be alerted to the divergence of the resilience level of provincial financial infrastructures within the four major economic regions.
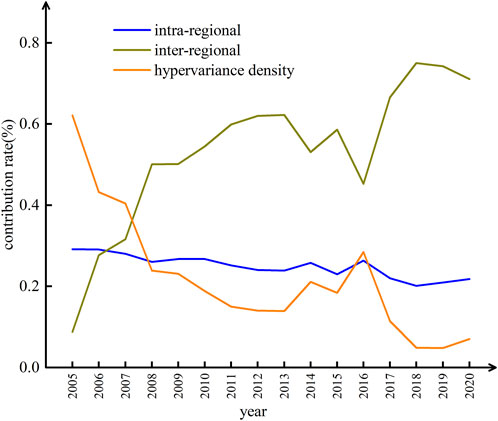
Figure 5. Regional gap contribution to provincial financial infrastructure resilience from 2005 to 2020.
4.3 Dynamic evolutionary characteristics of provincial financial infrastructure resilience
4.3.1 Coupling coordination analysis
The coupling coordination degree is used to portray the dynamic process of the resilience sub-dimension changing from disorder to order and forming a benign development. As shown in Figure 6, during the period from 2005 to 2020, the coupling coordination degree of the 31 provinces has a low degree of dispersion, fewer outliers, and a more consistent type of coupling coordination degree. The boxplot shows a wave-like increase over time, with the average value of coupling coordination degree of 0.193 in 2005 and 0.469 in 2020, and the level of coupling coordination is increasing. Influenced by economic, policy and other objective historical reasons, the financial infrastructure of Beijing and Shanghai enjoys a first-mover advantage, and the coupling coordination degree is always higher than that of other provinces. However, in terms of growth rate, the original low-coupling provinces have a more pronounced rate of increase. At present, the coupling and coordination level of provincial financial infrastructure resilience is still in the low-coupling stage, and there is still much room for improvement in the future.
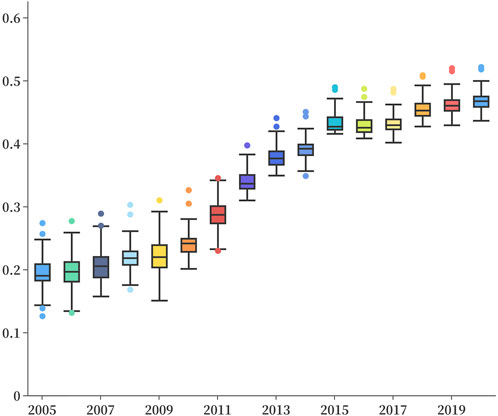
Figure 6. Boxplot of coupled harmonization of provincial financial infrastructure resilience.
Figure 7 shows the kernel density surface of the coupling coordination degree of financial infrastructure resilience for the period from 2005 to 2020. From the figure, it can be seen that the national kernel density curve oscillates to the right during the study period, indicating that the overall level of coupling coordination is improving; the height of the main peak of the kernel density curve is rising, the width is narrowing year by year, and the peak value of the main peak shows a trend of change from a “flat” to a “high” peak; the absolute gap and divergence trend of the coupling coordination level in most provinces are contracting; the right side of the kernel density curve shows a trend of contraction. The right tail of the kernel density curve shows a clear unimodal distribution, with the peak height continuously rising. The “bimodal club” characteristic is evident, indicating a polarization phenomenon in the resilience coupling coordination degree.
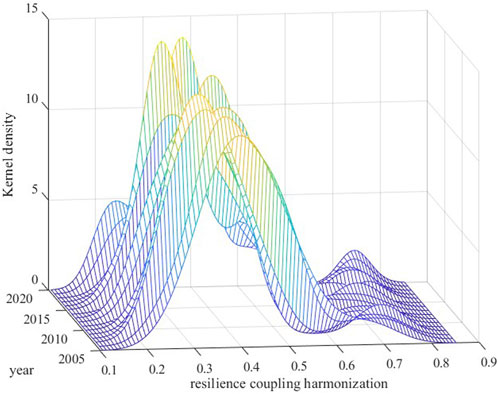
Figure 7. Kernel density surface map of coupled coordination degree of financial infrastructure resilience.
4.3.2 Overall evolution analysis
Spatial Markov chains are able to capture state changes and their interdependence at multiple levels of the financial infrastructure, especially when financial markets are subject to external shocks, and they can effectively reveal the dynamic evolution of different parts of the financial infrastructure and their risk transfer mechanisms. This paper constructs a Markov transfer probability matrix to analyze the overall evolution characteristics of China’s financial infrastructure resilience. Table 3 is the provincial financial infrastructure resilience Markov transfer probability matrix for the period from 2005 to 2020, according to the calculation results show that: the probability value of the diagonal is greater than the probability value of the non-diagonal and more than 60%, which indicates that the transfer of the level of financial infrastructure resilience type has the stability of the transfer, and maintain the original state of the probability of greater. There is a “club convergence” phenomenon in the evolution of China’s financial infrastructure resilience, and the probability that the low resilience and high resilience types will maintain the original state type in the next stage is the greatest, 73.4% and 83.9%, respectively. It is difficult to realize the “leapfrog” development of the transfer of resilience level types in adjacent years, and the probabilities of the low-resilience level, medium-low-resilience level, and medium-high-resilience level jumping up one level are 0.26, 0.25, and 0.37, respectively, which indicate that there is the possibility of upward development of all three levels. Overall, the results confirm the trend of upward development of financial infrastructure resilience levels in various provinces of China over the years, as well as the relative stability of development.
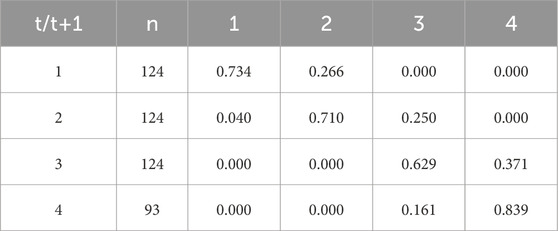
Table 3. Traditional markov transfer probability matrix for financial infrastructure resilience.
On the basis of the traditional Markov transfer probability matrix, the spatial lag condition is introduced to construct the spatial Markov transfer probability matrix, aiming at exploring the influence on the transfer probability of the resilience level type in different spatial lag backgrounds. According to the calculation results in Table 4, it is shown that spatial elements have influence in the evolution of financial infrastructure resilience type, when a province is adjacent to a neighbor with a low level of resilience, the probability of the province’s resilience level type transferring upward decreases, and when adjacent to a neighbor with a high level of resilience, the probability of the province’s resilience level type transferring upward will increase. For example, when in the condition of a neighborhood with a low resilience level, P11|1(0.822)>P11(0.734), P12|1(0.178)<P12(0.266), while in the condition of a neighborhood with a high resilience level, P34|4(0.421)>P34(0.371), P44|4(0.855)>P44(0.839). The spatial Markov transfer probability matrix provides an explanation for the “club convergence” phenomenon in the spatial dimension. Influenced by the spillover effect of neighborhood types, the transfer of financial infrastructure resilience types is prone to form the phenomenon of “club convergence” within a certain geospatial range.
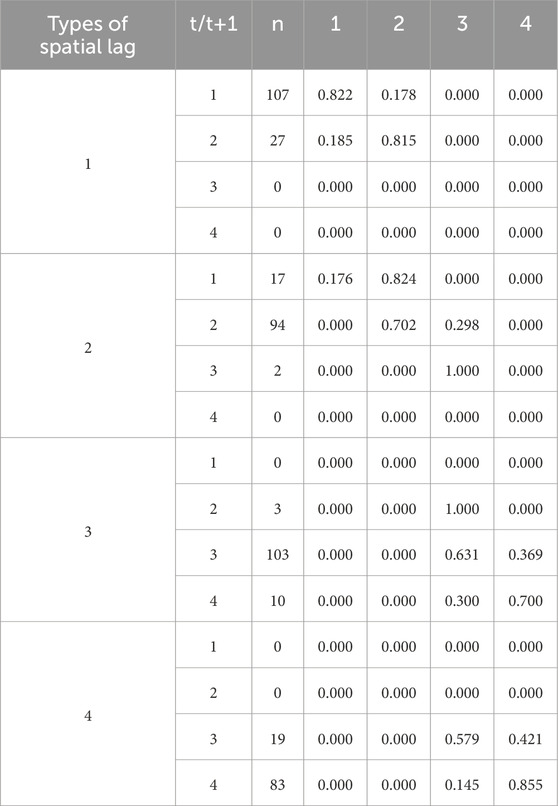
Table 4. Spatial markov transfer probability matrix for financial infrastructure resilience.
4.4 Barrier factor analysis
After analyzing the coupling coordination and overall evolution of provincial financial infrastructure, further research to identify the barrier factors influencing the dynamic changes in resilience levels can not only provide a deeper understanding of the characteristics of resilience level changes but also offer strong support for formulating financial system policies and behavioral adjustments, thereby effectively improving the resilience of financial infrastructure. This paper uses barrier degree model to measure the barrier degree of factors affecting financial infrastructure resilience from 2005 to 2020.
From the perspective of the barrier degree of individual indicators as shown in Table 5, the barrier degree of the proportion of industrial structure, shadow banking risk, real estate liability risk, and fintech level has risen significantly, while the barrier degree of the level of financial inclusion and information asymmetry has shown a downward trend, and the barrier degree of the intensity of financial regulatory intensity has not fluctuated significantly.
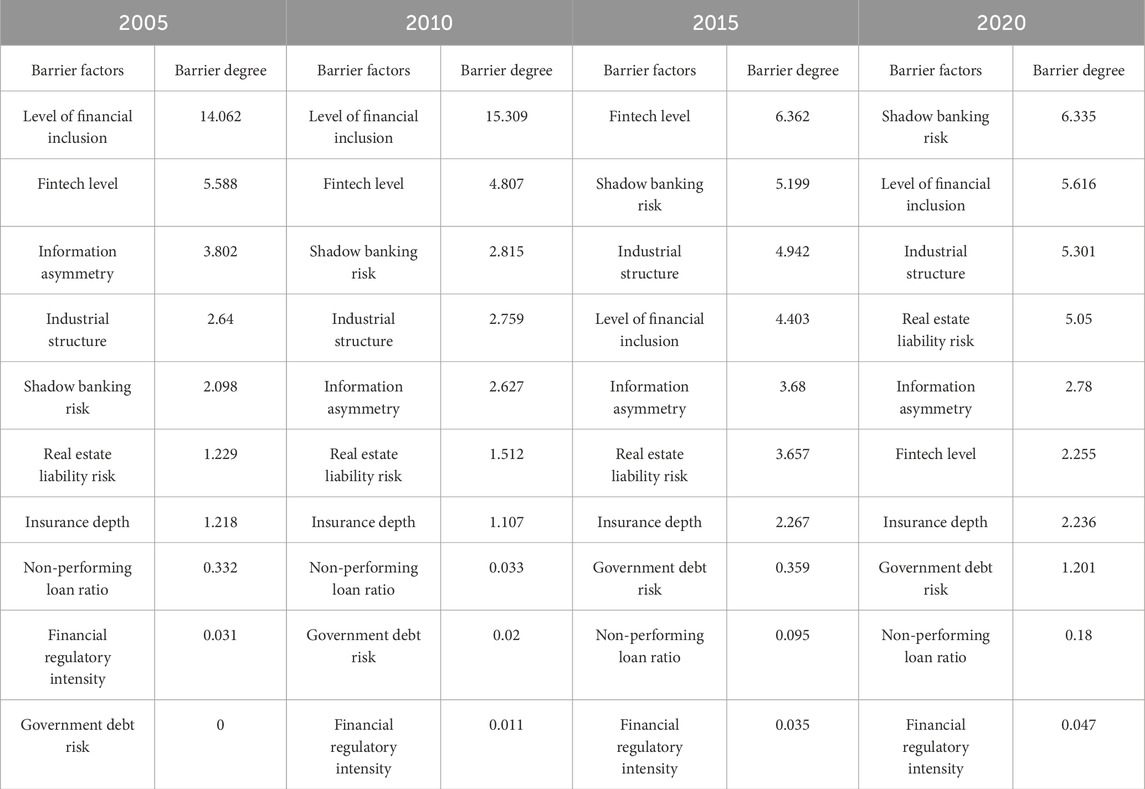
Table 5. Main barrier factors to the resilience of provincial financial infrastructure from 2005 to 2020.
In terms of the barrier degree of the financial infrastructure resilience sub-dimension as shown in Figure 8, the barrier degree of resilience of risk and control is on an upward trend, indicating that the ability of the financial infrastructure to resist unexpected external shocks is weakening. The downward trend in the resilience of recovery and stability suggests that after years of development, the adaptive capacity of the financial infrastructure to cope with crises is increasing. The barrier degree of resilience of transformation and development has not fluctuated much, suggesting that the financial infrastructure’s momentum in innovative development is relatively weak.
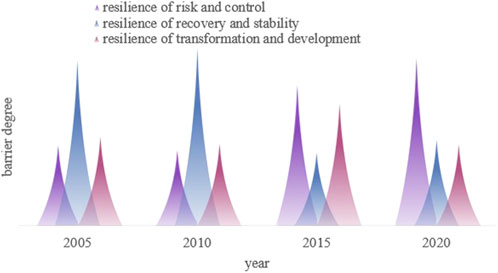
Figure 8. Provincial financial infrastructure resilience subsystem Barriers from 2005 to 2020.
5 Conclusion
This paper takes the 31 provinces of China from 2005 to 2020 as the research units, constructs an evaluation index system for provincial financial infrastructure, and measures the resilience levels. On this basis, the Dagum Gini coefficient, spatial Markov chain, and barrier degree are used to analyze the variation level, spatial-temporal differentiation, and dynamic evolution characteristics of provincial financial infrastructure resilience. The main conclusions are as follows.
(1) the resilience level of financial infrastructure across China’s provinces shows an overall upward trend, but a decline in resilience is observed after 2015. From the perspective of resilience sub-dimensions, resilience of risk and control is in a state of slow growth, resilience of recovery and stability shows a significant upward trend, while resilience of transformation and development exhibits little fluctuation and no clear upward trend.
(2) In terms of spatial-temporal differentiation characteristics, the level of financial infrastructure resilience and the rate of change roughly shows “low west and high east, north-south concave” distribution trend, the rate of change of the spatial differentiation characteristics are more obvious. Dagum Gini coefficient shows that the East > West > Northeast > Central, the eastern region of the financial infrastructure resilience level gap is larger, the “wooden barrel effect” is obvious. The inter-regional contribution rate is much higher than the intra-regional contribution rate and hypervariable density, and is on the rise. The hypervariable density contribution rate shows a decreasing trend, which means that the impact of interregional provincial samples overlapping and thus causing differences in resilience levels is decreasing. The intra-regional contribution rate maintains a small fluctuation between 20.14% and 29.13%, which should alert to the divergence of the resilience level of the financial infrastructure of the provincial regions within the region.
(3) From the perspective of dynamic evolution characteristics, the coupling coordination degree of resilience sub-dimensions is rising in a wave-like manner, but is still in the medium-low coupling stage. The transfer of the type of financial infrastructure resilience level in China is stable, influenced by the spillover effect of the type of neighborhood, and prone to the formation of the “club convergence” phenomenon within a certain geospatial range.
(4) From the perspective of barrier factors, there is a significant increase in the barrier degree of industrial structure, shadow banking risk, real estate liability risk, and fintech level. Resilience of risk and control, resilience of recovery and stability and resilience of transformation and development barrier degree show a rising, falling and stable trend of change, respectively.
Although this study thoroughly explores the evolutionary characteristics of provincial financial infrastructure resilience and its influencing factors, there are still some limitations. First, limited by data availability, this paper mainly considers the frequency and accessibility of data when constructing the indicator system, which may affect the precision of the resilience assessment. In addition, the study does not fully consider the short-term impact of sudden external shocks on the resilience of financial infrastructures, and the role of these factors can be further explored in the future. Although fintech is considered an important influence on resilience, this study fails to quantify its specific impact, and the differentiated role of fintech among different provinces could be analyzed in depth in the future. The above limitations provide room for improvement and direction for future research.
Data availability statement
The data analyzed in this study is subject to the following licenses/restrictions: The data are not publicly available. Requests to access these datasets should be directed to emhvbmd3ZWlfODZAMTYzLmNvbQ==.
Author contributions
GL: Writing–review and editing. ZX: Writing–original draft. CK: Writing–review and editing. SL: Writing–review and editing.
Funding
The author(s) declare that financial support was received for the research, authorship, and/or publication of this article. This work was supported by the National Natural Science Foundation of China (Grant Nos 72374063 and 72304089).
Conflict of interest
The authors declare that the research was conducted in the absence of any commercial or financial relationships that could be construed as a potential conflict of interest.
Generative AI statement
The author(s) declare that no Generative AI was used in the creation of this manuscript.
Publisher’s note
All claims expressed in this article are solely those of the authors and do not necessarily represent those of their affiliated organizations, or those of the publisher, the editors and the reviewers. Any product that may be evaluated in this article, or claim that may be made by its manufacturer, is not guaranteed or endorsed by the publisher.
References
1. León C, Berndsen R, Renneboog L. Financial stability and interacting networks of financial institutions and market infrastructures. European Banking Center Discussion Paper Series, (2014-011) (2014).
2. Li F, Perez-Saiz H. Measuring systemic risk across financial market infrastructures. J Financial Stab (2018) 34:1–11. doi:10.1016/j.jfs.2017.08.003
3. Martin R. Regional economic resilience, hysteresis and recessionary shocks. J Econ Geogr (2012) 12(1):1–32. doi:10.1093/jeg/lbr019
4. Berndsen R, Heijmans R. Risk indicators for financial market infrastructure: from high frequency transaction data to a traffic light signal (2017).
5. Berndsen RJ, León C, Renneboog L. Financial stability in networks of financial institutions and market infrastructures. J Financial Stab (2018) 35:120–35. doi:10.1016/j.jfs.2016.12.007
6. Wendt F. Central counterparties: addressing their too important to fail nature. International Monetary Fund (2015).
7. Lee R. Running the world's markets: the governance of financial infrastructure. Princeton University Press (2010).
8. Peter Gray H. The quality of financial infrastructure and financial resilience: contrasting Taiwan and Thailand. Rev Pac Basin Financial Markets Policies (2002) 5(02):181–94. doi:10.1142/s0219091502000778
9. Dupont B. The cyber-resilience of financial institutions: significance and applicability. J cybersecurity (2019) 5(1):tyz013. doi:10.1093/cybsec/tyz013
10. Costabile L, Neal L (2018). Financial innovation and resilience. A comparative perspective on the public banks of naples (1462-1808).
11. Kass-Hanna J, Lyons AC, Liu F. Building financial resilience through financial and digital literacy in South Asia and Sub-Saharan Africa. Emerging Markets Rev (2022) 51:100846. doi:10.1016/j.ememar.2021.100846
12. Salignac F, Marjolin A, Reeve R, Muir K. Conceptualizing and measuring financial resilience: a multidimensional framework. Soc Indicators Res (2019) 145:17–38. doi:10.1007/s11205-019-02100-4
13. Zhang L, Ma X, Ock YS, Qing L. Research on regional differences and influencing factors of Chinese industrial green technology innovation efficiency based on dagum gini coefficient decomposition. Land (2022) 11(1):122. doi:10.3390/land11010122
14. Ma T, Liu Y, Yang M. Spatial-temporal heterogeneity for commercial building carbon emissions in China: based the Dagum Gini Coefficient. Sustainability (2022) 14(9):5243. doi:10.3390/su14095243
15. Hong H, Liao H, Li T, Yang J, Xie D. Analysis of spatio-temporal patterns of rural space function based on entropy value method and Dagum Gini coefficient. Trans Chin Soc Agric Eng (2016) 32(10):240–8. doi:10.11975/j.issn.1002-6819.2016.10.034
16. Zhou R, Jin J, Cui Y, Ning S, Zhou L, Zhang L, et al. Spatial equilibrium evaluation of regional water resources carrying capacity based on dynamic weight method and Dagum Gini coefficient. Front Earth Sci (2022) 9:790349. doi:10.3389/feart.2021.790349
17. Kakamu K. Simulation studies comparing Dagum and Singh–Maddala income distributions. Comput Econ (2016) 48:593–605. doi:10.1007/s10614-015-9538-z
18. Carle SF, Fogg GE. Modeling spatial variability with one and multidimensional continuous-lag Markov chains. Math Geology (1997) 29:891–918. doi:10.1023/a:1022303706942
19. Dehghan Shabani Z, Shahnazi R. Spatial distribution dynamics and prediction of COVID-19 in Asian countries: spatial Markov chain approach. Reg Sci Pol and Pract (2020) 12(6):1005–26. doi:10.1111/rsp3.12372
20. Shepero M, Munkhammar J. Spatial Markov chain model for electric vehicle charging in cities using geographical information system (GIS) data. Appl Energ (2018) 231:1089–99. doi:10.1016/j.apenergy.2018.09.175
21. Eaker MR, Crane DB, Froot KA, Mason SP, Perold AF, Merton RC, et al. The global financial system: a functional perspective. J Finance (1997) 52:915. doi:10.2307/2329507
22. King RG, Levine R. Finance and growth: schumpeter might be right. Q J Econ (1993) 108(3):717–37. doi:10.2307/2118406
23. Arestis P, Demetriades P. Financial development and economic growth: assessing the evidence. Econ J (1997) 107(442):783–99. doi:10.1111/j.1468-0297.1997.tb00043.x
24. Martin R, Sunley P. On the notion of regional economic resilience: conceptualization and explanation. J Econ Geogr (2015) 15(1):1–42. doi:10.1093/jeg/lbu015
25. Simmie J, Martin R. The economic resilience of regions: towards an evolutionary approach. Cambridge J regions, economy Soc (2010) 3(1):27–43. doi:10.1093/cjres/rsp029
27. Pistor K. A legal theory of finance. J Comp Econ (2013) 41(2):315–30. doi:10.1016/j.jce.2013.03.003
28. Wolfswinkel JF, Furtmueller E, Wilderom CP. Using grounded theory as a method for rigorously reviewing literature. Eur J Inf Syst (2013) 22(1):45–55. doi:10.1057/ejis.2011.51
29. Eisenhardt KM. Building theories from case study research. Acad Manag Rev (1989) 14(4):532–50. doi:10.2307/258557
30. Fernandez WD, Lehmann H. Case studies and grounded theory method in information systems research: issues and use. J Inf Technology Case Appl Res (2011) 13(1):4–15. doi:10.1080/15228053.2011.10856199
31. Barth JR, Li T, Shi W, Xu P. China’s shadow banking sector: beneficial or harmful to economic growth? J Financial Econ Pol (2015) 7(4):421–45. doi:10.1108/jfep-07-2015-0043
32. Chen K, Ren J, Zha T. The nexus of monetary policy and shadow banking in China. Am Econ Rev (2018) 108(12):3891–936. doi:10.1257/aer.20170133
33. Allen F, Qian Y, Tu G, Yu F. Entrusted loans: a close look at China's shadow banking system. J Financial Econ (2019) 133(1):18–41. doi:10.1016/j.jfineco.2019.01.006
34. Xue G, Liu S, Ren L, Gong D. Forecasting hourly attraction tourist volume with search engine and social media data for decision support. Inf Process and Management (2023) 60(4):103399. doi:10.1016/j.ipm.2023.103399
35. Tian F, Yang Y, Mao Z, Tang W. Forecasting daily attraction demand using big data from search engines and social media. Int J Contemp Hospitality Management (2021) 33(6):1950–76. doi:10.1108/ijchm-06-2020-0631
Keywords: financial infrastructure, resilience, dynamic evolution, barrier factors, coupling coordination
Citation: Li G, Xiong Z, Kou C and Li S (2025) Resilience measurement and dynamic evolution of China’s provincial financial infrastructure. Front. Phys. 13:1556285. doi: 10.3389/fphy.2025.1556285
Received: 06 January 2025; Accepted: 29 January 2025;
Published: 19 February 2025.
Edited by:
Ze Wang, Capital Normal University, ChinaReviewed by:
Daniela Feschiyan, University of National and World Economy, BulgariaRaqif Qasimov, Azerbaijan State University of Economics, Azerbaijan
Xinya Wang, University of International Business and Economics, China
Xiaofen Tan, Beihang University, China
Copyright © 2025 Li, Xiong, Kou and Li. This is an open-access article distributed under the terms of the Creative Commons Attribution License (CC BY). The use, distribution or reproduction in other forums is permitted, provided the original author(s) and the copyright owner(s) are credited and that the original publication in this journal is cited, in accordance with accepted academic practice. No use, distribution or reproduction is permitted which does not comply with these terms.
*Correspondence: Chenhuan Kou, a291Y2hjaEBodWViLmVkdS5jbg==