 Jianan Wang
 Gaurav Nayak
 Peter J. Bruggeman
- Department of Mechanical Engineering, University of Minnesota, Minneapolis, MN, United States
Plasma-droplet interactions significantly promote the reactivity transfer of gas phase species from the plasma to the liquid phase. Nonetheless, experimental studies on the impact of droplet evaporation on reactive species generation in such systems remain scarce. We report the spatial distribution of water vapor and OH radical densities around a droplet (∼41 μm in diameter) in He and He-Ar plasma using laser-induced fluorescence. The results reveal a significant gradient in both water vapor and OH radical concentrations near the droplets. Mutiple droplets present in the plasma can lead to a significant accumulation of water vapor and even local quenching of the discharge. The findings are critical for developing a quantitative understanding of plasma-liquid interactions for a broad range of plasma-enabled applications in the liquid phase often involving OH radicals.
1 Introduction
Atmospheric pressure plasma interactions with liquids have been intensively investigated for decades with a strong focus on plasma-produced active species in both gas and liquid phases [1, 2]. The potential applications of plasma-liquid interactions are vast, with a significant impact on human health [3, 4], environmental safety [5, 6], and advanced industries [7, 8]. These applications include ammonia synthesis [9], medicine [10], and water treatment [11]. Among these applications, transporting chemicals from the gas phase to the liquid phase is a limiting factor in maximizing the amount of active species available to enable liquid-phase chemistry [12]. One way to enhance the transport of reactive species from the bulk gas-phase plasma to the liquid interface is to increase the surface-to-volume ratio of the liquid phase [10, 13, 14]. Plasma-droplet interactions offer large surface-to-volume ratios [11]. Nonetheless, the evaporation of liquid water introduces water vapor gradients near the plasma-liquid interface which can highly impact reactive species production [13, 14]. These local changes in gas composition enhance the complexity of the spatial distribution of gas phase reactive species near the interface and result in density gradients which impact species transport. Therefore, the plasma immediately surrounding the droplet is the focus of this work as it has not been experimentally investigated to our knowledge.
We implemented OH laser-induced fluorescence (OH-LIF) to measure the spatial distribution of OH radical and water vapor densities during plasma-droplet interactions. This was achieved leveraging a train of micrometer-sized water droplets passing through a diffuse radiofrequency (RF) atmospheric pressure glow discharge plasma.
2 Plasma source and diagnostic methods
The RF plasma reactor used in this study is described in detail in [13, 15]. The setup consists of two parallel copper electrodes with an inter-electrode gap of 2 mm. We utilized two types of gas compositions: He and He + 17% Ar at a total flow rate of 1 standard liter per minute (slm). The input RF plasma power was fixed at 13 W for the He case and 5.8 W for the He- Ar case. The reactor operates at atmospheric pressure. Plasma generation was achieved using a sinusoidal voltage waveform with a frequency of 13.56 MHz, produced by a function generator (Tektronix AFG3022B) and amplified by an RF amplifier (E&I A150). A matching box (an in-house modified version of the Vectronics HFT-1500) was used to ensure efficient power coupling.
The droplet was produced using a piezoelectric dispenser (MicroFab Technologies Inc. MJ-ATP series) operating at three different frequencies: 10 Hz, 100 Hz, and 1 kHz. The mean initial diameter of the droplet was fixed at approximately 41 ± 2 μm, as measured by microscopic fast-frame imaging (Photron FASTCAM Mini UX50) [15]. The residence time of a droplet in the plasma was determined by droplet imaging and it increased from 8.5 ms to 11.8 ms as the dispensing rate changed from 10 Hz to 1 kHz. The droplet diameter reduction in the plasma channel was measured by this fast-frame imaging camera with a spatial resolution of 1.7 μm/pixel. While the droplet could move significant between different experimental runs and the dispensing needed often to be readjusted, we were able to run continuously experiments for 2 h in which the droplet moved only ∼50 μm.
OH-LIF was implemented to measure the spatial distribution of OH and water vapor densities surrounding the droplet. The OH-LIF setup, described in detail in [16, 17], is shown in Figure 1a. A signal generator (BNC Model 577) synchronizes the droplet dispensing with the laser pulse. The second harmonic output of a Nd:YAG laser (QuantaRay Lab-170-10H, FWHM: 8 ns) at 532 nm pumps a dye laser (Sirah PrecisionScan) to generate a UV laser beam at 282 nm. The laser beam is guided through a polarizer, a half-wave plate, and an aperture to a plano-convex spherical lens (f = 75 mm). The focus point is positioned at a pinhole with a diameter of 250 μm, then collimated by another spherical lens (f = 100 mm). This collimated beam is finally focused by a cylindrical lens (f = 100 mm) and directed into the center of the electrode gap in the plasma reactor. The laser sheet at the focus has a width of 1 mm and a thickness of 100 μm in the z-direction with an energy per pulse of 12.5 μJ. The fluorescence signal is collected by keeping the bottom of the reactor open. A UV-enhanced mirror (Thorlabs PF10-03-F01) placed under the open hole at a 45° angle reflects the signal horizontally. An iCCD camera (Andor iStar 340) is used to capture the fluorescence from the mirror and is equipped with a camera lens (Nikon 105 mm F4.5 UV) and a lens extension (132 mm), providing a spatial resolution of 28 μm/pixel in the horizontal (x-y) plane. A bandpass filter (300 ± 10 nm, 15% transmission) was introduced between the UV-enhanced mirror and the iCCD camera to reduce the background, laser scatter, and plasma emission contribution to the recorded fluorescence signal. Figure 1b shows the strong scattering off the droplet which has a higher intensity than plasma emission and LIF signal. To avoid contributions of droplet-induced Mie scattering to the LIF signal we collected the fluorescence signal at a delay from the start of the laser pulsed as described in [16]. Figure 1c shows that shifting the iCCD camera gate by 15 ns compared to the start of the laser pulsed significantly reduced the scattering signal and allowed us to accurately measure the plasma emission and LIF signal intensities. During the measurement, the droplet position remained fixed. This can be inferred from the scattering-free image in Figure 1c where the “dark” region corresponds to the droplet position and was confirmed to overlap with the droplet scattering position.
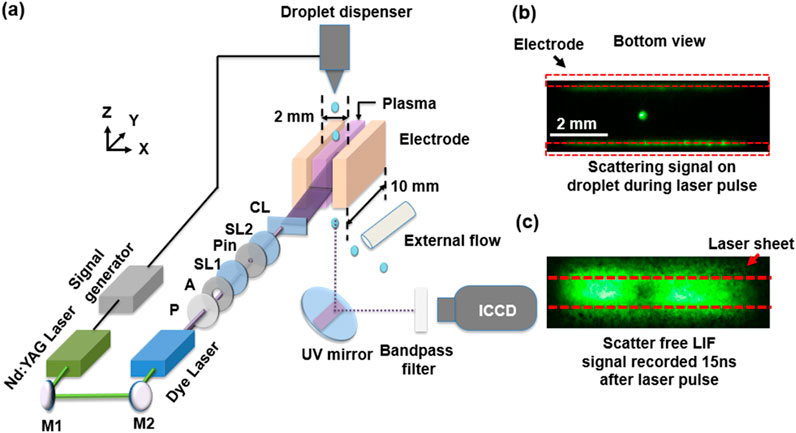
Figure 1. (a) Schematic of the plasma-droplet reactor and OH-LIF setup used in this work. The inserts on the right show iCCD images of the bottom view of the discharge gap with a laser sheet illumination of the droplet area without (b) and with (c) 15 ns delay time compared to the start of the laser pulse. The dashed red rectangles in (b) represent the electrode and the dashed red lines in (c) bound the laser sheet area. M, Mirror; P, Polarizer; A, Aperture; SL1, Spherical lens 1 (f = 75 mm); Pin, Pinhole (D = 250 μm); SL2, Spherical lens 2 (f = 75 mm); CL, Cylindrical lens (f = 100 mm).
The gas temperature was measured using OH-LIF by exciting the following transitions: P1 (2.5), Q1 (3.5), and Q1 (4.5) of OH(X) (ν = 0) to OH(A) (ν = 1), as described in [16]. The camera gate was set to 700 ns [18] to capture the total OH fluorescence for absolute OH measurements, and to 10 ns to measure the fluorescence lifetime of OH(A). Each recorded OH fluorescence image was an accumulation of 1,000 laser pulses. The water vapor concentration was measured using the measured lifetime of OH(A) and a pre-calculated table of effective fluorescence lifetimes of OH(A) as a function of water vapor concentration. With the known gas temperature and water vapor concentrations, spatially resolved OH densities were calibrated with Rayleigh scattering using a 4-level LIF model including corrections for the delayed accumulation of the LIF signal as described in [16]. In this study we assumed a homogeneous gas temperature equal to 400 K to avoid an impact of local inaccuracies in gas temperatures, particularly in regions with lower OH LIF intensities. We estimate a maximum error of 20% for the water concentration and 3% for the OH density due to this assumption (see Supplementary Material). In addition to the fluorescence signal, plasma emission imaging was performed using the same detection system and optics. Time-averaged data are collected with an accumulation time of 20 s.
3 Results and discussion
In previous work, we have shown that the experimentally measured reduction in droplet size as a function of the droplet residence time in a plasma can be accurately described by a droplet evaporation model assuming a homogeneous helium gas background at given gas temperature [15]. The model considers the transport of heat to the droplet to overcome the latent heat of evaporation in the evaporation process and the diffusion of water vapor away from the droplet interface. On a timescale of milliseconds, this would lead with a typical diffusion constant of water vapor in helium to diffusion lengths scales on the order of 1 mm. Hence, one anticipates a significant water vapor concentration gradient near the droplet with a corresponding gradient in OH density that can be interrogated by LIF.
Figure 2 (1st row) shows the plasma emission for the 4 cases introduced in Table 1. As the gas flow rate is fixed in this work, the droplet residence time in the plasma remains relatively constant for all conditions between 8.7 and 11.8 ms. Water vapor evaporating from droplets has a localized impact on plasma dynamics and at the low droplet dispensing rate (10 Hz) it has a limited impact on the time-averaged emission intensity of the discharge [13]. In the He- Ar plasma, the emission near the sheath is more pronounced. As the droplet dispensing rate increases in the He- Ar plasma, the plasma emission is partially quenched at the center of the reactor along the droplet trajectory. This quenching effect corresponds to the location at which water vapor is present as shown in Figure 2 (2nd row).
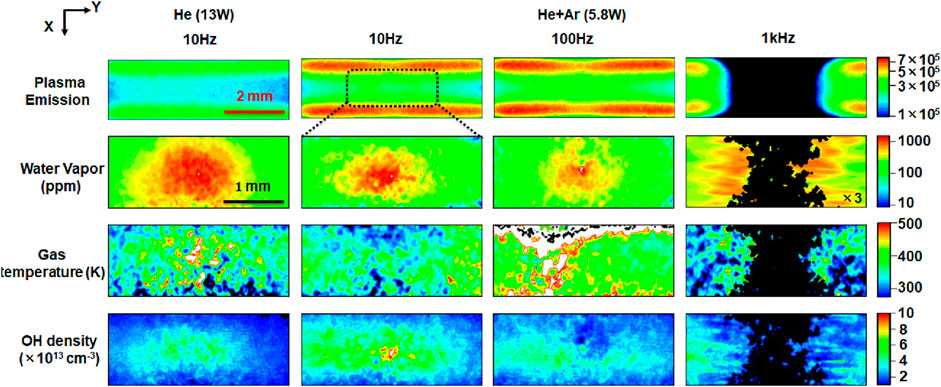
Figure 2. Time-averaged plasma emission, water vapor concentrations, gas temperatures, and OH densities for the 4 cases reported in Table 1. Plasma emission images are recorded for the full interelectrode distance while the other images show the enlarged dashed area as indicated in the upper figure. White and black regions in the temperature plots represent data that are above 500 K and below 300 K, respectively, while regions for which the LIF intensity is too low to be analyzed, temperature or density measurements are indicated in black. The reported water vapor concentration for the 1 kHz case is reduced by a factor of 3 to match the color scale.
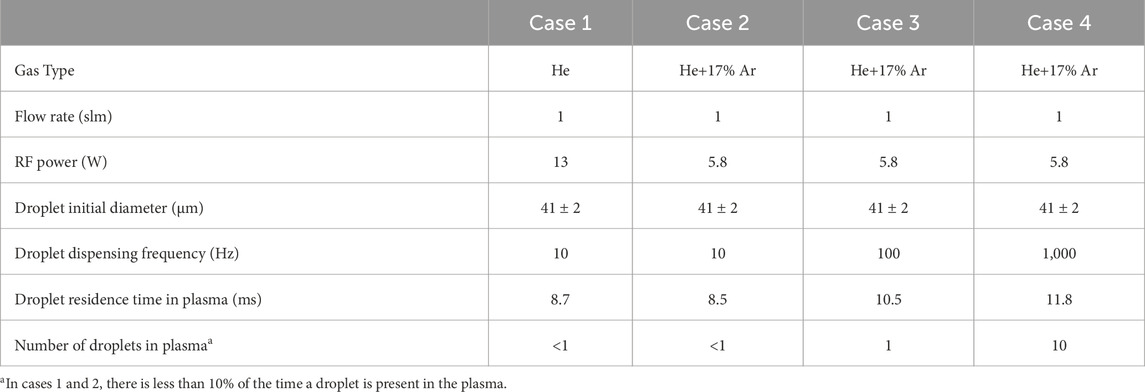
Table 1. Experimental parameters of the investigated conditions of the RF plasma and droplet dispensing system.
The He-Ar gas mixture at a 1 kHz droplet dispensing rate exhibits the highest water vapor concentration ∼3,000 ppm. This is attributed to the presence of 10 droplets in the plasma channel at any time, while in other conditions, at most one droplet is present in the plasma at any time. At the 10 Hz droplet dispensing rate, the water vapor concentrations for both the He and He-Ar cases have a similar maximum concentration of around 1,200 ppm. While the full width at half maximum (FWHM) of the water vapor concentration in the direction of the laser beam (y-direction) is similar for He and He-Ar (588 μm and 560 μm respectively), the FWHM in the direction of the electrodes (x-direction) varies with a factor 2.7 (670 μm and 250 μm, respectively). Despite the diffusion coefficient of water vapor in He being 3 times larger than that in Ar [19, 20], only 17% Ar is present in He and diffusion lengths scale with the square root of the diffusion constant. Hence, one expects the spread of the water vapor to be within 10%. The difference in the x-direction is likely enhanced by inhomogeneous gas temperatures. The average gas temperature in the 500 μm × 500 μm zone centered around the droplet is larger for He (380 K) compared to He-Ar (340 K) [Figure 2 (3rd row)] and the reduced gas temperature is particularly more pronounced near the sheaths at the position of the droplet in the He-Ar case, which can both slow down evaporation and diffusion (see also Supplementary Material).
Remarkably, the amount of water vapor for the He-Ar 100 Hz case is similar but a bit smaller than for the 10 Hz case. This is likely due to the reduction in plasma intensity near the droplet, which is expressed in a reduction in the emission intensity near the sheath (Figure 2). The overall weaker LIF signal in this case also led to less accurate gas temperature measurements. When the droplet dispensing frequency was set to 1 kHz, the strong plasma-droplet interaction results in a localized quenching of the plasma [13]. The LIF signal at the center is below the detection limit, allowing gas temperature and concentration measurements only at the sides. Even at the edges, the water vapor concentration is significantly larger than the other investigated cases due to the accumulation of the water vapor by the simultaneous presence of 10 droplets in the plasma.
Figure 2 also shows the OH densities on the 4th row. To understand the local production of OH radicals, we measured the water vapor concentration and OH density in He-Ar with 5.8 W RF plasma without droplet dispensing. The volume averaged values for water vapor concentration and OH radical density are 40 ppm (T = 300 K) to 90 ppm (T = 400 K) and 2.3 × 1012 cm−3, respectively (see Supplementary Material). The OH densities around the droplet in He reach a density of 4 × 1013 cm−3 in a region with a characteristic length similar to the zone of increased water vapor. In the He- Ar case at a 10 Hz droplet dispensing rate, a strong OH density peak was observed around the droplet, with a peak value of more than 1 × 1014 cm−3. The region with an OH density of more than 4 × 1013 cm−3 extends beyond the region with increased water vapor. A similar OH density, although with a less pronounced peak near the droplet, was found for a droplet dispensing rate of 100 Hz. While the LIF signal is too small to measure the OH density near the droplet at a 1 kHz droplet dispensing rate, the OH density away from the droplet, maintains a level of 4 × 1013 cm−3 which seems to slightly decrease towards the center region. This suggests that in this case the OH density near the droplet is lower, consistent with the local quenching of the plasma at these conditions. Overall, these results indicate that the OH production is strongly impacted by the water vapor originating from droplet evaporation.
Figure 3 presents the water vapor concentrations and OH densities surrounding the droplet along its trajectory through the plasma. The measurement was performed for different delays (in a 4 ms range) between the dispensing moment and the laser pulse enabling us to measure the LIF signal at a fixed position while the droplet was moving 4.7 mm along its vertical trajectory. The water vapor distribution shows a sharp decrease from 1,200 ppm at the droplet’s position to less than 150 ppm within 1 mm on either side of the droplet (150 ppm is the peak value of the water vapor along the position of the droplet trajectory, the spatially averaged concentration at 1 mm from the droplet position is only 75 ppm). A notable asymmetry indicates more water vapor in the tail of the droplet’s path, though no significant water vapor accumulation is observed beyond 1 mm from the droplet’s position.
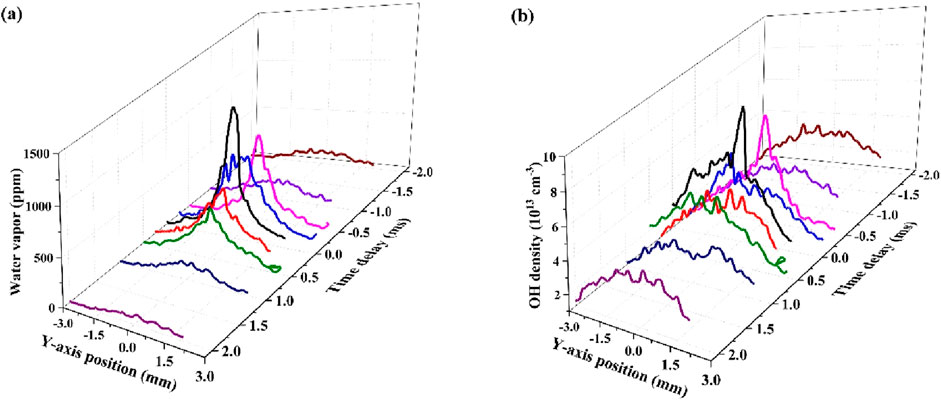
Figure 3. (a) Water vapor concentration, and (b) OH density surrounding a droplet on its trajectory through the plasma measured at a fixed position. The droplet is at the position of the laser pulse at 0 ms and moves 1 mm in ∼0.85 ms. Negative times correspond to the droplet at a position above the measurement position. The average density in the x-direction along the laser sheet is shown. The measurements were conducted in a He-Ar plasma at a droplet dispensing rate of 10 Hz (case 2).
The average droplet diameter loss along the 10 mm trajectory inside the plasma is 7.3% (see Supplementary Material) which corresponds to 1.9 × 10¹⁵ molecules of water. This number of water molecules can fill a spherical region of 2 mm up to a concentration of ∼1,000 ppm. Given the diffusion of water throughout the reactor and the dissociation of water vapor by the plasma, this is in reasonable agreement with the water vapor concentration measurement.
The OH density has a similar profile as the water vapor concentration (Figure 3) consistent with the previously determined square root dependence on the water vapor concentration (∼
4 Conclusion
In this work, we report on the water vapor concentration and OH radical density distribution around a 41 μm water droplet in an RF plasma using LIF. The water vapor concentration around the droplet shows a pronounced gradient. The highest water vapor concentration observed is over 1,200 ppm at the droplet’s position and rapidly decreases to the level found without droplet dispensing with increasing distance from the droplet. The water vapor concentration becomes so large at a droplet dispensing rate of 1 kHz that the plasma is locally quenched. The OH radical density distribution followed a similar trend as the water vapor concentration, with a peak density of 1 × 1014 cm−3 observed near the droplet. However, unlike water vapor, the OH density exhibits an accumulation effect, due to its square root dependence on the water vapor concentration.
Overall, our study shows complex interactions between micro-droplets and He/He-Ar plasma, leading to significant changes in local gas composition and OH radical densities, which are a key oxidizing species in plasma-liquid interactions and might explain enhanced OH-induced reactions for discharges without water vapor addition as found earlier [22]. The findings are critical for a quantitative understanding of plasma-liquid interactions, with potential implications for a broad range of applications. Further stabilization of the droplet, potentially in an optical or acoustic trap combined with microscopic high resolution LIF would enable spatial resolution studies to study species density gradients near the droplet interface with a resolution less than the droplet diameter.
Data availability statement
The raw data supporting the conclusions of this article will be made available by the authors, without undue reservation.
Author contributions
JW: Data curation, Formal Analysis, Investigation, Methodology, Visualization, Writing – original draft. GN: Investigation, Methodology, Writing – review and editing. PB: Conceptualization, Formal Analysis, Funding acquisition, Methodology, Project administration, Resources, Supervision, Writing – review and editing.
Funding
The author(s) declare that financial support was received for the research and/or publication of this article. This material is based upon work supported by the U.S. Department of Energy, Office of Science, Office of Fusion Energy Sciences General Plasma Science program under Award Number DE-SC0020232.
Conflict of interest
The authors declare that the research was conducted in the absence of any commercial or financial relationships that could be construed as a potential conflict of interest.
The author(s) declared that they were an editorial board member of Frontiers, at the time of submission. This had no impact on the peer review process and the final decision.
Generative AI statement
The author(s) declare that no Generative AI was used in the creation of this manuscript.
Publisher’s note
All claims expressed in this article are solely those of the authors and do not necessarily represent those of their affiliated organizations, or those of the publisher, the editors and the reviewers. Any product that may be evaluated in this article, or claim that may be made by its manufacturer, is not guaranteed or endorsed by the publisher.
Supplementary material
The Supplementary Material for this article can be found online at: https://www.frontiersin.org/articles/10.3389/fphy.2025.1592169/full#supplementary-material
References
1. Adamovich I, Agarwal S, Ahedo E, Alves LL, Baalrud S, Babaeva N, et al. The 2022 Plasma Roadmap: low temperature plasma science and technology. J Phys D: Appl Phys (2022) 55:373001. doi:10.1088/1361-6463/ac5e1c
2. Bruggeman PJ, Kushner MJ, Locke BR, Gardeniers JGE, Graham WG, Graves DB, et al. Plasma–liquid interactions: a review and roadmap. Plasma Sourc Sci. Technol. (2016) 25:053002. doi:10.1088/0963-0252/25/5/053002
3. Guo L, Xu R, Gou L, Liu Z, Zhao Y, Liu D, et al. Mechanism of virus inactivation by cold atmospheric-pressure plasma and plasma-activated water. Appl Environ Microbiol (2018) 84:e00726-18. doi:10.1128/aem.00726-18
4. Domonkos M, Tichá P, Trejbal J, Demo P. Applications of cold atmospheric pressure plasma technology in medicine, agriculture and food industry. Appl Sci (2021) 11:4809. doi:10.3390/app11114809
5. Vasilev M, Conlon P, Bohl D, Thagard SM. The effect of discharge frequency of a gas–liquid plasma reactor on bulk liquid transport and removal of organic contaminants. Plasma Chem Plasma Process (2022) 42:759–83. doi:10.1007/s11090-022-10246-2
6. Singh RK, Brown E, Mededovic Thagard S, Holsen TM. Treatment of PFAS-containing landfill leachate using an enhanced contact plasma reactor. J Hazard Mater (2021) 408:124452. doi:10.1016/j.jhazmat.2020.124452
7. Hudgins D, Gambino N, Rollinger B, Abhari R. Neutral cluster debris dynamics in droplet-based laser-produced plasma sources. J Phys D: Appl Phys (2016) 49:185205. doi:10.1088/0022-3727/49/18/185205
8. Yang D-K, Wang D, Huang Q-S, Song Y, Wu J, Li W-X, et al. The development of laser-produced plasma EUV light source. Chip (2022) 1:100019. doi:10.1016/j.chip.2022.100019
9. Toth JR, Abuyazid NH, Lacks DJ, Renner JN, Sankaran RM. A plasma-water droplet reactor for process-intensified, continuous nitrogen fixation at atmospheric pressure. ACS Sustain Chem Eng (2020) 8:14845–54. doi:10.1021/acssuschemeng.0c04432
10. Ning W, Lai J, Kruszelnicki J, Foster JE, Dai D, Kushner MJ. Propagation of positive discharges in an air bubble having an embedded water droplet. Plasma Sourc Sci. Technol. (2021) 30:015005. doi:10.1088/1361-6595/abc830
11. Wang X, Zhao D, Tan X, Chen Y, Chen Z, Xiao H. Discharge characteristics of plasma induced by water drop and its potential for water treatment. Chem Eng J (2017) 328:708–16. doi:10.1016/j.cej.2017.07.082
12. Meyer M, Nayak G, Bruggeman PJ, Kushner MJ. Sheath formation around a dielectric droplet in a He atmospheric pressure plasma. J Appl Phys (2022) 132:083303. doi:10.1063/5.0103446
13. Nayak G, Wang J, Li R, Aranzales D, Thagard SM, Bruggeman PJ. Non-OH-driven liquid-phase chemistry in water microdroplets. Plasma Process Polym (2023) 20:2200222. doi:10.1002/ppap.202200222
14. Kruszelnicki J, Lietz AM, Kushner MJ. Atmospheric pressure plasma activation of water droplets. J Phys D: Appl Phys (2019) 52:355207. doi:10.1088/1361-6463/ab25dc
15. Oinuma G, Nayak G, Du Y, Bruggeman PJ. Controlled plasma–droplet interactions: a quantitative study of OH transfer in plasma–liquid interaction. Plasma Sourc Sci. Technol. (2020) 29:095002. doi:10.1088/1361-6595/aba988
16. Wang J, Bruggeman PJ. OH density, flux and loss probability measurements in a room temperature atmospheric pressure surface discharge by microscopic laser induced fluorescence. Plasma Sourc Sci. Technol. (2023) 32:085016. doi:10.1088/1361-6595/aceff9
17. Yue Y, Kondeti VSSK, Sadeghi N, Bruggeman P. Plasma dynamics, instabilities and OH generation in a pulsed atmospheric pressure plasma with liquid cathode: a diagnostic study. Plasma Sourc Sci. Technol. (2022) 31:025008. doi:10.1088/1361-6595/ac4b64
18. Ershov A, Borysow J. Dynamics of OH (X2 Pi, v=0) in high-energy atmospheric pressure electrical pulsed discharge. J Phys D: Appl Phys (1995) 28:68–74. doi:10.1088/0022-3727/28/1/012
19. O’Connell JP, Gillespie MD, Krostek WD, Prausnitz JM. Diffusivities of water in nonpolar gases. J Phys Chem (1969) 73:2000–4. doi:10.1021/j100726a059
20. Schwertz FA, Brow JE. Diffusivity of water vapor in some common gases the. J Chem Phys (1951) 19:640–6. doi:10.1063/1.1748306
21. Bruggeman P, Cunge G, Sadeghi N. Absolute OH density measurements by broadband UV absorption in diffuse atmospheric-pressure He–H2O RF glow discharges. Plasma Sourc Sci. Technol. (2012) 21:035019. doi:10.1088/0963-0252/21/3/035019
22. Nayak G, Oinuma G, Yue Y, Santos Sousa J. Sousa J S and Bruggeman P J 2021 Plasma-droplet interaction study to assess transport limitations and the role of ⋅OH, O⋅,H⋅,O2(a1Δg),O3, He(23S) and Ar(1s5) in formate decomposition. Plasma Sourc Sci. Technol. (2021) 30:115003. doi:10.1088/1361-6595/ac2676
Keywords: laser induced fluorescence (LIF), plasma-liquid interaction, droplets, OH radical, evaporation
Citation: Wang J, Nayak G and Bruggeman PJ (2025) OH density and water vapor concentration gradients during plasma-droplet interactions. Front. Phys. 13:1592169. doi: 10.3389/fphy.2025.1592169
Received: 12 March 2025; Accepted: 17 April 2025;
Published: 28 April 2025.
Edited by:
Paolo Francesco Ambrico, Istituto per la Scienza e Tecnologia dei Plasmi - CNR, ItalyReviewed by:
Mario Janda, Comenius University, SlovakiaLuca Matteo Martini, University of Trento, Italy
Copyright © 2025 Wang, Nayak and Bruggeman. This is an open-access article distributed under the terms of the Creative Commons Attribution License (CC BY). The use, distribution or reproduction in other forums is permitted, provided the original author(s) and the copyright owner(s) are credited and that the original publication in this journal is cited, in accordance with accepted academic practice. No use, distribution or reproduction is permitted which does not comply with these terms.
*Correspondence: Peter J. Bruggeman, cGJydWdnZW1AdW1uLmVkdQ==