 Kai Li
 Huaquan Su
- Guangzhou Power Supply Bureau, Guangdong Power Grid Co., LTD., Guangdong, China
In the context of deep integration of CPSS (Cyber Physical Social Systems), energy system data presents multi-source, complexity, and dynamic interactivity. To solve the problem of identifying power outage sensitive users, we propose a power outage sensitive user analysis and identification method based on CNN+LSTM. Firstly, perform preprocessing such as cleaning and structuring of power load data to ensure data quality; Next, conduct correlation analysis to explore the intrinsic relationship between the factors and characteristics affecting power load and the sensitivity to power outages; Then, the coefficient correction method is used to extract the user load curve and optimize the feature weights to enhance the adaptability of the model; The final design is a power outage sensitive user recognition model based on CNN+LSTM, which integrates time series and spatial features to achieve accurate recognition of power outage sensitive users. The experimental results show that in multiple experiments covering multidimensional data such as household electricity consumption and energy consumption, this method effectively improves the accuracy of anomaly detection, with an average power outage sensitive user recognition rate of 95.93%. It performs well in key indicators such as recall rate and F1 score, providing strong support for energy system optimization management and user service.
1 Introduction
Power outage sensitive users refer to those users who have special requirements for the continuity and stability of power supply. Once they encounter power outages, they may face serious economic losses, social impacts or safety risks. These users can be roughly divided into several categories: medical facilities such as hospitals and emergency centers, which rely on electricity to maintain the operation of life support systems and other critical medical equipment; financial institutions including banks and stock exchanges, where power outages may lead to trading halts, data loss and huge financial losses; traffic control systems, such as airports, train stations and traffic lights, where power outages may cause traffic chaos or even accidents; communication networks, where power outages affect services such as telephones and the Internet and hinder information transmission; industrial production, especially chemical plants and pharmaceutical companies, where sudden power outages may cause production line pauses, product quality damage or dangerous chemical leaks; special groups in residential areas, such as families using medical equipment such as ventilators, where power outages directly threaten people’s lives and health.
The distribution characteristics of sensitive users and their response patterns to power outages are a complex and multidimensional problem involving factors such as industry type, geographic location, power outage duration, and economic losses. Identifying and classifying these sensitive users is of practical significance to power companies. Under the CPSS framework, smart grids provide new opportunities for optimizing power outage management by integrating information systems (such as big data analytics, IoT technology), physical systems (grid infrastructure), and social systems (user behavior and its socio-economic impact). Recent studies have shown that the integration of IoT, big data, and machine learning technologies can deeply mine user behavior characteristics, identify power outage sensitive users, optimize power grid resource allocation, and improve user service quality. With the development of information technology, power companies have accumulated massive data resources, including electricity consumption behavior, service interaction information, and equipment operation status. Using big data, machine learning, and deep learning algorithms to conduct in-depth analysis of these data can effectively capture the consumption characteristics of power users, identify user groups that are more sensitive to power outages, optimize power outage arrangements, reduce unnecessary power outage time, and improve fault repair strategies. It can more accurately predict which regions and users are most likely to be affected by power outages, and take measures in advance to mitigate potential damage. In addition, big data technology can help us identify weak links in the power grid, optimize the allocation of power resources, and ensure that the power supply needs of the most important users are prioritized under limited resource conditions. At the same time, through a deep understanding of user behavior patterns, power companies can provide more personalized and targeted services, such as customized power outage warnings and emergency response plans, to help users better prepare for and respond to possible power outages. Build a power outage sensitivity prediction model and use machine learning, deep learning and other methods to predict which users may show higher sensitivity in power outage events. According to the user’s sensitivity classification, provide personalized service solutions, such as advance notification and rapid response, to reduce user dissatisfaction and improve the overall power supply service quality. Through collaborative optimization of the CPSS framework, this study aims to improve the accuracy of identifying power outage sensitive users through data-driven methods, reduce socio-economic losses, and enhance user experience.
In order to solve the problem of difficulty in identifying power outage-sensitive users in energy systems, this paper proposes a method for analyzing and identifying power outage-sensitive users using big data technology. This method first preprocesses the power load data, including cleaning and structuring, to ensure the quality of the data. Then, the factors affecting the power load and the intrinsic relationship between the power load characteristics and power outage sensitivity are mined through correlation analysis. Then, the k-means clustering algorithm is used to extract the user load curve, and the coefficient correction is performed to optimize the feature weights to improve the adaptability of the model. Finally, a detection model combining CNN and LSTM is constructed, which can integrate time series and spatial features to accurately identify power outage-sensitive users. Experimental results show that this method significantly improves the accuracy of anomaly detection and the recognition rate of power outage-sensitive users, thereby providing strong support for the optimization management of energy systems and the improvement of user experience.
2 Related work
In recent years, big data-based energy system analysis has made progress in identifying outage-sensitive users. Machine learning and data mining techniques are used to build models, assess user sensitivity and optimize outage management. These studies also focus on real-time data analysis to provide early warning of potential outage risks.
Forootan et al. reviewed the application of machine learning and deep learning in energy systems in [1]. They studied the role of AI in system optimization, prediction and fault detection, and proposed a variety of new algorithms to provide guidance for related research.
In terms of power user classification and behavior analysis, Chicco et al. compared the effectiveness of different clustering algorithms for power customer classification in [2] and found that the improved follow-the-leaders algorithm and the hierarchical clustering algorithm using the average distance link standard were more effective for power customer classification. Huang et al. proposed a core household electricity type recognition method based on deep forest in [3], which improved the generalization ability through feature replacement and sampling balance, and the recognition accuracy reached 94%. Li et al. proposed an intelligent classification framework for power consumption behavior combining improved k-means and LSTM in [4], which solved the limitations of a single analysis method. Chen et al. proposed an improved K-means clustering method in [5], which used K-D tree to optimize the nearest neighbor search and improve the unsupervised classification performance, so that the SC of the clustering results increased by 39.1%, CH increased by 32.9%, and DB decreased by 11.9%. Li et al. proposed an adaptive weighted feature K-means affinity propagation (AP) clustering algorithm in [6], which is helpful for load forecasting, energy theft detection and differentiated services. Song et al. proposed a method for analyzing electricity consumption behavior based on stacked autoencoders and clustering in [7]. Their AFS-SAEUL algorithm reduced DBI by 33.24% and increased SC by 20.7% in feature selection. The UBA-AFSIC model achieved a minimum DBI of 0.7156 and a maximum SC of 0.4289 in clustering performance. Kaur et al. analyzed the characteristics of consumer behavior through clustering in [8], reduced the dimension of time series, and made it suitable for large-scale data.
In terms of user power consumption prediction and abnormal power consumption behavior detection, SaadSaoud et al. proposed a hybrid model based on SWT and deep transformer in [9], which has better prediction performance than existing methods. Compared with the LSTM-SWT model, the average RMSE, MAE and MAPE values are increased by 48%, 47% and 51% respectively. Aurangzeb et al. used a bidirectional LSTM network based on time embedding for household load forecasting in [10]. The T2VBiLSTM model performed best, with an average MAPE of 74.90% on weekends and 79.42% on weekdays. Michalakopoulos et al. proposed a machine learning-based framework in [11] for clustering residential power load profiles to enhance demand response plans, and used xAI to enhance the interpretability of the solution, thereby improving the scalability and versatility of the solution. Liu et al. proposed a method combining adaptive noise-assisted complete ensemble empirical mode decomposition (CEEMDAN) with long short-term memory (LSTM) network to predict user power consumption in [12]. Experimental verification showed that the proposed prediction method reduced the error by 21%, 30%, and 13% respectively compared with the LSTM, RNN and EMD-LSTM prediction methods. Chen et al. proposed a short-term power load forecasting model (STLF) based on deep residual network in [13]. Tests and comparisons showed that the model provided accurate predictions and exhibited high generalization ability. Lu et al. introduced a malicious traffic analysis method based on time intervals [14]. Li et al. proposed a hybrid short-term load forecasting method for smart grids in [15], which combined multiple linear regression (MLR) and long short-term memory (LSTM) neural network, namely, EEMD-LSTM-MLR. Compared with SVR, BPNN, LSTM and MLSTM methods, this method performed better in prediction accuracy. Pan et al. proposed a high-dimensional energy consumption anomaly detection method based on CNN, Bi-LSTM and attention mechanism in [16]. The experimental results show that the MAE and MAPE are significantly reduced using this method, indicating that the model trained using historical high-dimensional energy consumption information can effectively reflect the user’s electricity consumption behavior. Lu et al. proposed an intrusion detection method based on MPNN [17]. Wang et al. proposed an unsupervised abnormal power consumption detection model based on improved Canopy-Kmeans and isolation forest algorithm in [18], with an accuracy of 88.6%, a recall rate of 83.42%, and an F1 score of 0.8593.
In terms of power outage sensitive user analysis and identification, Wang et al. [19] established a user-centric smart grid spatiotemporal reliability assessment model to provide theoretical support for customized power supply services. Shuai et al. [20] used statistical analysis and data mining methods to analyze the power outage sensitivity of users and used a decision tree model to classify users. The accuracy and F1 score of the decision tree model were 99.77% and 98.40%, respectively, which has better recognition performance than the SVM and Logistic regression models. Lu et al. [21] proposed an adversarial example defense algorithm for intelligent driving. Li et al. [22] proposed a low-voltage distribution network power outage sequence optimization method considering user importance to reduce economic losses from power outages. In order to improve the accuracy of power user sensitivity classification, Ding et al. [23] optimized and improved the decision tree algorithm based on the ant algorithm and constructed a power user sensitivity analysis model. Experimental results show that the average recall rate and F1 score of this method are 91.62% and 92.06%, respectively.
In response to the requirements of the CPSS framework, recent research has further emphasized the interaction between user behavior and the physical system of the power grid. Zhang et al. [24] proposed a hybrid model based on LSTM and attention mechanism, combined with CPSS framework to predict power outage risk, with a MAPE as low as 8.2%, but its single region dataset limits its universality. Liu et al. [25] used graph neural network (GNN) to analyze user outage sensitivity, with a classification accuracy of 92.5%, which is better than traditional methods, but did not fully explore cross regional data features. Wang et al. [26] proposed a real-time power outage management method based on reinforcement learning, which reduces recovery time by about 20%, but is more suitable for dynamic decision-making rather than user classification.
Although the above research provides diverse algorithms and models, some methods rely on expert knowledge, which limits objectivity and universality. Some algorithms have high computational complexity, insufficient real-time performance, and lack long-term field application evaluation when processing large-scale datasets. This study overcomes the limitations of traditional methods, improves the generalization ability and real-time performance of the model through multi-source data fusion, optimized feature extraction, and CNN+LSTM model. It is in line with the hot topics of user behavior analysis and power outage management under the CPSS framework, and provides new theoretical and practical support for smart grid optimization.
Innovations of this paper.
1. Multi-source data fusion: Fusion of residential electricity consumption data of a city in China, EIA 2024 electricity data of the United States, and MyGridGB 2016 power generation data, to build a cross-regional, multi-dimensional analysis framework, to explore the correlation between power load and power outage sensitivity, and to break through the limitations of a single data set. Deepen the user grid interaction analysis under the CPSS framework, which is superior to single regional research.
2. Optimized feature extraction: k-means clustering is used to extract user load curves, and coefficient correction is introduced to optimize feature weights, improve the model’s adaptability to complex electricity consumption behaviors, and provide high-quality input for the CNN+LSTM model.
3. CNN+LSTM fusion model: Propose a CNN+LSTM fusion model that combines time series and spatial features to significantly improve anomaly detection accuracy and power outage sensitive user recognition rate, with better accuracy and generalization ability, providing precise support for intelligent grid optimization management under CPSS background.
3 Our approach
3.1 Overall structure
We use power user load curve data to extract typical load patterns, predict user loads based on the load patterns, explore how to detect power consumption anomalies by comparing predicted loads with actual loads, and study and consider the impact of temperature and humidity on load forecasting. We propose a power consumption anomaly detection method based on CNN+LSTM for the identification and analysis of power outage-sensitive users.
The specific process is shown in Figure 1.
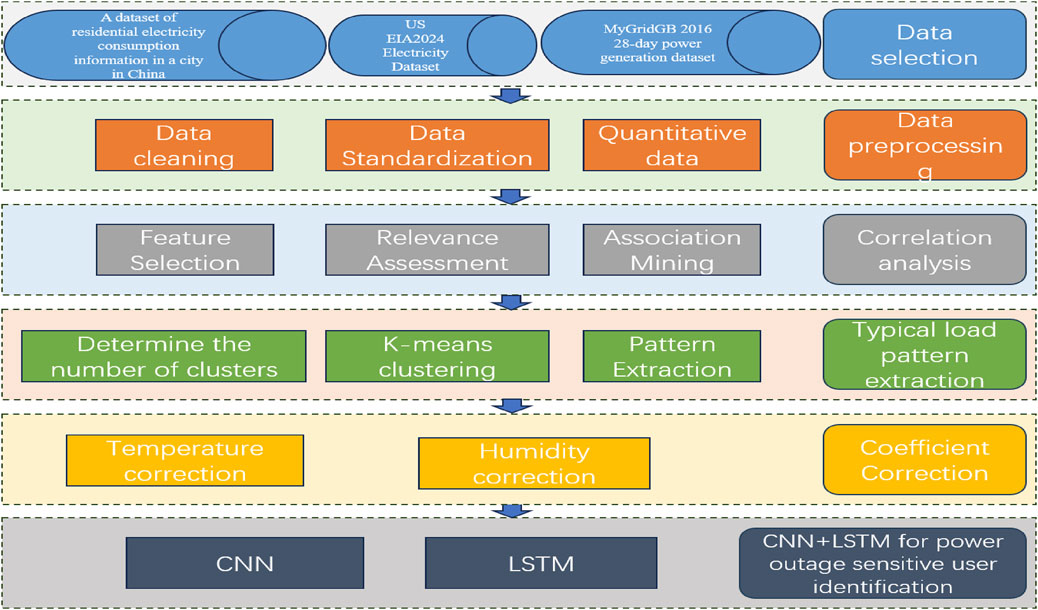
Figure 1. Power outage sensitive user identification based on CNN+LSTM algorithm.
First, data selection is performed to obtain user power load data from power terminals, including temperature, humidity, and power user load data at corresponding times. Then, data preprocessing is performed. The data obtained from power terminals may have missing values. At the same time, text data needs to be quantified and normalized. Then, correlation analysis is performed on power load factors. Power load is affected by many nonlinear factors. Grey correlation analysis is used to determine the key factors affecting load changes and the degree of influence on load results. Load pattern extraction is performed, and the k-means algorithm is used to extract the user’s typical load curve. Seasons, holidays, weekdays, and weekends are considered in this step. The coefficient of the typical load curve is corrected, and the grey correlation analysis method is used to determine the load influencing factors and obtain the temperature correction coefficient of the typical load curve. Finally, the CNN+LSTM model is used to detect power anomalies and identify power outage-sensitive users for the load curve to be tested and the corrected load curve.
3.2 Data preprocessing
Preprocess the data collected from the electricity consumption terminal: remove the missing values of a single point; replace the identification data with numerical values.
The commonly used Z-Score standardization method is used. Z-Score standardization is also called standard deviation standardization. It standardizes the data based on the mean and standard deviation of the original data. Let
Then the load data is processed.
For the CNN+LSTM model, the input sample data must be quantified data, while day types, seasonal attributes, etc. are all unstructured data and need to be quantified.
The analysis of power load data shows that the loads on weekdays from Monday to Friday are very similar, which is different from the loads on rest days such as Saturday and Sunday. At the same time, holidays and seasons also have a great impact on power loads.
3.3 Correlation analysis
The analysis of external factors affecting load refers to the correlation analysis between the factors that play a dominant role in load changes and the load change curve. The advantage of the grey correlation analysis method is that it has no rigid requirements on the sample size and regularity, and has a small amount of calculation and a simple algorithm. It can quantitatively analyze the correlation between external factors and load changes, and is very suitable for power load characteristic analysis under big data.
Grey correlation analysis is a data analysis method based on grey system theory. The measure of the correlation between the factors of two systems that change over time or between different objects is called correlation. If the correlation is high, the two quantities have a closer relationship. When one quantity changes, the other quantity is more affected. Otherwise, the correlation is low.
The data sequence reflecting the system data characteristics is taken as the reference sequence, and the sequence
Among them,
Since the comparison series and the reference series have a corresponding correlation coefficient at N points, the average value is taken to obtain the final correlation degree, as shown in Formula 3:
Among them,
3.4 Typical load pattern extraction
The k-means clustering algorithm is used to extract the typical load curve of the user. The k-means clustering algorithm is often used to extract the power load pattern due to its advantages of low algorithm complexity and high speed to meet the processing time requirements of the interaction between the power grid and the user.
The k-means algorithm is a partition-based clustering method that uses k as a parameter to divide n objects into k clusters so that the similarity within a cluster is high, while the similarity between clusters is low. The similarity is calculated based on the centroid of the cluster (the average value of the objects in a cluster).
Input: parameter
Output:
Step 1: arbitrarily select
Step 2: calculate the distance
Step 3: update the average value of the cluster, i.e., the cluster center;
Step 4: calculate the criterion function square error function
Step 5: if the
3.5 Coefficient correction
The k-means algorithm is used to extract the user’s typical load curve, and the data with the greatest similarity to the typical load curve after using the algorithm is obtained. They and the corresponding temperature and humidity data are extracted for research, and the relationship between the load and its corresponding temperature and humidity is analyzed.
Through correlation analysis, we can see that there is a positive correlation between load and temperature, and there is a linear relationship between the two. Let the load be L and the temperature be T.
Through experimental measurement and theoretical calculation, the most pleasant indoor temperature and humidity are: 18°C–25°C and 30%–80% in winter; 23°C–28°C and 30%–60% in summer. Based on this, when exploring the relationship between load and temperature, the daily average humidity is controlled to be 30%–60%, which means that the effect of humidity on load can be ignored within this humidity range.
Therefore, the temperature correction model obtained through experimental calculation is as follows Formula 4:
Among them,
Through correlation analysis, we can see that there is a negative correlation between load and humidity, and a linear relationship between the two. Let the load be L and the humidity be H.
It can be seen from the indoor air quality standard that when exploring the relationship between load and humidity, the maximum daily temperature can be controlled to 20°C∼30°C, that is, it is believed that within this temperature range, the load is mainly affected by humidity.
Therefore, the humidity correction model obtained through experiments is as follows Formula 5:
Among them,
3.6 Power outage sensitive user identification method based on CNN+LSTM
The power outage sensitive user identification method based on CNN+LSTM is a deep learning technology that combines convolutional neural networks (CNN) and long short-term memory networks (LSTM) to identify and predict abnormal power consumption behaviors in power systems and identify power outage sensitive users. The power consumption anomaly detection method combining CNN and LSTM can give full play to the advantages of the two network structures to improve the accuracy and efficiency of detection. The CNN part is responsible for capturing local features in power data, such as sudden changes or periodic fluctuations in power consumption patterns, which helps to identify possible abnormal patterns. The LSTM part focuses on processing time series data and can learn the time dependence of power consumption behavior and identify long-term trends and seasonal changes, which is crucial to understanding the dynamic changes in power consumption patterns. By integrating these two networks, the model can simultaneously consider spatial features and temporal dynamics, thereby more comprehensively understanding the complexity of power consumption.
In addition, this combined approach can automatically learn features from raw data, reducing reliance on manual feature engineering, making the model more flexible and adaptable. When processing high-dimensional time series data, the gating mechanism of LSTM helps prevent the gradient vanishing problem, allowing the network to learn long-term dependencies. The hierarchical structure of CNN can capture local spatial correlations in the data, which is very useful for identifying local abnormal patterns.
After preprocessing the power data, analyzing the correlation, extracting typical load patterns, and correcting coefficients, we can detect power consumption anomalies and identify power outage-sensitive users. The corrected typical load curve and the load data to be tested are input into CNN for feature extraction, and then the extracted feature vector is input into LSTM to capture time dependency. The outputs of CNN and LSTM are fused to output the final sensitive user identification result. The CNN formula is as follows:
Where
The convolution layer is the core of CNN. It uses the convolution kernel to extract the features of the input feature map, which can be expressed by the following formula.
Where
The pooling layer can reduce the spatial dimension of the feature map, thereby reducing the amount of calculation. The common maximum pooling operation is as follows.
Where
The fully connected layer can integrate the features extracted by the convolutional layer and the pooling layer, perform nonlinear transformation, reduce dimensionality, generate output, etc. The output can be calculated by the following formula.
Where
The LSTM formula is as follows.
Where
The input of CNN and LSTM are fused to get the final output result is as Formula 7.
Where
Set a threshold
The overall model is as Formula 9.
First, standardized data is obtained through data preprocessing, and then correlation analysis is performed to obtain the influencing factors related to power load. Then, typical load patterns are extracted, and the corrected load curve is obtained through correction coefficients. Finally, it is input into the CNN+LSTM model together with the data to be tested to obtain the final prediction result.
The specific CNN+LSTM framework is shown in Figure 2.
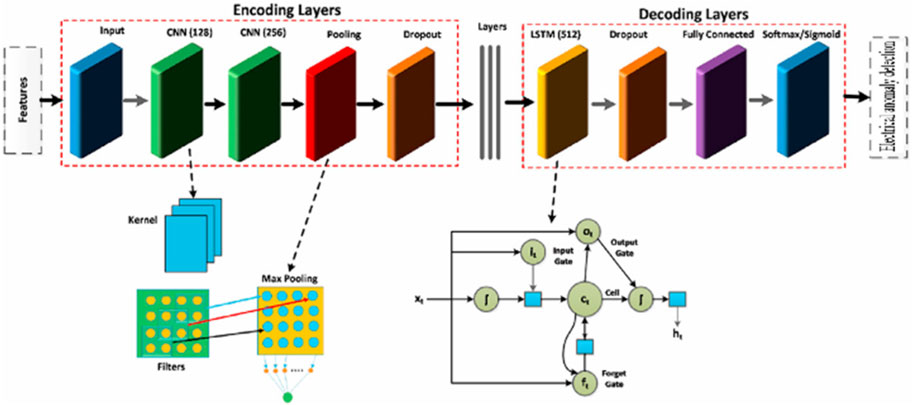
Figure 2. CNN+LSTM model structure for power outage sensitive user identification.
In the case of power anomaly detection to identify power outage-sensitive users, this combined approach can improve the model’s ability to identify abnormal events, whether they are short-term sudden anomalies or long-term gradual changes. By optimizing the model parameters, the prediction performance can be further improved, making the model more reliable in practical applications. Ultimately, this combined CNN and LSTM approach provides a powerful tool for power systems to monitor and predict power anomalies in real time, thereby improving the stability and reliability of power supply.
4 Experimental dataset
In order to comprehensively evaluate the performance of the proposed CNN+LSTM model for identifying power outage-sensitive users, this study uses three public power outage-sensitive user datasets, including a Chinese city residential electricity consumption information dataset, the US EIA2024 power dataset, and the MyGridGB2016 28-day power generation dataset, to evaluate the applicability of the proposed method in different scenarios. These datasets cover key indicators such as active power, reactive power, voltage, and current in household electricity consumption, statistical data on power plants, capacity, power generation, fuel consumption, sales, prices, and customers, and the power generation share of different types of power stations, etc., with high diversity and representativeness. They can be used for power residential load forecasting, household power consumption pattern analysis, power system optimization research, analysis of power consumption patterns of different user groups, and identification of users who are particularly sensitive to power outages. By comparing historical power consumption data, models can be built to predict power consumption, identify abnormal patterns, or assess power outage risks, improving the accuracy of prediction and detection. It helps analyze the stability of power supply and predict potential power outage risks, while identifying abnormal power consumption patterns.
The data distribution of the dataset is shown in the following Table 1.
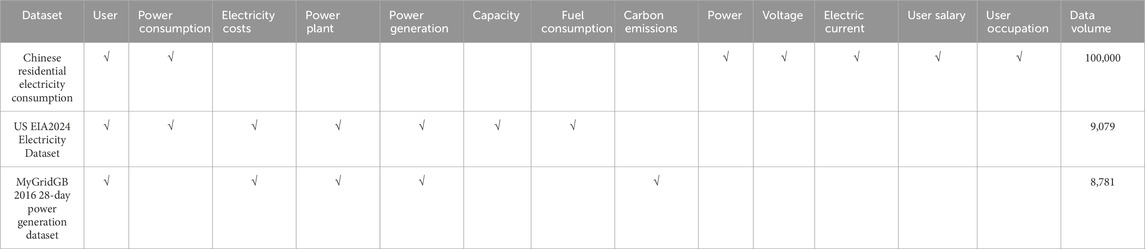
Table 1. Dataset.
5 Experiment
5.1 Experimental indicators
TP: indicates the number of samples correctly predicted by the model as positive.
TN: represents the number of samples correctly predicted as negative class by the model.
FP: Indicates the number of samples that the model incorrectly predicts as positive.
FN: represents the number of samples that the model incorrectly predicts as negative classes.
Accuracy: It indicates the ratio of the number of samples correctly predicted by the model to the total number of samples.
Recall: measures the ability of the model to correctly identify positive samples, that is, the proportion of samples that are correctly identified by the model among all samples that are actually positive.
F1 score: The harmonic mean of precision and recall, which attempts to find a balance between precision and recall.
5.2 Experimental methods and results
Typical load pattern extraction.
The k-means algorithm is used to extract load patterns. The cluster members are continuously moved in the iterative process until the ideal cluster is obtained. The load data of power users are clustered to obtain the typical load curve.
It can be analyzed in Figure 3, Upper left figure: The load curve has certain fluctuations, but overall shows a trend of being higher during the day and lower at night, which may correspond to users who consume more electricity during the day, such as industrial and commercial users.
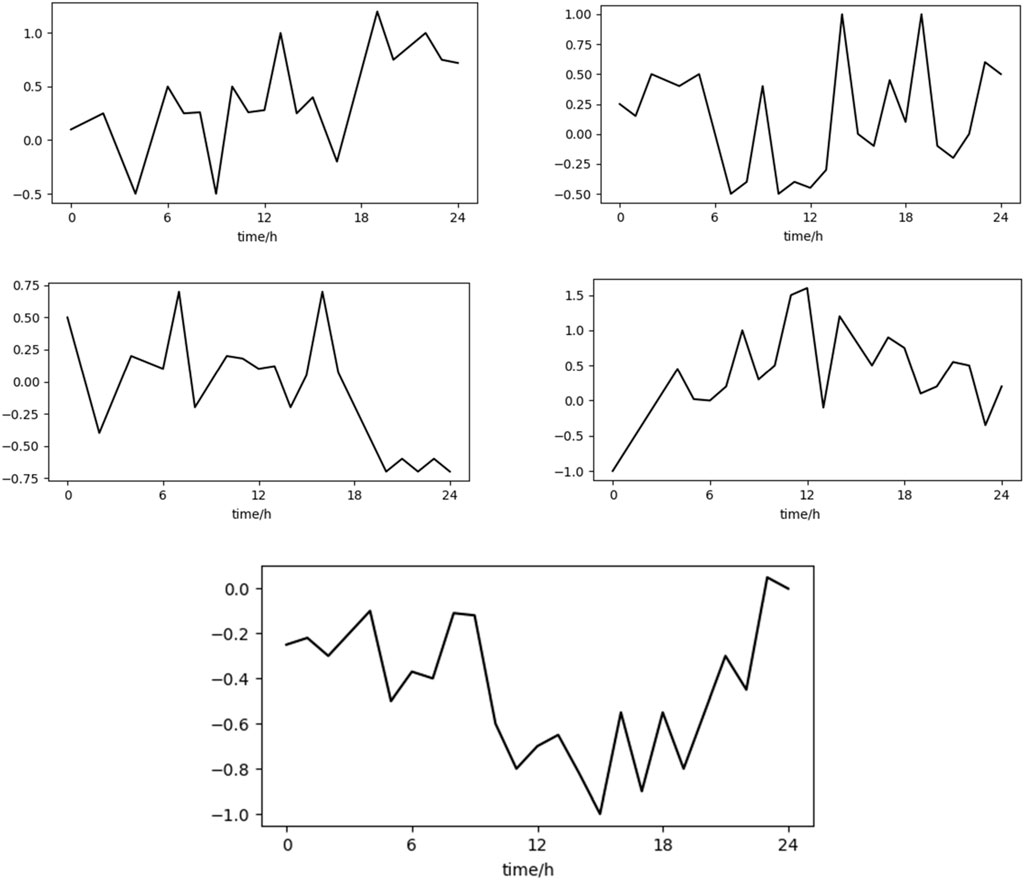
Figure 3. Typical load curve.
Upper right corner: The fluctuation range is large, and there are multiple load peak points, indicating that the electricity consumption behavior of this type of user is more complex and may be a multi-functional place, such as a commercial complex.
Middle left picture: The load curve is relatively stable, and the load drops significantly at night, which may be an office user.
Middle right picture: The load gradually increases during the day and remains at a certain level at night. This may be a place that operates 24 h a day, such as a factory or hospital.
Bottom chart: The load is relatively stable at night and fluctuates greatly during the day. It may be that the residential users mainly use electricity for daily life.
By extracting the electricity consumption behavior characteristics of power users through cluster analysis methods, we obtain load curves that can reflect the typical electricity consumption patterns of different user categories. These curves clearly show the load change patterns of users within 24 h a day. Based on these typical load curves, the behavioral characteristics of power users can be classified and identified, such as distinguishing different types of users such as residents, businesses, and industries, thus providing an important basis for the formulation of personalized power services, power optimization, and demand-side response strategies.
Grey correlation analysis is used to study the effects of temperature and humidity on power load. The dotted line represents the temperature curve or humidity curve, the solid line represents the load curve, the horizontal axis is time, and the vertical axis is temperature (°C) or humidity (%) and load, respectively. The result as is shown in the Figures 4, 5.
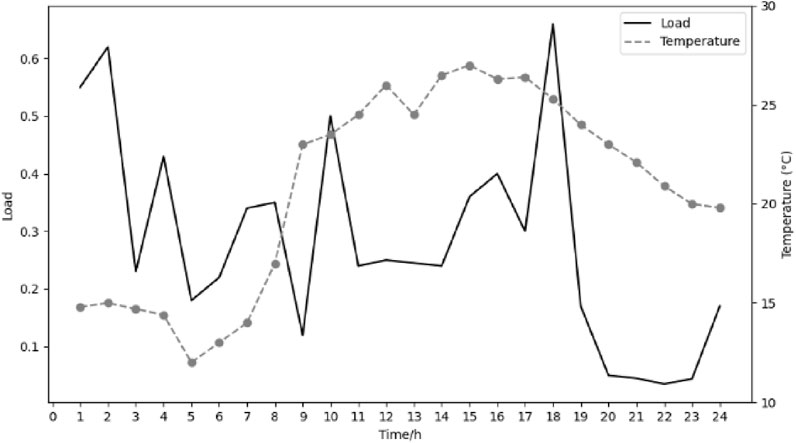
Figure 4. Effect of temperature on power load.
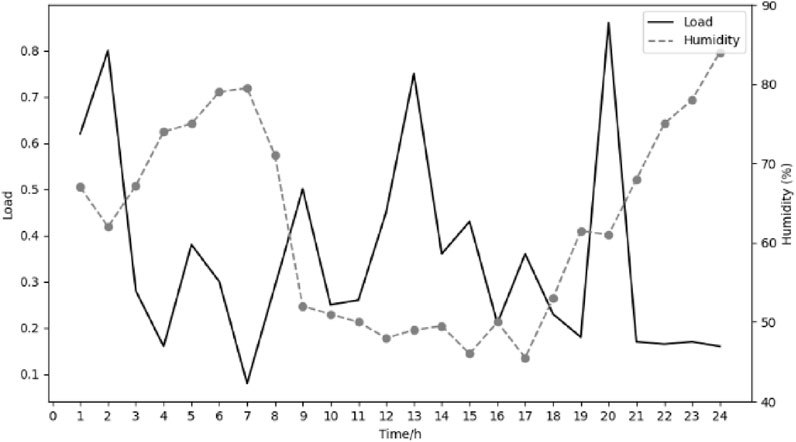
Figure 5. Effect of humidity on electrical load.
It can be seen from the figure that the change trend of temperature and humidity has a certain correlation with the change of load. The temperature is positively correlated with the load, and the humidity is negatively correlated with the load. The calculated correlation between temperature and load is 0.558, and the correlation between humidity and load is 0.398. The coefficients of temperature and humidity are corrected. Figures 6, 7 are comparisons of the predicted load and actual load when the temperature is 34.5°C and the humidity is 52%. The dotted line in the figure is the actual load curve, and the solid line is the load prediction curve.
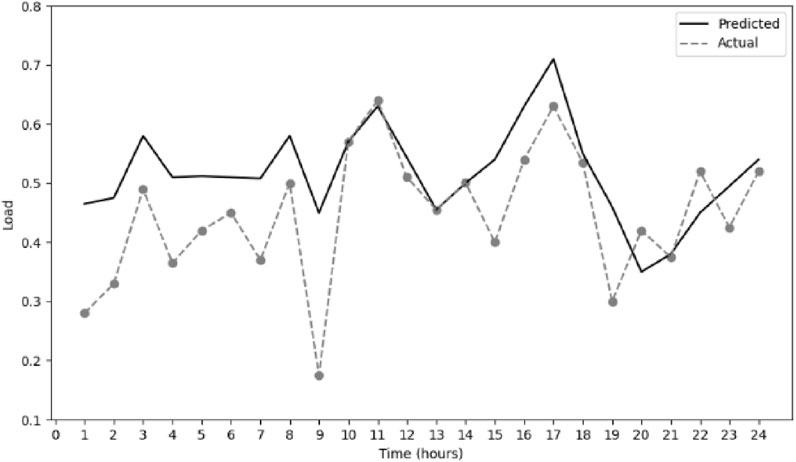
Figure 6. Comparison of predicted and actual values when the temperature is 34.5°C.
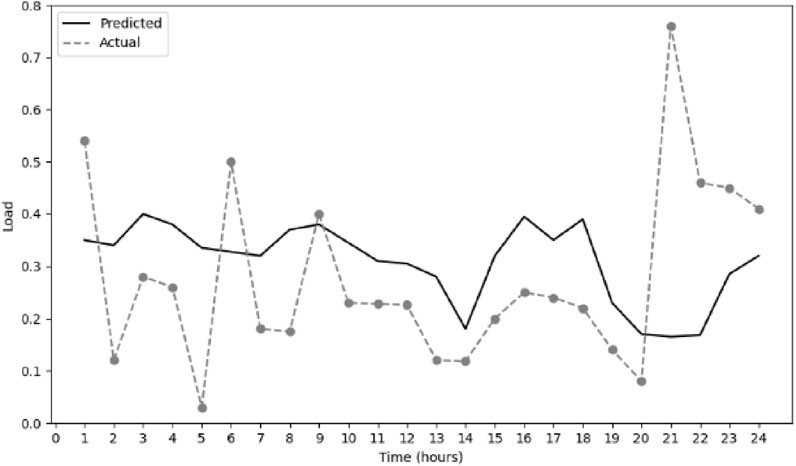
Figure 7. Comparison of predicted and actual values when humidity is 52%.
The figure shows that the model has a better load prediction effect under high temperature conditions, especially during the peak period of daytime electricity consumption. The load prediction ability at a humidity of 52% is not as good as that at a temperature of 34.5°C. The complexity of the impact of humidity on load may not be fully understood, especially during peak hours and nighttime. It also shows that temperature has a greater impact on power load. In general, the modified curve can better predict power load.
After the coefficients are corrected, power outage-sensitive user identification based on CNN+LSTM can be performed.
After experiments, our method CNN+LSTM has 99.23% accuracy, 99.01% recall and 95.14 F1 score on a Chinese city’s residential electricity consumption information dataset. It has 96.06% accuracy, 94.77 recall and 92.65 F1 score on the US EIA2024 power dataset. Similarly, our method also performs well on the MyGridGB2016 28-day power generation dataset, with 92.5% accuracy, 94.77% recall and 90.5% F1 score. It can efficiently and accurately detect power consumption anomalies and identify power outage-sensitive users.
In order to fully demonstrate the competitiveness of our method in this field, we further compared it with several existing advanced methods and tested it on the same dataset. Through experimental comparison, we showed the advantages and disadvantages of the CNN+LSTM method and these methods in multiple key performance indicators in the form of charts.
First, we compare CNN+LSTM with methods [11, 12, 16, 17], etc., and compare the advantages and disadvantages of the algorithms in terms of performance indicators such as accuracy, recall, and F1 score on three datasets.
The accuracy, recall, and F1 scores of the five methods on a Chinese city residential electricity consumption information dataset, the US EIA2024 electricity dataset, and the MyGridGB2016 28-day power generation dataset are shown in Figures 8–10.
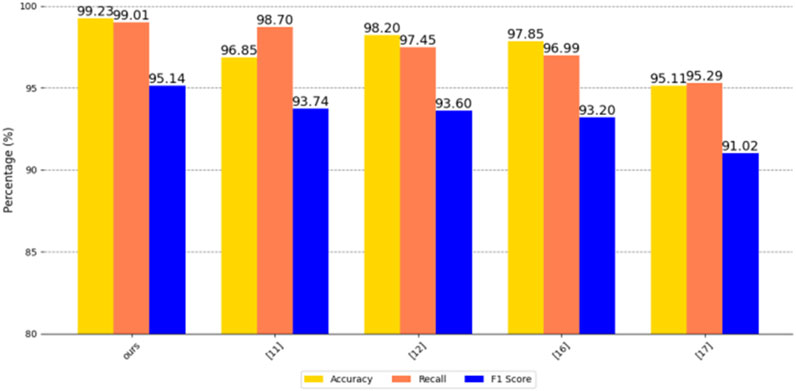
Figure 8. Comparison of five methods on a dataset of residential electricity consumption in a Chinese city.
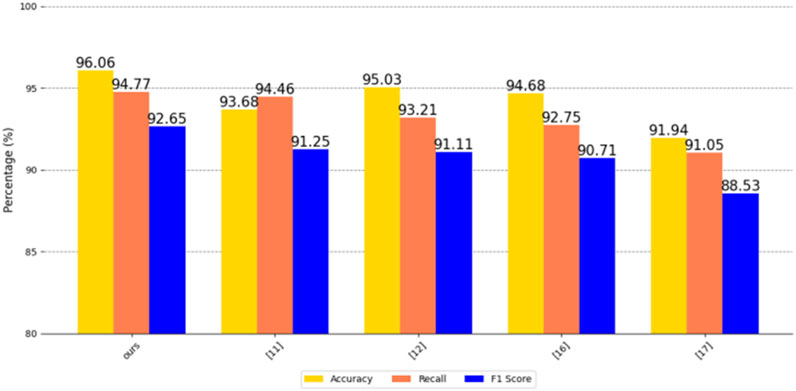
Figure 9. Comparison of five methods on the US EIA2024 electricity dataset.
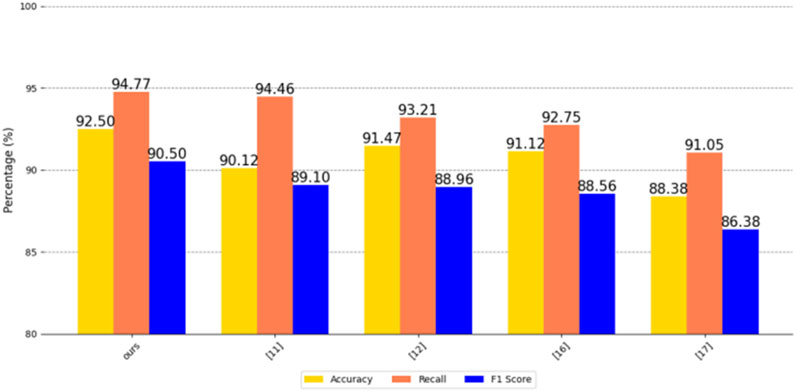
Figure 10. Comparison of five methods on the MyGridGB 2016 28-day power generation dataset.
As can be seen from the figure, our CNN+LSTM method is ahead of similar advanced methods in terms of accuracy, recall, and F1 score, indicating that our method has significant advantages in overall performance, anomaly detection capability, balance, robustness, innovation, practical value, and research contribution. It can more accurately identify abnormal conditions in the power system, while achieving a good balance between avoiding false positives and false negatives, which is of great significance to the safe and stable operation of the power system and has high practical value.
5.3 Ablation experiment
In order to further illustrate the impact of each module of CNN+LSTM on the overall performance, we conduct ablation experiments on it. By systematically removing or changing certain parts of the model to evaluate their impact on the overall performance, we can help understand the model behavior, optimize the model structure, and improve the interpretability and robustness of the model. Specifically, ablation experiments can reveal the key roles of CNN and LSTM components in the model and how they jointly affect the final results. By removing or modifying these components one by one, we can deeply analyze the contribution of each part to the performance of the model, so as to discover potential weaknesses and improve them. It not only helps to verify the assumptions in the model design, but also provides direction for future research and quantifies the specific contribution of each method when comparing different models or algorithms.
In order to conduct ablation experiments, we use the following 6 model configurations to compare the effects, namely, bidirectional long short-term memory network Bi-lstm, long short-term memory network LSTM, convolutional neural network CNN, recurrent neural network RNN, attention mechanism-based model Transformer, back propagation neural network BPNN. To verify the impact of different modules on the algorithm and compare the effects between algorithms, we compare them on a Chinese city residential electricity consumption information dataset, the US EIA2024 electricity dataset, and the MyGridGB2016 28-day power generation dataset. The results are shown in Tables 2, 3, 4.
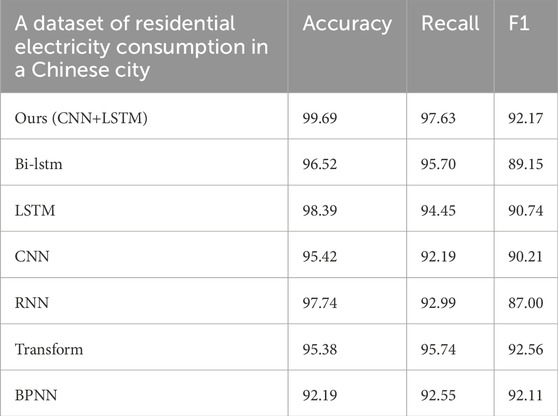
Table 2. Ablation experiment on a dataset of residential electricity consumption in a Chinese city.
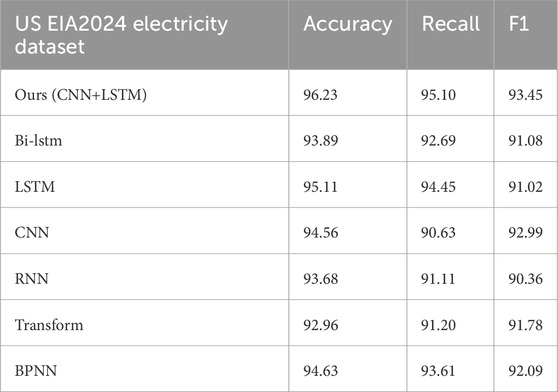
Table 3. Ablation experiment on the US EIA2024 power dataset.
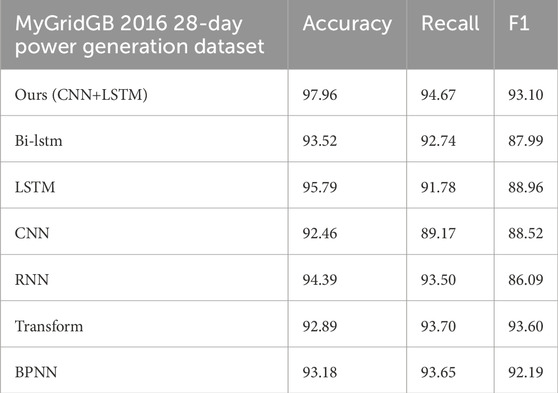
Table 4. Ablation experiment on MyGridGB 2016 28-day power generation dataset.
It can be seen that on the three data sets, compared with the use of CNN or LSTM alone, CNN+LSTM has better results in accuracy, recall, and F1 score. The joint model of CNN and LSTM combines the strengths of CNN in spatial feature extraction and the advantages of LSTM in time series analysis. This integration enables the model to effectively process and analyze complex data sets containing spatiotemporal information, and can capture the temporal dynamics and spatial layout of the data at the same time, which is very suitable for performing complex data analysis tasks, such as the power consumption anomaly detection case discussed in this article, in which the comprehensive use of spatiotemporal information significantly improves the prediction accuracy. In addition, compared with a single type of model, the CNN+LSTM combination also shows better expressiveness in generalization performance, because it can learn richer and more diverse feature expressions from the data, so as to better cope with the complex nonlinear relationships within the data. And compared with other compared algorithms, our model also has the highest accuracy, which can give full play to the hybrid advantages of CNN and LSTM to implement complex tasks.
In order to further analyze the impact of environment and time on user electricity consumption, we conducted an ablation experiment for correlation analysis. Through ablation experiments on factors such as temperature, humidity, weekends, and holidays, we hope to reveal how these factors affect users’ electricity consumption patterns independently and jointly. Using the method of controlling variables, we gradually introduced various factors for ablation experiments. The ablation experiment results for each data set are shown in Figures 11–13.
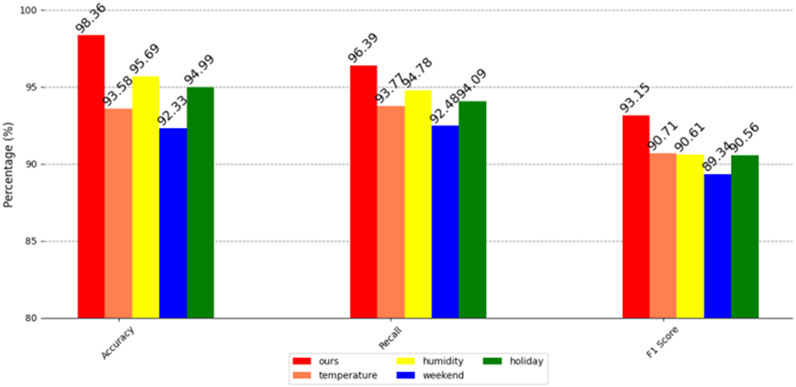
Figure 11. Association analysis and ablation on a dataset of residential electricity consumption in a Chinese city.
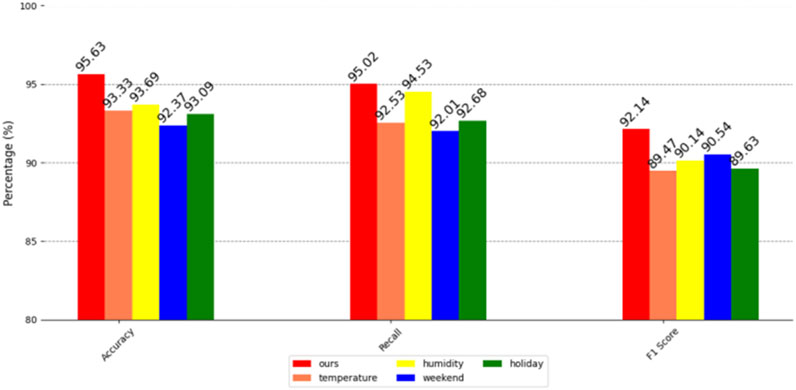
Figure 12. Correlation analysis and ablation on the US EIA2024 electricity dataset.
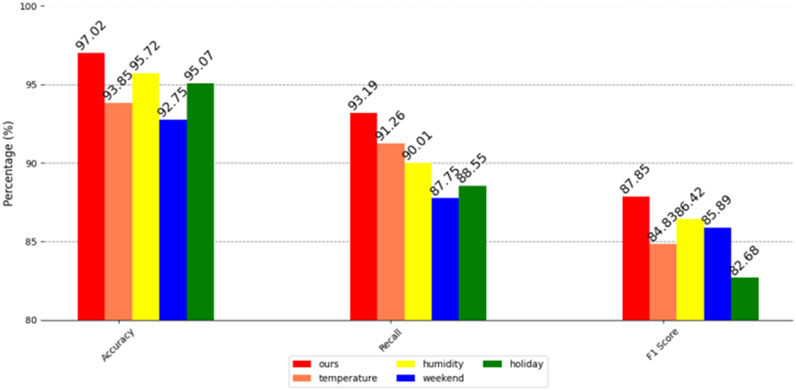
Figure 13. Correlation analysis and ablation on the MyGridGB 2016 28-day power generation dataset.
It can be clearly seen from the above figure that humidity, an environmental factor, has a high impact on the accuracy of user power forecasting in three different data sets. Specifically, in the residential power consumption information data set of a certain city in China and the US EIA2024 power data set, humidity not only significantly affects the accuracy of the forecast, but also largely affects the recall rate. In the MyGridGB2016 28-day power generation data set, although temperature has a greater impact on the recall rate, humidity is still a factor that cannot be ignored, and it has a significant impact on the accuracy of user power forecasting in this data set.
Further observing the comprehensive evaluation index of F1 score, we found that the influence of temperature and humidity on the residential electricity consumption information dataset of a certain city in China is not much different, which shows that in this dataset, the impact of these two environmental factors on model performance is relatively balanced. However, in the US EIA2024 power dataset, the weekend time factor is particularly important, which has a significant impact on the prediction performance of the model. In the MyGridGB2016 28-day power generation dataset, humidity once again becomes a key factor and has a great impact on the F1 score of the model.
Although these environmental and time factors affect the prediction performance of the model to varying degrees, our method still shows the highest accuracy, recall rate, and F1 score. Regardless of the environment, our method can stably complete the task of predicting the user’s power load. This powerful prediction capability enables our method to be further applied to the field of power anomaly detection, and to timely detect power anomalies through accurate power load forecasting. At the same time, our method can also effectively analyze and identify users who are sensitive to power outages, providing valuable reference information for power suppliers to help them better manage and optimize power resources.
6 Conclusion
In summary, this article proposes a CNN+LSTM model that integrates spatiotemporal feature modeling for the complex interaction characteristics of energy systems under the background of CPSS. It demonstrates significant applicability in the analysis and identification of power outage sensitive users in energy systems based on multi-source heterogeneous big data. This model uses CNN to extract hierarchical features of local correlations in spatial dimensions such as household electricity consumption patterns and power generation type distributions. Combined with LSTM’s ability to model long-term dependencies in time series data such as energy consumption fluctuations and cost income dynamic correlations, it constructs a multidimensional data fusion analysis mechanism across physical layers (energy flow), information layers (data flow), and social layers (user behavior) under the CPSS framework.
Experiments on typical CPSS scenario datasets covering household electricity usage profiles, regional energy structures, and full lifecycle costs have shown that the model improves the accuracy of electricity load forecasting to industry-leading levels through joint learning of spatiotemporal features. Especially in complex scenarios with intermittent fluctuations in renewable energy and uncertainty in user behavior, the detection accuracy of electricity anomalies is better than traditional methods, effectively solving problems such as multi-source data noise interference and difficulty in modeling nonlinear relationships in CPSS environments. The identification results of power outage sensitive users output by the model can be directly mapped to the operation and regulation of the energy system. Through real-time warning mechanisms, power suppliers can dynamically adjust their demand side management strategies. In typical CPSS application scenarios such as smart microgrid supply-demand balance control, precise pricing of tiered electricity prices, and optimization of emergency power supply configuration, a closed-loop from data-driven to decision optimization is achieved. This provides quantifiable technical support and practical path for building a more flexible energy information physical social system, significantly improving the scientific and refined level of energy system management in digital transformation.
Data availability statement
The original contributions presented in the study are included in the article/supplementary material, further inquiries can be directed to the corresponding author.
Author contributions
KL: Writing – original draft, Writing – review and editing. HS: Writing – review and editing, Data curation, Formal Analysis. LL: Writing – review and editing, Data curation. ZS: Writing – review and editing, Investigation. ZZ: Writing – review and editing, Resources.
Funding
The author(s) declare that no financial support was received for the research and/or publication of this article.
Conflict of interest
Authors KL, HS, LL, ZS, and ZZ were employed by Guangdong Power Grid Co., LTD.
Generative AI statement
The author(s) declare that no Generative AI was used in the creation of this manuscript.
Publisher’s note
All claims expressed in this article are solely those of the authors and do not necessarily represent those of their affiliated organizations, or those of the publisher, the editors and the reviewers. Any product that may be evaluated in this article, or claim that may be made by its manufacturer, is not guaranteed or endorsed by the publisher.
References
1. Forootan MM, Larki I, Zahedi R, Ahmadi A. Machine learning and deep learning in energy systems: a review. Sustainability (2022) 14:4832. doi:10.3390/su14084832
2. Chicco G, Napoli R, Piglione F. Comparisons among clustering techniques for electricity customer classification. IEEE Trans Power Syst (2006) 21(2):933–40. doi:10.1109/TPWRS.2006.873122
3. Huang Z, Wang H. Nuclear family type identification based on deep forest algorithm in residential power consumption. Appl Sci (2023) 13(11):6602. doi:10.3390/app13116602
4. Li H, Hu B, Liu Y, Yang B, Liu X, Li G, et al. Classification of electricity consumption behavior based on improved K-means and LSTM. Appl Sci (2021) 11(16):7625. doi:10.3390/app11167625
5. Chen Y, Tan P, Mu L, Yin H, Tang R. K-means clustering method based on nearest-neighbor density matrix for customer electricity behavior analysis. Int J Electr Power and Energ Syst (2024) 161:110165. doi:10.1016/j.ijepes.2024.110165
6. Li W, Wang J, Bai H, Yan Y, Xu M, Liu Y, et al. Optimization strategy for an outage sequence in medium- and low-voltage distribution networks considering the importance of users. Appl Sci (2024) 14(18):8386. doi:10.3390/app14188386
7. Deng S, Cai Q, Zhang Z, Wu X. User behavior analysis based on stacked autoencoder and clustering in complex power grid environment. IEEE Trans Intell Transportation Syst (2022) 23(12):25521–35. doi:10.1109/TITS.2021.3076607
8. Kaur R, Gabrijelčič D. Behavior segmentation of electricity consumption patterns: a cluster analytical approach. Knowledge-Based Syst (2022) 251:109236. doi:10.1016/j.knosys.2022.109236
9. Saad Saoud L, Al-Marzouqi H, Hussein R. Household energy consumption prediction using the stationary wavelet transform and transformers. IEEE Access (2022) 10:5171–83. doi:10.1109/ACCESS.2022.3140818
10. Aurangzeb K, Haider SI, Alhussein M. Individual household load forecasting using bi-directional LSTM network with time-based embedding. Energ Rep (2024) 11:3963–75. doi:10.1016/j.egyr.2024.03.028
11. Michalakopoulos V, Sarmas E, Papias I, Skaloumpakas P, Marinakis V, Doukas H. A machine learning-based framework for clustering residential electricity load profiles to enhance demand response programs. Appl Energ (2024) 361:122943. doi:10.1016/j.apenergy.2024.122943
12. Liu H, Xiong X, Yang B, Cheng Z, Shao K, Tolba A. A power load forecasting method based on intelligent data analysis. Electronics (2023) 12(16):3441. doi:10.3390/electronics12163441
13. Chen K, Chen K, Wang Q, He Z, Hu J, He J. Short-term load forecasting with deep residual networks. IEEE Trans Smart Grid (2019) 10(4):3943–52. doi:10.1109/TSG.2018.2844307
14. Lu JZ, Chen K, Zhuo ZL, Zhang XS. A temporal correlation and traffic analysis approach for APT attacks detection. Cluster Comput (2019) 22:S7347–58. doi:10.1007/s10586-017-1256-y
15. Li J, Deng D, Zhao J, Cai D, Hu W, Zhang M, et al. A novel hybrid short-term load forecasting method of smart grid using MLR and LSTM neural network. IEEE Trans Ind Inform (2021) 17(4):2443–52. doi:10.1109/TII.2020.3000184
16. Pan H, Yin Z, Jiang X. High-dimensional energy consumption anomaly detection: a deep learning-based method for detecting anomalies. Energies (2022) 15(17):6139. doi:10.3390/en15176139
17. Lu JZ, Lan J, Huang YY, Song MJ, Liu XL. Anti-attack intrusion detection model based on MPNN and traffic spatiotemporal characteristics. J Grid Comput (2023) 21:60. doi:10.1007/s10723-023-09703-9
18. Wang J, Li X. Abnormal electricity detection of users based on improved canopy-kmeans and isolation forest algorithms. IEEE Access (2024) 12:99110–21. doi:10.1109/ACCESS.2024.3429304
19. Wang S, Liu L, Wu L, Zhao G. Consumer-centric spatiotemporal reliability assessment and compensation model with sensitive component analysis in smart grid. IEEE Trans Power Syst (2018) 33(2):2155–64. doi:10.1109/TPWRS.2017.2723800
20. Shuai C, Yang H, Ouyang X, He M, Gong Z, Shu W. Analysis and identification of power blackout-sensitive users by using big data in the energy system. IEEE Access (2019) 7:19488–501. doi:10.1109/ACCESS.2018.2886551
21. Lu JZ, Wang CL, Huang YY, Ding KY, Liu XL. An adversarial example defense algorithm for intelligent driving. IEEE Netw (2024) 38:98–105. doi:10.1109/MNET.2024.3392582
22. Li C, Cai W, Yu C, Zhao R, Zhang Q. Electricity consumption behaviour analysis based on adaptive weighted-feature K-means-AP clustering. IET Generation Transm Distribution (2019) 13(14):2352–61. doi:10.1049/iet-gtd.2018.5286
23. Ding J, Shi Y, Zhu R, Wei X, Chen B, Yu J. Power user sensitivity analysis and power outage complaint prediction. J Phys Conf Ser (2021) 1852:022052. doi:10.1088/1742-6596/1852/2/022052
24. Kim H, Kim M. A novel deep learning-based forecasting model optimized by heuristic algorithm for energy management of microgrid. Appl Energ (2023) 332:120525. doi:10.1016/j.apenergy.2022.120525
25. Zhu J, Li S, Borghetti A, Lan J, Guo T. Review of demand-side energy sharing and collective self-consumption schemes in future power systems. iEnergy (2023) 2(2):119–32. doi:10.23919/IEN.2023.0006
Keywords: power load, fusion features, CNN+LSTM, CPSS, anomaly detection
Citation: Li K, Su H, Li L, Song Z and Zhang Z (2025) Energy system power outage sensitive user identification model based on CNN+LSTM. Front. Phys. 13:1594845. doi: 10.3389/fphy.2025.1594845
Received: 17 March 2025; Accepted: 23 June 2025;
Published: 22 September 2025.
Edited by:
Yuanyuan Huang, Chengdu University of Information Technology, ChinaReviewed by:
Weisha Zhang, University of Electronic Science and Technology of China, ChinaYuan Tang, Chengdu University of Technology, China
Copyright © 2025 Li, Su, Li, Song and Zhang. This is an open-access article distributed under the terms of the Creative Commons Attribution License (CC BY). The use, distribution or reproduction in other forums is permitted, provided the original author(s) and the copyright owner(s) are credited and that the original publication in this journal is cited, in accordance with accepted academic practice. No use, distribution or reproduction is permitted which does not comply with these terms.
*Correspondence: Kai Li, bGlrYWkwNTgwNjhAMTYzLmNvbQ==