 Jawad Mirza
 Ahmad Atieh3
 Firdos Kanwal
 Imran Aziz
 Ahmad Almogren
- 1Electrical Engineering Department, HITEC University Taxila, Taxila, Pakistan
- 2SEECS Photonics Research Group, Islamabad, Pakistan
- 3Optiwave Systems Inc., Ottawa, ON, Canada
- 4Electrical Engineering Department, Mirpur University of Science and Technology (MUST), Mirpur, Pakistan
- 5Department of Physics and Astronomy, Uppsala University, Uppsala, Sweden
- 6Department of Computer Science, College of Computer and Information Sciences, King Saud University, Riyadh, Saudi Arabia
Determining the fermentation endpoint of organic compounds is critical for optimizing yield, ensuring the product consistency, and minimizing byproducts. However, conventional detection methods are slow, labor-intensive, and lack real-time monitoring, limiting their suitability for industrial automation. We propose a novel, non-destructive method for real-time detection of fermentation endpoint of Soybean using Palladium
1 Introduction
Fermentation of organic compounds is a vital biochemical process with significant applications in food industry, biofuel generation, and biotechnology [1]. It involves the microbial metabolism of organic substrates such as carbohydrates into simpler compounds like alcohols, organic acids, and gases facilitated by bacteria, yeast, and fungi [1]. Detecting the fermentation endpoint is essential to ensure optimal yield, quality, and process efficiency [1]. For example, in the fermentation of Soybean into acetic acid, the process occurs in two stages [1, 2]: the first is the hydrolysis of Soybean proteins and carbohydrates into simpler sugars and amino acids, followed by the oxidation of ethanol to acetic acid by acetic acid bacteria (AAB) such as acetobacter species. Accurate endpoint detection is crucial to prevent over-oxidation which could degrade acetic acid into carbon dioxide and water, compromising both quality and yield [2]. Advanced analytical techniques, including pH monitoring, gas chromatography, and high-performance liquid chromatography are commonly used to determine the fermentation endpoint and maintain the desired acetic acid concentration. Research emphasizes the importance of controlling factors like temperature, oxygen levels, and microbial activity to optimize the process [2, 3]. Beyond enhancing the nutritional profile of Soy-based products, Soybean fermentation for acetic acid production also yields valuable ingredients for the food industry such as vinegar and condiments, showcasing the broader economic and nutritional significance of fermentation [2, 3].
From an economic perspective, the production of acetic acid from Soybean’s fermentation is highly valuable due to its applications in food, pharmaceuticals, and chemicals. This process is cost-effective compared to synthetic production as it utilizes natural source, thus reducing the energy consumption and production costs. The growing demand of acetic acid produced through natural sources has further boosted its market value. The global acetic acid market, valued at over $10 billion in 2022, is projected to grow, driven by its use in food processing, textiles, and biodegradable plastics [4]. Fermentation supports sustainability and creates economic opportunities for agricultural communities by utilizing local raw materials.
2 Related works
Determining the fermentation endpoint in Soybean processing is crucial for ensuring the product quality, maximizing yield, and avoiding over-fermentation which can result in unwanted byproducts. A range of traditional analytical techniques are utilized to identify when fermentation is complete. These methods include pH monitoring [5], gas chromatography (GC) [6], high-performance liquid chromatography (HPLC) [7], and Fourier transform infrared (FTIR) spectroscopy [8]. Analytical methods for fermentation endpoint detection often suffer from limitations such as time consuming sample preparation, high operational costs, potential contamination risks, and need for specialized equipment and expertise. Non-destructive, real-time, and online techniques for fermentation endpoint detection are essential to overcome the limitations of traditional analytical methods ensuring continuous monitoring and improved process efficiency. Various real-time techniques have been proposed to monitor the fermentation endpoint in different organic compounds. For example, monitoring the fermentation in dairy products using fluorescence spectroscopy [5], ultrasonic sensor [9], infrared light backscatter sensor [10], near-infrared (NIR) spectroscopy [11], monitoring the fermentation process in ethanol using viable cell sensor [12], monitoring the fermentation in yeast using software controlled automatic real-time biosensor [13], monitoring the fermentation process in Soybean using miniature fiber NIR spectrometer [14], monitoring the fermentation process in wine with benchtop 1H NMR spectroscopy [15] and NIR spectroscopy [16], and monitoring the fermentation process in black tea using an electronic tongue [17]. The literature review has been further elaborated in Table 1 by comparing the important achievements of past studies with proposed work.
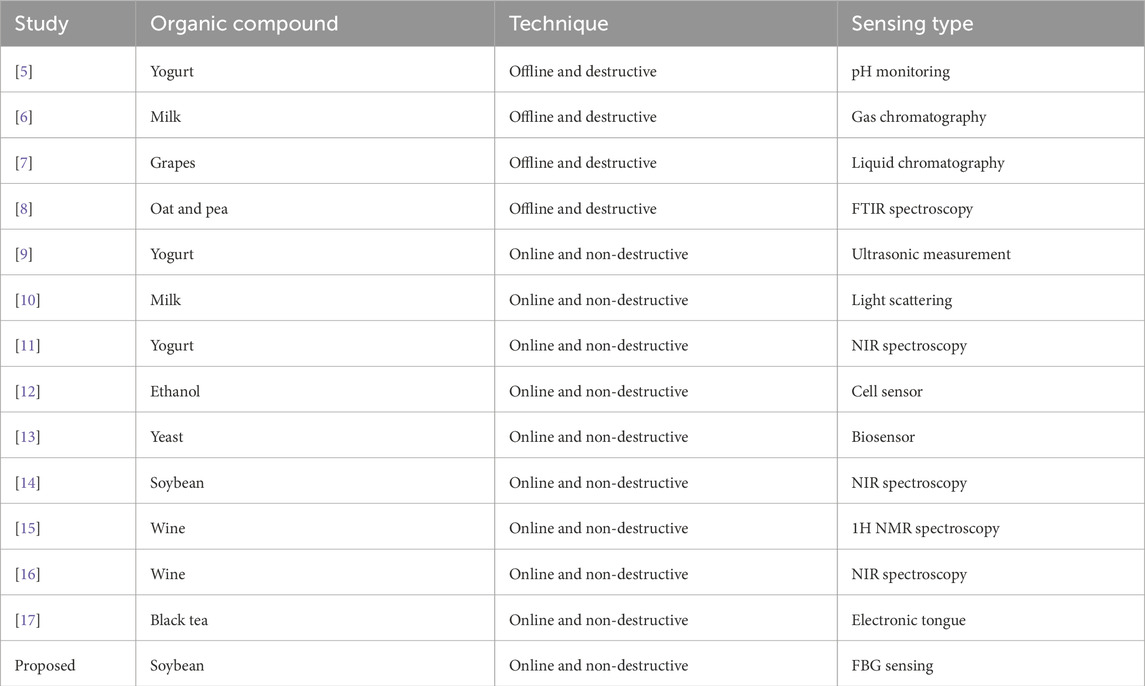
Table 1. Elaboration of the literature survey and comparison with proposed work.
We introduce a novel non-destructive approach for real-time detection of the Soybean fermentation endpoint using a
3 Modelling the fermentation process and working principle
To accurately model the fermentation process of Soybean and explain the working principle of the proposed method, it is important to estimate the total yield of
The Equation 1 illustrates the fermentation process of Glucose
Thus, 180 g of
Therefore, 1 kg of
Using the molar volume of an ideal gas at STP, the volume of
Converting liters to cubic meters (since
To determine the stress induced in
3.1
Figure 1 illustrates the fabrication of
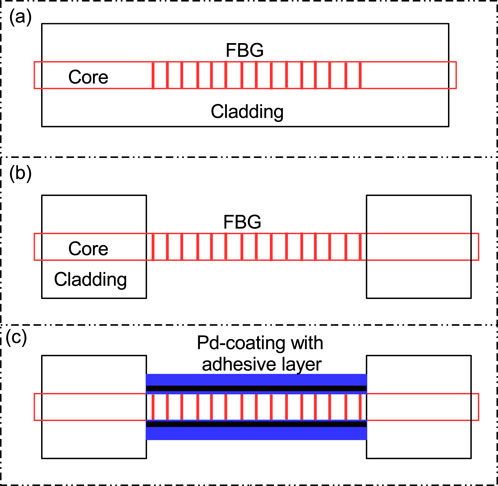
Figure 1. Important steps for
First of all, the reaction between
The absorption of
3.2 Calculation of stress developed in
To calculate the stress induced in
• Radii of the core and cladding are 4.6
• Thickness of
• Thickness of adhesive layer of Titanium is 20 nm.
• Saturation limit of 0.1 is considered.
• The effect of temperature on Bragg wavelength shift is not considered in this research.
The strain induced in the
In Equation 3,
In Equation 4,
3.3 Effect of stress on Bragg wavelength shift
The shift in the Bragg wavelength
where
The Bragg wavelength shift of 24.2 nm serves as a key indicator for detecting the fermentation endpoint in Soybean processing. This shift results from the stress-induced expansion of the
4 Design validation of
The analytical model of the
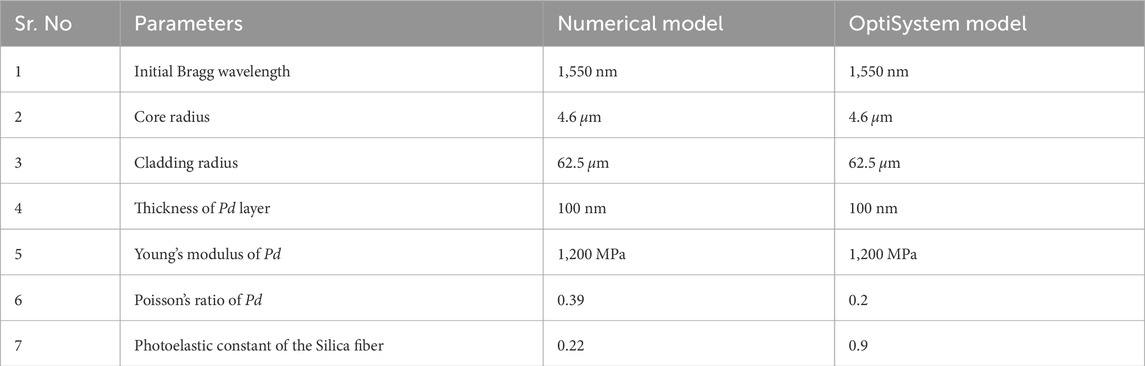
Table 2. Comparison of parameters for the analytical model and OptiSystem analysis of the
5 Simulation setup
Figure 2 shows the block diagram of the simulation setup designed in OptiSystem to detect the fermentation endpoint of Soybean. A white light source (WLS) with a power spectral density (PSD) and center wavelength of −60 dBm/Hz and 1,551 nm, respectively is used to illuminate the FBG stress sensor. Figure 3 illustrates the spectrum of WLS. The WLS model used in OptiSystem generates noise bins or sampled signals at the output according to the following mathematical expression.
In Equation 6,
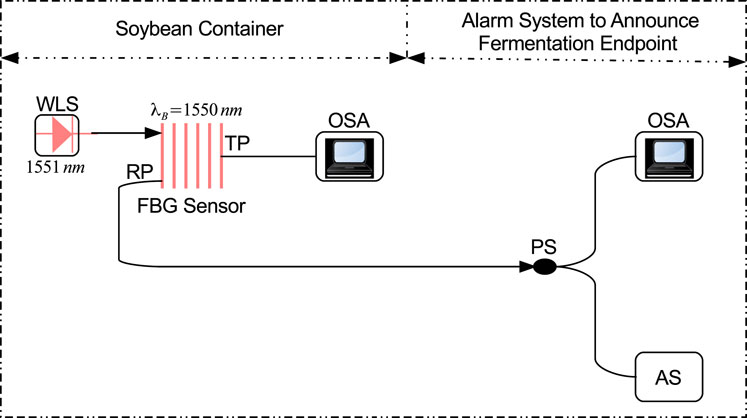
Figure 2. Block diagram of the sensor setup designed in Optisystem. WLS: White light source, FBG: Fiber Bragg grating stress sensor, PS: Power splitter, OSA: Optical spectrum analyzer, AS: Alam system.
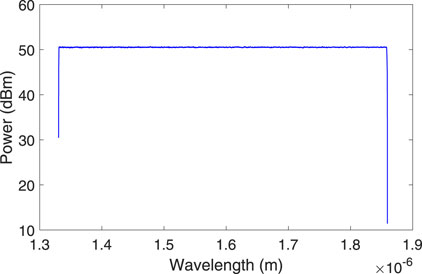
Figure 3. Spectral plot of WLS centered at 1551 nm.
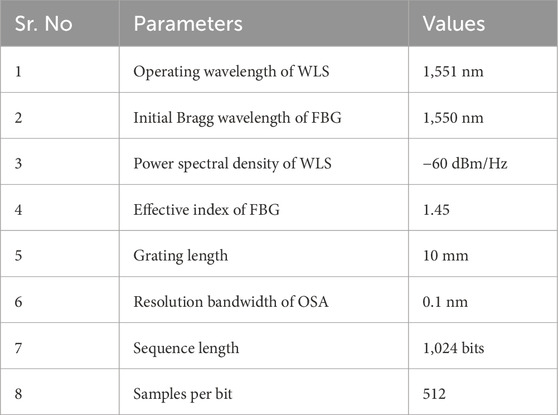
Table 3. List of simulation parameters.
6 Results and discussion
Figure 4 illustrates the induced stress due to formation of
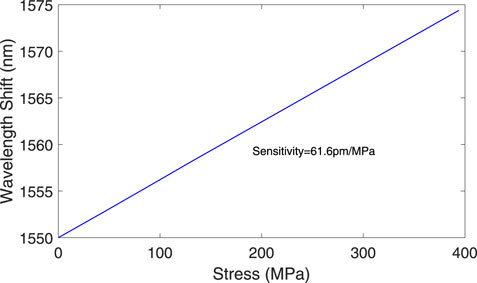
Figure 4. Induced stress versus wavelength shift plot.
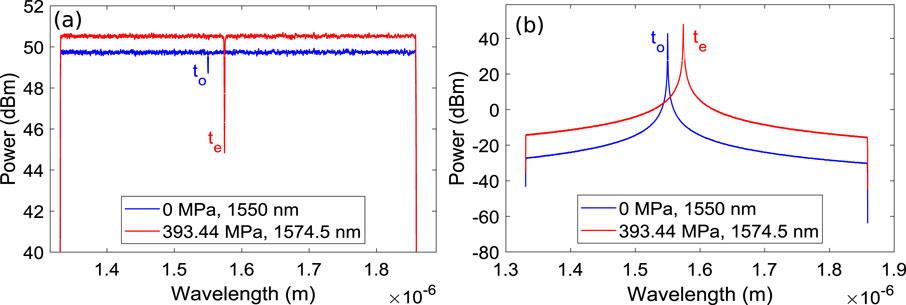
Figure 5. (a) Transmission spectra of FBG stress sensor (b) Reflection spectra of FBG stress sensor.
7 Conclusion
In this study, we demonstrated a non-destructive and real-time method for detecting the fermentation endpoint of Soybeans using a
Data availability statement
The raw data supporting the conclusions of this article will be made available by the authors, without undue reservation.
Author contributions
JM: Conceptualization, Project administration, Software, Validation, Writing – original draft, Writing – review and editing. AA: Methodology, Writing – review and editing. BK: Conceptualization, Investigation, Writing – original draft. FK: Investigation, Methodology, Software, Writing – original draft. IA: Funding acquisition, Resources, Software, Writing – original draft, Writing – review and editing. AA: Resources, Software, Writing – original draft.
Funding
The author(s) declare that financial support was received for the research and/or publication of this article.
Acknowledgments
This work was supported by King Saud University, Riyadh, Saudi Arabia, through ongoing research funding program (ORF-2025-184).
Conflict of interest
Author AA was employed by Optiwave Systems Inc.
The remaining authors declare that the research was conducted in the absence of any commercial or financial relationships that could be construed as a potential conflict of interest.
Generative AI statement
The author(s) declare that no Generative AI was used in the creation of this manuscript.
Publisher’s note
All claims expressed in this article are solely those of the authors and do not necessarily represent those of their affiliated organizations, or those of the publisher, the editors and the reviewers. Any product that may be evaluated in this article, or claim that may be made by its manufacturer, is not guaranteed or endorsed by the publisher.
References
1. Wang Y, Wu J, Lv M, Shao Z, Hungwe M, Wang J, et al. Metabolism characteristics of lactic acid bacteria and the expanding applications in food industry. Front Bioeng Biotechnol (2021) 9:612285. doi:10.3389/fbioe.2021.612285
2. Zhang Y, Li X, Chen X. Optimization of acetic acid fermentation from soybean meal hydrolysate using response surface methodology. J Food Sci Technology (2020) 57(5):1785–94.
3. Wang Y, Li Y, Liu Y. Advances in acetic acid fermentation: mechanisms, challenges, and applications. Biotechnol Adv (2019) 37(6):107410.
4. Grand View Research. Acetic acid market size, share and trends analysis report (2022). Available online at: https://www.grandviewresearch.com/industry-analysis/acetic-acid-market (Accessed on February 11, 2025).
5. Mains TP, Payne FA, Sama MP. Monitoring yogurt culture fermentation and predicting fermentation endpoint with fluorescence spectroscopy. Trans ASABE (2017) 60(2):529–36.
6. Cui Y, Shi X, Tang Y, Xie Y, Du Z. The effects of heat treatment and fermentation processes on the formation of furfurals in milk-based dairy products using a QuEChERS technique followed by gas chromatography coupled with triple quadrupole mass spectrometry. Food Chem (2020) 313:125930. doi:10.1016/j.foodchem.2019.125930
7. Topic Bozic J, Butinar L, Curko N, Kovacevic Ganic K, Mozetic Vodopivec B, Korte D, et al. Implementation of high performance liquid chromatography coupled to thermal lens spectrometry (HPLC-TLS) for quantification of pyranoanthocyanins during fermentation of Pinot Noir grapes. SN Appl Sci (2020) 2:1–15.
8. Greulich O, Duedahl-Olesen L, Mikkelsen MS, Smedsgaard J, Bang-Berthelsen CH. Fourier transform infrared spectroscopy tracking of fermentation of oat and pea bases for yoghurt-type products. Fermentation (2024) 10(4):189. doi:10.3390/fermentation10040189
9. Bowler A, Ozturk S, di Bari V, Glover ZJ, Watson NJ. Machine learning and domain adaptation to monitor yoghurt fermentation using ultrasonic measurements. Food Control (2023) 147:109622. doi:10.1016/j.foodcont.2023.109622
10. Ramezani M, Ferrentino G, Morozova K, Scampicchio M. Multiple light scattering measurements for online monitoring of milk fermentation. Foods (2021) 10(7):1582. doi:10.3390/foods10071582
11. Muncan J, Tei K, Tsenkova R. Real-time monitoring of yogurt fermentation process by aquaphotomics near-infrared spectroscopy. Sensors (2020) 21(1):177. doi:10.3390/s21010177
12. Feng Y, Tian X, Chen Y, Wang Z, Xia J, Qian J, et al. Real-time and on-line monitoring of ethanol fermentation process by viable cell sensor and electronic nose. Bioresources and Bioprocessing (2021) 8(1):37. doi:10.1186/s40643-021-00391-5
13. Lidgren L, Lilja O, Krook M, Kriz D. Automatic fermentation control based on a real-time in situ SIRE biosensor regulated glucose feed. Biosens Bioelectron (2006) 21(10):2010–3. doi:10.1016/j.bios.2005.09.012
14. Zhang Z, Ding Y, Hu F, Liu Z, Lin X, Fu J, et al. Constructing in-situ and real-time monitoring methods during soy sauce production by miniature fiber NIR spectrometers. Food Chem (2024) 460:140788. doi:10.1016/j.foodchem.2024.140788
15. Phuong J, Salgado B, Heiß J, Steimers E, Nickolaus P, Keller L, et al. Real-time monitoring of fermentation processes in wine production with benchtop 1H NMR spectroscopy. Food Res Int (2025) 203:115741. doi:10.1016/j.foodres.2025.115741
16. Nascimento RJAD, Macedo GRD, Santos ESD, Oliveira JAD. Real-time and in situ near-infrared spectroscopy (NIRS) for quantitative monitoring of biomass, glucose, ethanol, and glycerine concentrations in an alcoholic fermentation. Braz J Chem Eng (2017) 34(2):459–68. doi:10.1590/0104-6632.20170342s20150347
17. Ghosh A, Bag AK, Sharma P, Tudu B, Sabhapondit S, Baruah BD, et al. Monitoring the fermentation process and detection of optimum fermentation time of black tea using an electronic tongue. IEEE Sensors J (2015) 15(11):6255–62. doi:10.1109/jsen.2015.2455535
18. Thauer RK. Biochemistry of methanogenesis: a tribute to marjory stephenson: 1998 marjory stephenson prize lecture. Microbiology (1998) 144(9):2377–406. doi:10.1099/00221287-144-9-2377
19. Ping X, Cao X, Cao C, Lei H, Yang C, Cheng Q, et al. Fiber grating hydrogen sensor: progress, challenge and prospect. Adv Sensor Res (2024) 3(2):2300088. doi:10.1002/adsr.202300088
20. Mirza J, Kanwal F, Salaria UA, Ghafoor S, Aziz I, Atieh A, et al. Underwater temperature and pressure monitoring for deep-sea SCUBA divers using optical techniques. Front Phys (2024) 12:1417293. doi:10.3389/fphy.2024.1417293
Keywords: fermentation endpoint, Soybean, Palladium, Hydrogen sensing, fiber Bragg grating, wavelength sensitivity, induced stress
Citation: Mirza J, Atieh A, Kanwal B, Kanwal F, Aziz I and Almogren A (2025) Fermentation endpoint detection of Soybean using specially designed
Received: 18 March 2025; Accepted: 26 May 2025;
Published: 18 June 2025.
Edited by:
Rajib Biswas, Tezpur University, IndiaReviewed by:
Muhammad Ijaz, Manchester Metropolitan University, United KingdomXiao Sun, Curtin University, Australia
Copyright © 2025 Mirza, Atieh, Kanwal, Kanwal, Aziz and Almogren. This is an open-access article distributed under the terms of the Creative Commons Attribution License (CC BY). The use, distribution or reproduction in other forums is permitted, provided the original author(s) and the copyright owner(s) are credited and that the original publication in this journal is cited, in accordance with accepted academic practice. No use, distribution or reproduction is permitted which does not comply with these terms.
*Correspondence: Imran Aziz, aW1yYW4uYXppekBwaHlzaWNzLnV1LnNl; Ahmad Almogren, YWhhbG1vZ3JlbkBrc3UuZWR1LnNh