 Kazuya Hayata
- Sapporo Gakuin University, Ebetsu, Japan
The complex systems approach to natural language has become a fascinating topic that is closely related to physics and linguistics. We assess the quality of translations of English literary passages into Japanese and perform a comparative study on several translations. First, translated writings are expressed with 45 syllabics, and subsequently, the ranking of their frequencies is analyzed statistically with the combined use of a nonlinear regression and the Durbin–Watson ratio, which allows one to detect the serial correlation in a sequence. To examine the correlations of syllabic sequences, regressions are made on both a long-tailed (LT) and a short-tailed function. The validity of our method for revealing correlations in the Markovian sequences of Japanese syllabics is confirmed by comparing the results of two original examples: popularity ranking of boy names and passages from a Japanese novel. Subsequently, the method is applied, for the first time to our knowledge, to sixteen translations of passages from Edgar Allan Poe (1809–49), and five backtranslations of those from Kenzaburo Oe (1935–2023), a Japanese Nobel laureate for literature in 1994. A diachronic analysis of computed results for the latter translations by three humans and two artificial intelligences (AIs) shows that while the quality of the translation by Google Translate (as of April 2020) falls far short of the human translator next in rank, the updated version (as of October 2024) is comparable to the top, but it still might be too soon to speculate on its unconditional potentiality. Both our methodology and results are not only novel but are also expected to make a contribution toward an interdisciplinary study between physics and linguistics.
1 Introduction
Revealing a pattern in natural language has become a fascinating topic closely related to physics and linguistics [1–3]. The origin of the topic might be traced back as far as the beginning of the last century, when Thomas Corwin Mendenhall (1841–1924), an American geophysicist once serving as Visiting Professor of Physics at Tokyo Imperial University, found a statistical pattern in the word-length data that included not only English but also other Indo-European languages [4]. Nowadays, in an analogy with the spectroscopy of sunlight, the pattern of frequency versus word length is referred to as word spectra. It is somewhat surprising that the pioneering work by Mendenhall was conducted nearly half a century before George Kingsley Zipf (1902–1950) published an empirical law on the frequency of occurrence of English words. Later on, Mendenhall’s achievement was carried forward by C. B. Williams, contributing to a worldwide argument on the authenticity of the works by Shakespeare and Bacon [5]. The study of word spectra has been expanded up to non-European languages such as the Ural-Altaic and Austronesian languages [6]. Instead of ordinary words, part-of-speech sequences of literary texts have been analyzed as well. It has been shown that Zipf’s law also holds for them, but with a different exponent for ranks in a certain region [7]. In more recent years, statistics of punctuation have become a topic in the novel context of experimental literature. Specifically, fractalities and long-range correlations have been found in Chinese prose [8], as well as Finnegans Wake by James Joyce [9] and Hopscotch by Julio Cortázar [10]. In addition to these studies on human writings, topics related to phonology have become more popular. Indeed, efforts have been made to develop methodologies for quantitatively approaching so-called phonological complexities [11], in which computation of stabilities for phonological inventories has been implemented in, for instance, the UCLA Phonological Segment Inventory Database (UPSID). In particular, it seems worth noting that along with those in human writings, complexities in phonology are closely related to statistical physics of spin glasses [12, 13] and quantum correlations [14].
We here assess the quality of translations of English literary passages into Japanese using a quantitative approach to reveal a nontrivial pattern in natural language, and a comparative study is conducted on the translations of passages into the language. First, the translated writings are written using 45 syllabics, and subsequently, the ranking of their frequencies is analyzed statistically with the combined use of nonlinear regression and the Durbin–Watson ratio. Here, to examine correlations in syllabic sequences, regression analysis was conducted on both long-tailed (LT) and short-tailed functions. Because of no deductive reasoning available, the validity of our method needs to be confirmed a posteriori. In a previous article [15] aiming at a verification of dialectal asymmetries, we considered two examples: a sequence of captions in a novel and a parade of fictitious monsters. Furthermore, to prove the potential ability of our method, it was applied to stochastic music consisting of white, pink (so-called 1/f), and brown tricolors. The main findings in the pitch data were as follows: 1) in usual playing (i.e., forward sequence), the mean value of the fit for the long-tailed function, |r|, as presented in Equation 1d, raises significantly for the 1/f music, and 2) in the reverse playing (i.e., backward sequence), the value decreases monotonically in order from white, pink, and brown. These observations of the pitch data suggest the importance of detecting time reversal asymmetry (TRA) in evaluating not only the quality of music but also that of texts composed with the syllabics. In this paper, the validity of our method is further confirmed by comparing results of two examples: popularity ranking of boy names and passages from Sei-naru Haru, “The Sacred Spring,” a Japanese novel. It should be noted here that along with time-dependent juxtapositions of words, human writings in natural languages more or less preserve long-range correlations, in which the choice of syllabics in the latter part of the sentences depends on the choice in the former. The so-called word-for-word translation or a translated piece of writing that has not been fully conceived, however, tends to preserve correlations solely within a short range. Subsequently, the method is applied to sixteen translations of passages from Edgar Allan Poe (1809–49) and five backtranslations of passages from Kenzaburo Oe (1935–2023), a Japanese Nobel laureate for literature in 1994. A detailed analysis demonstrates that in human translations as well as in original writings, symmetry is spontaneously broken toward the long-tailed distribution, whereas in the translations using artificial intelligence (AI), there is no noticeable breaking of symmetry between the long- and short-tailed distributions. To our knowledge, this observation on the broken symmetry is novel and, at the same time, can be expected to have a nontrivial impact on the interdisciplinary field between physics and linguistics. A diachronic analysis of results from human and AI translations reveals the potential of an updated machine translation by a specific AI.
2 Methods
The Linguistic Atlas Project (LAP) for the United States and southern Canada suggested that the frequencies of responses versus their ranks follow a long-tailed distribution. Although detailed studies showed that the rule can be found in every kind of natural language data that include syllables [1, 2], the specific form of the long-tailed function depends on the type of data. For statistics in word association surveys [1, 2], where the number of categorical responses could exceed a hundred, one can see a substantially long tail being best fitted to a power-law relation. For the analysis of syllabic as well as letter occurrences, however, in which, at most, there are tens of categories, the length of the tails is not as long as that observed in the so-called Zipf’s law for word statistics, which typically involves tens to thousands of word categories (Table 1). For instance, for Japanese syllabics, it can be written as [15]
where log denotes an abbreviation of the common logarithm (log10); y corresponds to the frequency of each of the N individual syllabics that are contained in the words appearing from the start (n = 1) to the present site (n = k; k = 2, 3, 4, …); x represents the rank variable in descending order, such that x = 1 for y = y(1), x = 2 for y = y(2), ・・・, and x = N for y = y(N), where y(i) indicates the ordered statistics of yi (yi with suffix i indicating the cumulative frequency of the ith syllabic) as y(1) > y(2) > ・・・> y(N). The parameters a and b are constants to be determined with the least squares fit,
where (u, v) = (log x, y). The symbols suv, su2, mu, and mv, indicate the covariance between u and v, the variance of u, and the means of u and v, respectively. It should be stressed that, along with the examples in our previous article [15], the validity of the function, Equation 1a, has been established for the alphabetical statistics for the analysis of English texts [16] as well as for the linguistics of DNA sequences [17].
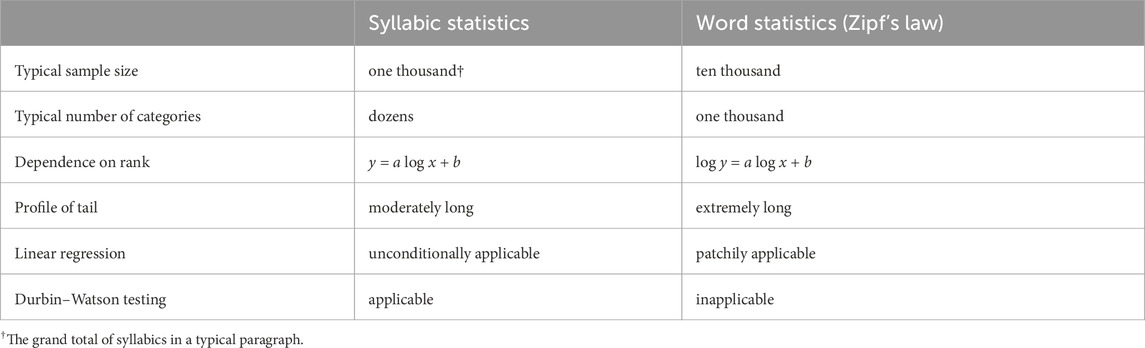
Table 1. Comparison of syllabic and word statistics.
The quality of regression can be measured using the degree of fit, |r|, i.e., with the correlation coefficient (0 < |r| < 1), and with the Durbin–Watson ratio, d (0 < d < 2 for positive serial correlations, while 2 < d < 4 for negative serial correlations; d = 2 for null correlation) [18],
where the symbol sv in the denominator of the right-hand side of Equation 1d indicates the standard deviation of v, and in Equation 1g, v’ indicates the point on the regression line, Equation 1a. Note that for Japanese writings, N is equal to 45. For the rank-size or rank-frequency analysis, in most cases, positive correlations are observed between the neighboring data points [15]. In consequence, not only as |r| → 1 but also as d → 2, the long-tailed fitting of Equation 1a can be regarded as authentic.
To verify the validity of the long-tailed nature of Equation 1a, we consider a function with a short-tailed decay bearing dual relation with Equation 1a:
Again, the parameters a and b are constants to be determined with the least squares fit, which are obtained using Equations 1b, 1c, respectively, but u and v are replaced with (u, v) = (x, log y).
3 Examples for testing methodology
To re-examine the validity of our method for the analysis of general writings, we consider other two examples in this section: a sequence of Japanese boy names and passages from Sei-naru Haru, “The Sacred Spring.”
3.1 Ranking of boy names
3.1.1 Usual reading
Although in this paper we do not focus on a juxtaposition of names but on a sequence of sentences (namely, texts), these two can be regarded as two sides of the same coin because a chain of names being ordered according to a hidden rule exhibits more or less a Markovian nature, where how to choose the next name depends on the prior names. Figures 1A,B show the results for the ranking of 800 Japanese boy names that are written with 45 syllabics [19], Ni (i = 1, 2, … … , 799, 800) under the usual reading: N1 →N2 → … … →N799 →N800. The figure includes (A) sequential variations in the degree of fit, |r|, to the long- and short-tailed distributions for the cumulative syllabic frequency versus rank and (B) variations in the Durbin–Watson ratio, d. In both (A) and (B), the fitting to the long-tailed function, Equation 1a, is plotted in red, in contrast to blue for that to the short-tailed counterpart, Equation 2. For the long-tailed function, the mean values of |r| and d, are 0.989 and 1.603, respectively, while for the short-tailed function, those of |r| and d, are 0.969 and 0.841, respectively.
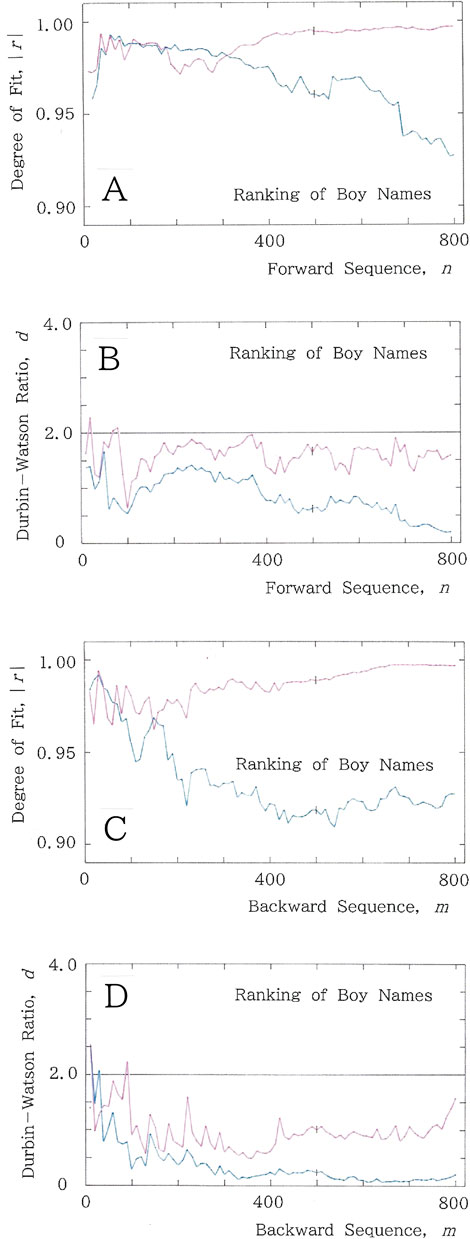
Figure 1. Example results for the ranking of 800 Japanese boy names [19], where the fitting to the long-tailed function (Equation 1a) is plotted in red, while that to the short-tailed function (Equation 2) is plotted in blue. (A) Sequential variations of the degree of fit, |r|. (B) Sequential variations of the Durbin–Watson ratio, d. (C) Backward sequential variations of the degree of fit, |r|. (D) Backward sequential variations of the Durbin–Watson ratio, d.
3.1.2 Reverse reading
Although we deal with a ranking sequence, the inherent nature in human naming shares its time-dependent property with Markovian sequences exhibiting long-range correlations [20, 21]. Our ranking starts from relatively archaic or familiar names and proceeds toward rather exotic or unfamiliar ones. To investigate whether our method can reveal the TRA (Figures 1C,D), results for the backward ranking of 800 Japanese boy names that are written with 45 syllabics (i.e., an unusual reading; reading from the end toward the start: N800 →N799 → … … →N2 →N1) are presented, where the fitting to the long-tailed function, Equation 1a, is plotted in red, in contrast to blue for that to the short-tailed counterpart, Equation 2. Specifically, Figure 1C plots backward sequential variations of the degree of fit, |r|, to the long- and short-tailed distributions for the cumulative syllabic frequency versus rank. The mean value of |r| is 0.987 for the long tail and 0.935 for the short tail. Subsequently, in Figure 1D, backward sequential variations of the Durbin–Watson ratio, d, are given. The mean values of d are 0.981 and 0.363, respectively.
The large difference between the forward (Figures 1A,B) and reverse (Figures 1C,D) reading can be explained qualitatively as follows: suppose a man who was assigned to be a godfather of 800 boys, and assume that in a series of the naming, no duplication is allowed. First of all, it should be noticed that he ought to be bound by the explicit rule (i.e., the inhibition of complete duplication among syllabics), which will be most responsible for observing a long-range correlation in the sequence. Along with the rule, he is bound by several implicit rules such as avoidance of words that are contrary to morals. In addition, he is inevitably confined to a sound pattern in his native language. Consequently, as the naming proceeds, these restrictions will frustrate him because, in contrast to the many choices available at first, he is about to exhaust his resources for vocabulary. Later, he will find a compromise by generating names being slightly modified from the preceding names. This modification will necessarily result in the repetitive use of the same word root. The tactics seem to be responsible for enhancing redundancy, especially in the latter part of the name sequence. Next, we suppose that the resultant sequence of the 800 names is analyzed with our method mentioned in Section 2. For the forward analysis (i.e., usual reading: N1→ N2 → … … → N799→N800), the cumulative frequencies of syllabics versus their ranks are expected to obey well the long-tailed distribution of Equation 1a. There will be a few highly common syllabics, a handful syllabics that are fairly common, and many syllabics that occur only a couple of times [1, 2, 15]. In contrast to the forward reading, for the reverse reading (N800→ N799 → … … →N2 →N1), at the beginning part, in particular, the cumulative frequencies of syllabics versus their ranks are supposed to exhibit a short-tailed distribution because the contents of the syllabary will be occupied by several common syllabics, followed by uncommon ones.
3.1.3 Plotting scattergram
To display the TRAs more sharply, Figure 2A presents a scattergram for the Durbin–Watson ratio of the red lines (i.e., fitted to Equation 1a) in Figures 1B,D, where n = m. It can be observed that there are four sections (I–IV) divided by the twin lines crossed perpendicularly on (x, y) = (2, 2):
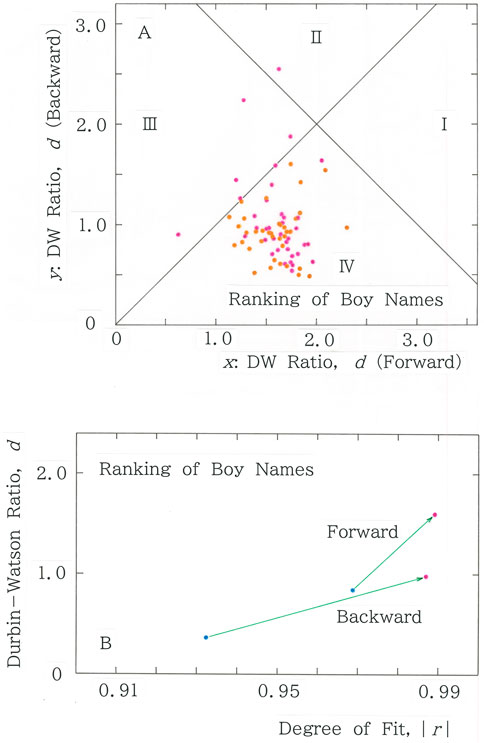
Figure 2. (A) Scattergram of the Durbin–Watson ratio for n = m of the red lines (i.e., fitted to the long-tailed function, Equation 1a) in Figures 1B,D. Mean: (x, y) = (1.602, 0.981); CV: (x, y) = (0.154, 0.364). (B) Vectorial representation for the means of the two characteristic values, where vectors are directed from the short-tailed fitting (blue dot) to the long-tailed fitting (red dot).
Counting the scatter points (both red and orange dots) in the four regions allows us to conclude that if there are more points in Section 2 or Section 4 than those in Section 1 or Section 3, the sequence under consideration displays the TRA. Specifically, in Figure 2A, we find 74 points in Section 2 or Section 4, compared to 6 points in Section 1 or Section 3. A scattergram of the degree of fit to Equation 1a shows two regions sectioned by y = x; red dots in Figure 2A designate points in the upper region of the scattergram of y versus x, while orange dots designate those in the lower region.
3.1.4 Statistical testing
To investigate the authenticity of the TRA for the ranking of boy names, a binomial test (with α denoting significant level) has to be performed based on the hypothesis that the ranking is reversible [22]. With p being the probability of finding a point in the target (i.e., orange dots in Section 2 or Section 4 in Figure 2A), we define this hypothesis as follows:
where H and K are the null and the alternative hypothesis, respectively. Because 39 points are detected in the target, the cumulative probability of the frequency can be expressed as follows:
Therefore, for α = 5 × 10⁻⁶, the null hypothesis H is rejected. The ranking of the 800 Japanese boy names is not reversible (α = 5 × 10⁻⁶).
3.1.5 Vectorial representation
Finally, to illustrate the dominance of the long-tailed distribution, Figure 2B presents a vectorial representation of the means of the two characteristic values, where vectors are directed from the short-tailed fitting (blue dot) to the long-tailed one (red dot). Here, the magnitude of the vector quantifies the difference between the two fittings, Equations 1a, 2, while the direction (denoted with
Here, a counterclockwise rotation is assumed. We notice that both vectors in Figure 2B correspond to the type of Equation 6a, indicating LT dominance, although the angle of the forward reading is larger than that of the reverse reading.
3.2 Passages from a Japanese novel
3.2.1 Usual reading
Example results are presented in Figure 3 for passages composed of 67 phrases and 1,305 syllabics from Sei-naru Haru [23], “The Sacred Spring,” a Japanese novel written by Teruhiko Kuze (1935–2006), where the fitting to the long-tailed function (Equation 1a) is plotted in red, while that to the short-tailed function (Equation 2) is plotted in blue. Figure 3A shows sequential variations in the degree of fit, |r|, to the long- and short-tailed distributions for the syllabic frequency versus rank, along with Figure 3B showing the Durbin–Watson ratio. For the long-tailed function, the mean values of |r| and d are 0.992 and 1.836, respectively, while for the short-tailed function, those are 0.970 and 0.852, respectively. Note that as the data in the vicinity of the start (specifically n = 1 and 2) are too degenerate to make a regression, the mean values are obtained for 2 < n < 68 and that to avoid singularities of Equation 2, null frequencies are not included in our calculation.
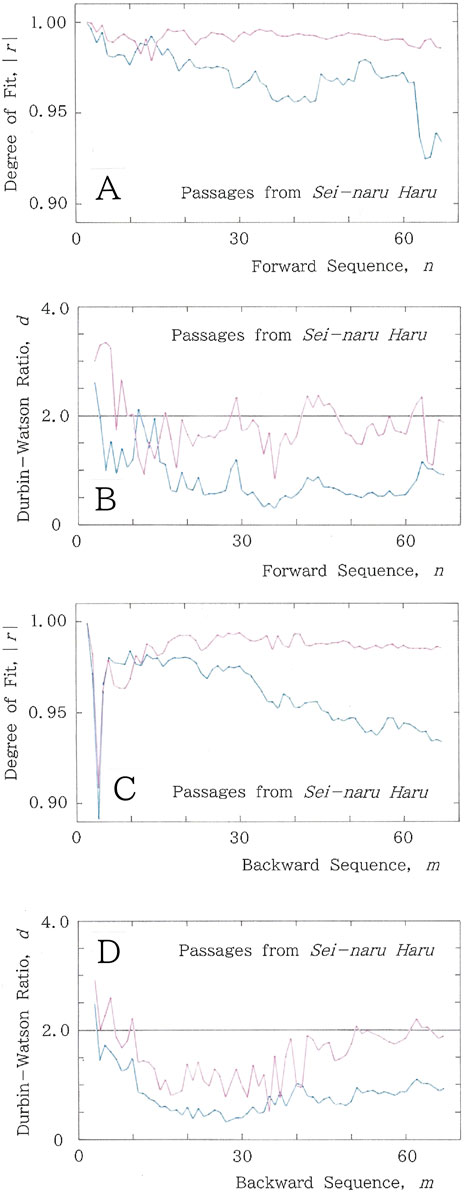
Figure 3. Example results for passages from Sei-naru Haru by Teruhiko Kuze [23], where the fitting to the long-tailed function (Equation 1a) is plotted in red, while that to the short-tailed function (Equation 2) is plotted in blue. (A) Sequential variations of the degree of fit, |r|. (B) Sequential variations of the Durbin–Watson ratio, d. (C) Backward sequential variations of the degree of fit, |r|. (D) Backward sequential variations of the Durbin–Watson ratio, d.
3.2.2 Reverse reading
To examine the TRA, for the same passages, results of the degree of fit, |r|, in the backward sequential variations are shown in Figure 3C. The mean values of |r| are 0.985 and 0.960 for the long and short tails, respectively. Backward sequential variations of the Durbin–Watson ratio, d, are displayed in Figure 3D, where the mean values of d are 1.539 and 0.820, respectively. In comparison with the forward reading, for the backward counterpart, both |r| and d exhibit substantial reduction. Exactly, human writings are utterly far from palindromic.
Notable TRA is observed, similar to that mentioned above for Figure 1. Every professional writer (assuming a man for convenience) will make efforts to replace proper nouns with their pronouns that include not only personal and possessive ones but also demonstrative and adjectival ones. However, as the resource of the vocabulary is limited, he cannot get rid of the redundancy completely. Note that in contrast to European languages, in Japanese, the vocabulary size of the verb is very less. Furthermore, inevitable asymmetries in the distribution of a specific conjunction in a paragraph will be responsible not only for enhancing TRA but, as presented through an experiment in Section 5.3, also for reducing the fit to the long-tailed distribution.
3.2.3 Statistical testing and vectorial representation
For n = m, the scattergram of the Durbin–Watson ratio of the red lines (i.e., fitted to the long-tailed function, Equation 1a) can be depicted, from which we have obtained Mean: (x, y) = (1.836, 1.539); CV: (x, y) = (0.273, 0.318). Here, 37 points are distributed in Section 2 or Section 4, while 28 points are distributed in Section 1 or Section 3. A scattergram for the degree of fit to Equation 1a shows two regions sectioned by y = x. Given that 31 points are observed in the target and assuming the hypotheses of Equation 4 hold, Equation 5 for the cumulative probability of the frequency should be replaced with
Therefore, for α = 10–4, the null hypothesis H is rejected. The passages from Teruhiko Kuze are not reversible (with α = 10–4).
In Figure 4, the vectorial representation for the means of the two characteristic values is displayed, where, as shown in Figure 2B, vectors are directed from the short-tailed fitting (blue dot) to the long-tailed one (red dot). As shown in Figure 2B, the angles of both vectors can be categorized into the type of Equation 6a, which confirms the LT dominance.
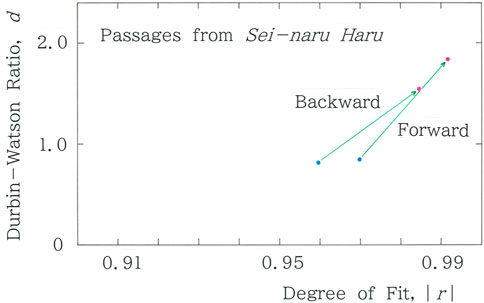
Figure 4. Vectorial representation for the means of the two characteristic values, where vectors are directed from the short-tailed fitting (blue dot) to the long-tailed fitting (red dot).
4 Results: comparison among human and machine translations
Now that the validity of our method has been confirmed through a series of results shown in Figures 1–4, along with Figures 3–9 in [15], sharing the underlying methodology with the present study, we proceed to apply it to the translated passages.
4.1 Translated passages from Edgar Allan Poe
4.1.1 Human translations
We consider the opening paragraph in The Fall of the House of Usher [24], a short story written by Edgar Allan Poe (1809–49), an American mystery writer and poet regarded as a pioneer of detective stories. To our knowledge, this short story has been translated 13 times into Japanese over the past 95 years [25–37]. The original English text [24] is included in Supplementary Appendix 1. First, example results for the translation by Takayoshi Ogawa (1956-) [37], which has generated 1,217 syllabics, are shown in Figures 5A,B, where fitting to the long-tailed function (Equation 1a) is plotted in red, while that to the short-tailed function (Equation 2) is plotted in blue. Specifically, Figure 5A shows sequential variations in the degree of fit, |r|, to the long- and short-tailed distributions for the syllabic frequency versus rank. For the long-tailed function, the mean value of |r| is 0.992, while for the short-tailed counterpart, the value is 0.960. Subsequently, Figure 5B shows sequential variations in the Durbin–Watson ratio, d, where the mean values of d are 1.323 and 0.673 for the long and short tails, respectively.
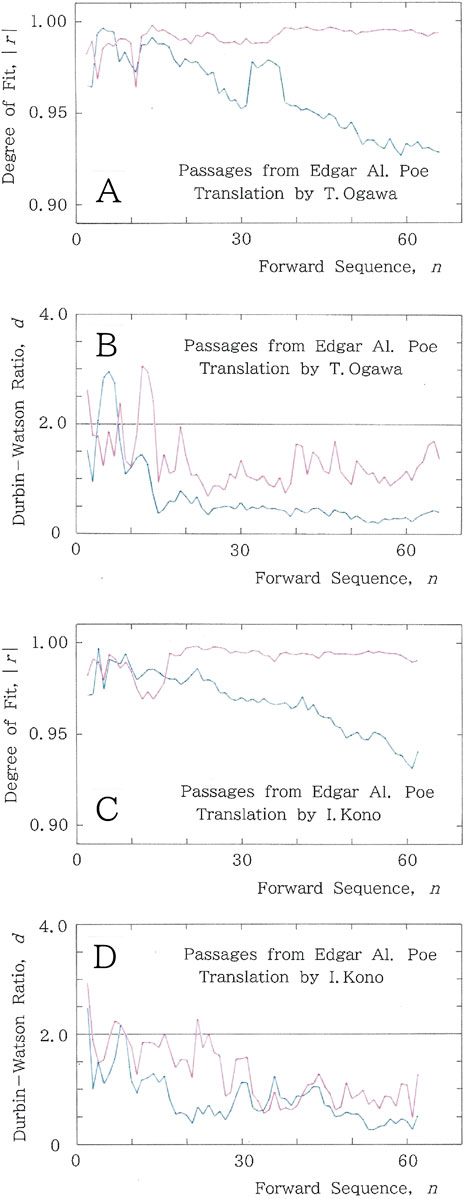
Figure 5. Computed results for a translated paragraph from Edgar Allan Poe [24], where the fitting to the long-tailed function (Equation 1a) is plotted in red, while that to the short-tailed function (Equation 2) is plotted in blue. For translation made by Takayoshi Ogawa [37], (A) sequential variations of the degree of fit, |r| and (B) sequential variations of the Durbin–Watson ratio, d. For translation made by Ichiro Kono [31], (C) sequential variations of the degree of fit, |r| and (D) sequential variations of the Durbin–Watson ratio, d.
As a second example, the computed results for the translation by Ichiro Kono (1930–2023) [31] (1,038 syllabics) are shown in Figures 5C,D. Figure 5C presents the sequential variations in the degree of fit, |r|, to the long- and short-tailed distributions for the syllabic frequency versus rank. For the long-tailed function, the mean value of |r| is 0.991, while for the short-tailed function, the value is 0.968. In Figure 5D, sequential variations of the Durbin–Watson ratio, d, are displayed, with mean values of 1.277 and 0.828, respectively.
Next, to illustrate the dominance of the long-tailed distribution in Figure 5, and at the same time, to highlight the TRA in their translations by superimposing the vector for the backward sequence, Figure 6 presents a vectorial representation of the means of the two characteristic values, where vectors are directed from the short-tailed fitting (blue dot) to the long-tailed fitting (red dot). It is interesting to compare this with Figure 2B. We notice that, in the same way as those in Figure 2B, all vectors in Figures 6A–D correspond to the type of Equation 6a, indicating LT dominance, although in both translations, the angle of the forward reading is larger than that of the reverse reading.
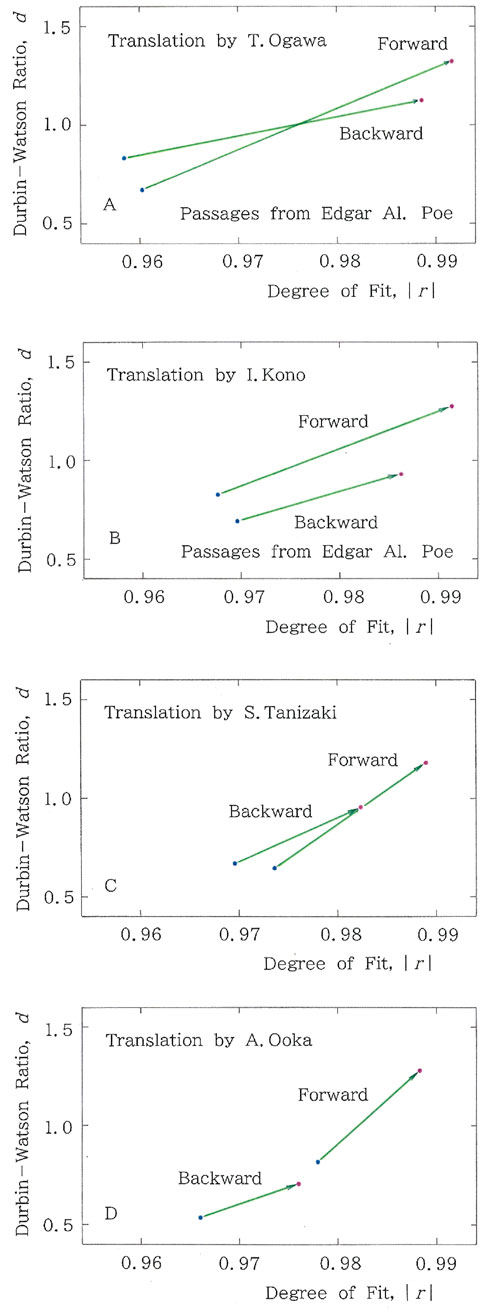
Figure 6. Vectorial representation for the means of the two characteristic values for both the forward and backward reading analyses of the opening paragraph translated by (A) Takayoshi Ogawa, (B) Ichiro Kono, (C) Seiji Tanizaki, and (D) Akira Ooka.
For Ogawa’s (Figure 6A), Kono’s (Figure 6B), Tanizaki’s (Figure 6C), and Ooka’s translations (Figure 6D), given that 33, 43, 30, and 52 points, respectively, are observed in the target, and assuming the hypotheses of Equation 4 hold, Equation 5 for the cumulative probability of the frequency should be replaced with
Therefore, for α = 10–5, 5 × 10⁻¹³, 10–7, and 5 × 10⁻¹⁷, the null hypothesis H is rejected. Namely, the translations by Ogawa, Kono, Tanizaki, and Ooka are not reversible (with α = 10–5, 5 × 10⁻¹³, 10–7, and 5 × 10⁻¹⁷, respectively).
4.1.2 Machine translations
Finally, we analyze a machine translation of the passages from Poe, generated by Google’s translation system. Figure 7A illustrates sequential variations in the degree of fit, |r|, to the long- and short-tailed distributions for the syllabic frequency versus rank. For both fittings, the mean values of |r| are 0.981. Figure 7B shows sequential variations in the Durbin–Watson ratio, d, with mean values of 0.950 and 1.088, for the long-tailed and short-tailed fittings, respectively. Comparing the long-tailed fittings produced by human intelligence (Figure 5) with those generated by AI (Figure 7) reveals that, in the translation of English into Japanese, the latter falls far short of the former. It should be noted that results for other machine translations (DeepL and ChatGPT) have not shown a substantial difference from Figure 7 (Google Translate). That is, for the long-tailed fitting, |r|: 0.972 (DeepL) < 0.981 (Google Translate) < 0.985 (ChatGPT) < 0.991 (Kono) < 0.992 (T. Ogawa) and d: 0.871 (DeepL) < 0.950 (Google Translate) < 1.207 (ChatGPT) < 1.277 (Kono) < 1.323 (T. Ogawa). For more details, see tables in Supplementary Appendices 2, 3 and cross-sectional plots in Supplementary Appendix 4. In particular, it is noteworthy that the difference in the metrics given in the caption of Supplementary Appendix 4 is consistent with a clear visual discrepancy among the rank–frequency plots. Indeed, stylistic inspection shows that although there appears no serious mistranslation, the style of the machine translations is far from idiomatic. In summary, it seems that the translations bear patches of fluency, but they are not integrated as an organic whole. It should be noted that this observation on the fluency is consistent with a comment by Matthew Reynolds [38] in his experiment on a Chinese-to-English translation using the same translation device, saying “It just hasn’t yet got enough to go on to be able to stitch the patches together perfectly.”
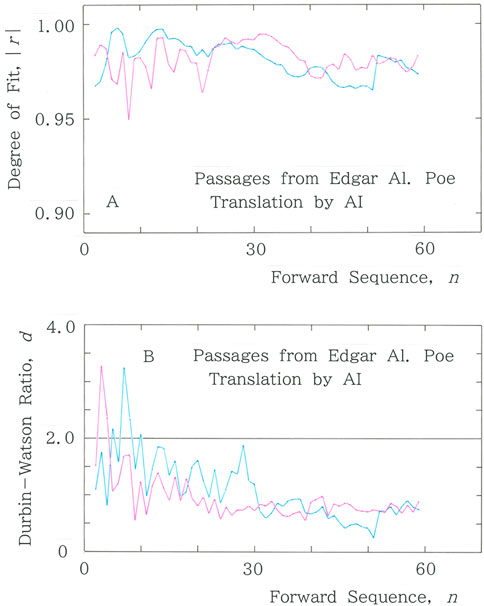
Figure 7. Results for a machine-translated paragraph from Poe, where the meaning of the colors is the same as in Figure 5. As an AI device, Google Translate is employed. (A) Sequential variations of the degree of fit, |r|. (B) Sequential variations of the Durbin–Watson ratio, d.
4.2 Original passages from Kenzaburo Oe
In this section, we focus on the backtranslation of Shiiku [39], a short novel written in Japanese by Kenzaburo Oe (1935–2023), the Nobel laureate for literature in 1994. Note that for this work, he was awarded the Akutagawa Prize in 1958, as an eminent young writer. Prior to the backtranslation [40], we first analyze the original Japanese text. The results for passages composed of 79 words sampled from the novel are presented in Figure 8A. In particular, sequential variations of the degree of fit, |r|, are shown to the long- and short-tailed distributions for the syllabic frequency versus rank, with Mean: |r| = 0.987 for Equation 1a and Mean: |r| = 0.983 for Equation 2. Sequential variations in the Durbin–Watson ratio, d, are displayed in Figure 8B, with Mean: d = 1.854 for Equation 1a and Mean: d = 0.977 for Equation 2.
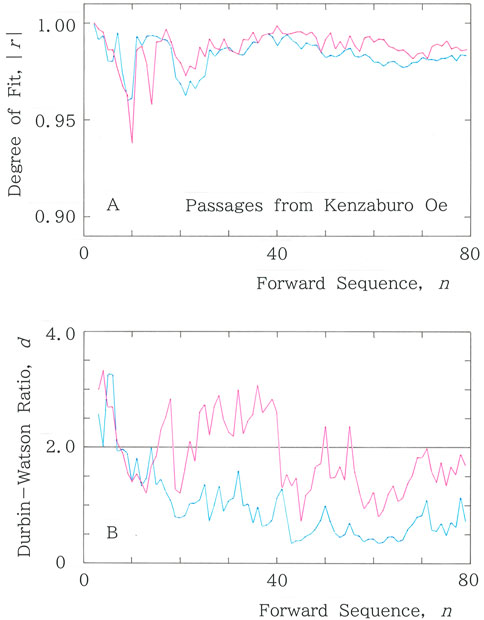
Figure 8. Computed results for passages being sampled from Shiiku, a short novel written by Kenzaburo Oe [39]. Note that the fitting to the long-tailed function (Equation 1a) is plotted in red, while that to the short-tailed function (Equation 2) is plotted in blue. (A) Sequential variations in the degree of fit, |r|. (B) Sequential variations in the Durbin–Watson ratio, d.
4.3 Back-translated passages from Kenzaburo Oe
4.3.1 Human translations
Now that the results of the original Japanese text have been obtained, we present those for the backtranslation of the published English text; the translation into English [41] is included in Supplementary Appendix 5. The procedure of the backtranslation can be explained as follows:
1) Initially, we start from an original Japanese story (assuming J1) that has been translated by a translator into a foreign language (assuming F).
2) Subsequently, the translated writing with language F is translated again into Japanese (assuming J2) by another translator, making no reference to the original text.
3) Eventually, we can obtain a chain of translations: J1→ F →J2.
This method, termed backtranslation, has been employed for testing the ability of the translators [40]. First, a comparison was made among three professional translators (HI#1, HI#2, and HI#3). Figure 9A shows the computed results of |r| versus n for the text that has been back-translated by a translator HI#1 (a male translator in his thirties) from the English version (Supplementary Appendix 5) of the Japanese original, with Mean: |r| = 0.976 for Equation 1a and Mean: |r| = 0.987 for Equation 2. In Figure 9B, the Durbin–Watson counterpart of Figure 9A is presented, with Mean: d = 1.644 for Equation 1a and Mean: d = 1.763 for Equation 2.
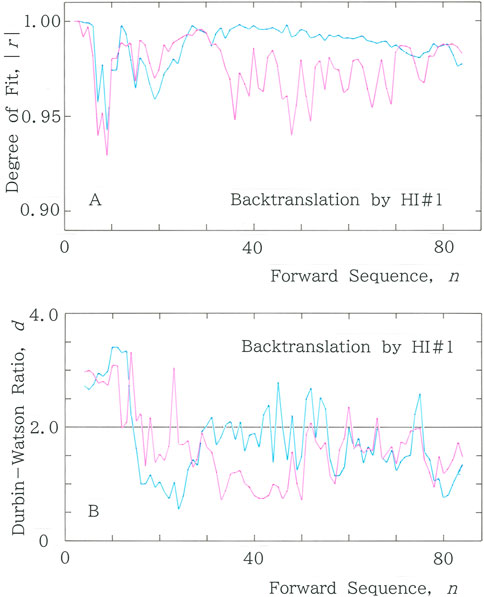
Figure 9. (A) Results of |r| versus n for the text that has been back-translated by a human translator HI#1 (a male translator in his thirties) from an English version of the Japanese original [41]. (B) Durbin–Watson counterpart of (A).
In Figure 10A, the results of |r| versus n are shown for the text, back-translated by HI#2 (a female translator in her early forties), from the English version of the Japanese original. The mean values are |r| = 0.986 for Equation 1a and |r| = 0.983 for Equation 2. Figure 10B shows the Durbin–Watson counterpart of Figure 10A, with Mean: d = 1.624 for Equation 1a and Mean: d = 1.116 for Equation 2.
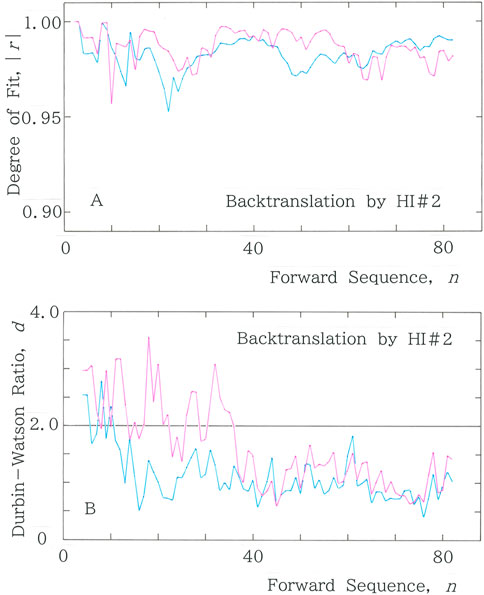
Figure 10. (A) Results of |r| versus n for the text that has been back-translated by a human translator HI#2 (a female translator in her early forties) from an English version of the Japanese original [41]. (B) Durbin–Watson counterpart of (A).
In Figure 11A, the results of |r| versus n are shown for the same text, back-translated by HI#3 (a female translator in her forties), where Mean: |r| = 0.977 for Equation 1a, while Mean: |r| = 0.988 for Equation 2. Figure 11B presents the Durbin–Watson counterpart of Figure 11A, with Mean: d = 1.026 for Equation 1a and Mean: d = 1.350 for Equation 2.
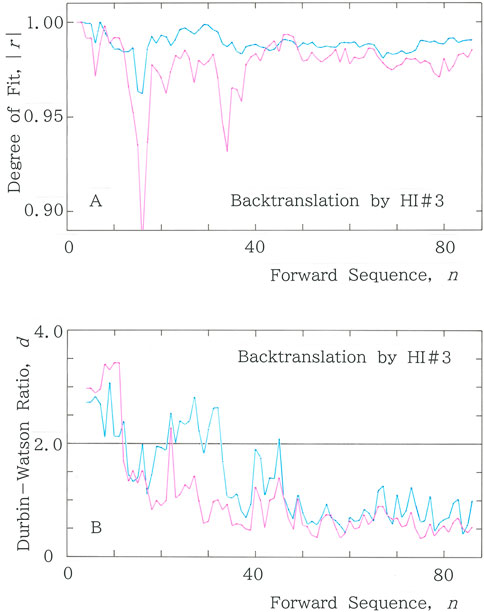
Figure 11. (A) Results of |r| versus n for the text that has been back-translated by a human translator HI#3 (a female translator in her forties) from an English version of the Japanese original [41]. (B) Durbin–Watson counterpart of (A).
4.3.2 Machine translations
As part of a diachronic analysis, we present the computed results of two machine translations generated by Google’s translation system. Figure 12A shows the results of |r| versus n for the back-translated text by a machine translator, AI#1 (as of April 2020), from the English version (Supplementary Appendix 5) of the Japanese original, where Mean: |r| = 0.974 for Equation 1a, while Mean: |r| = 0.989 for Equation 2. Subsequently, Figure 12B displays the Durbin–Watson counterpart of Figure 12A, where Mean: d = 1.233 for Equation 1a, while Mean: d = 1.170 for Equation 2. Finally, the results of |r| versus n for the back-translated text by a machine translator, AI#2 (as of October 2024), are presented in Figure 12C, where Mean: |r| = 0.984 for Equation 1a, while Mean: |r| = 0.986 for Equation 2. Figure 12D shows the Durbin–Watson counterpart of Figure 12C, with Mean: d = 1.974 for Equation 1a, and Mean: d = 1.599 for Equation 2. Comparison among the metrics for the long-tailed fitting shows |r|: 0.974 (AI#1) < 0.976 (HI#1) < 0.977 (HI#3) < 0.984 (AI#2) < 0.986 (HI#2) and d: 1.026 (HI#3) < 1.233 (AI#1) < 1.624 (HI#2) < 1.644 (HI#1) < 1.974 (AI#2).
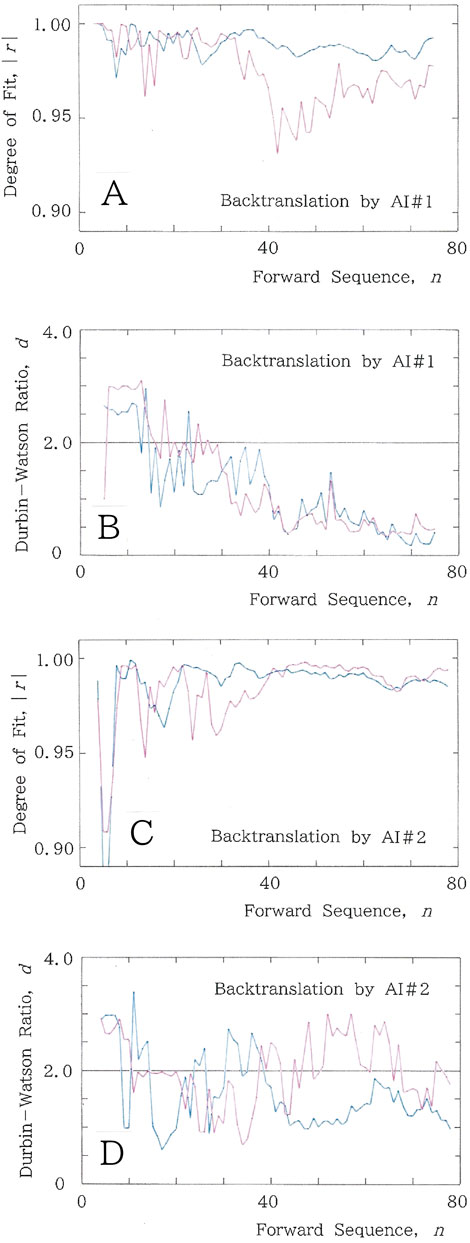
Figure 12. (A) Results of |r| versus n for the text that has been back-translated by a machine translator AI#1 in Google Translate (as of April 2020) from an English version of the Japanese original [41]. (B) Durbin–Watson counterpart of (A). (C) Results of |r| versus n for the text that has been back-translated by a machine translator AI#2 in Google Translate (as of October 2024) from an English version of the original text in Japanese [41]. (D) Durbin–Watson counterpart of C.
It should be stressed that the increased characteristic values for the long tail (|r| = 0.974→0.984; d = 1.233→1.974) are consistent with the improvement in the stylistic quality of the translated text. Careful inspection in the translation by AI#1 reveals several deficiencies, such as a few rudimental errors in Japanese grammar on the use of an active and a passive voice, an excessive repeat of a specific particle, and a rash transliteration instead of translation. In contrast to the translation by AI#1, we can find considerable improvement in the style of AI#2.
5 Discussion
5.1 Translated passages from the work by Edgar Allan Poe
To visualize a detailed comparison among the above-mentioned 14 translations, based on the results shown in Figures 5–7, vector scattergrams for the translated passages [25–37] from the Poe’s work [24] are plotted in Figures 13A,B. Red dots in Figure 13A represent the means for the long-tailed fitting (Equation 1a), while blue dots in Figure 13B represent those for the short-tailed fitting (Equation 2). The numeric values are listed in Supplementary Appendices 2, 3, for the red and blue dots, respectively. The initials TO and IK indicate the translations by Takayoshi Ogawa [37] (Figures 5A,B) and Ichiro Kono [31], respectively (Figures 5C,D); AI indicates a machine translation by Google (Figure 7). It is noticeable from Figures 13A,B that same-colored dots are in a cluster around a centroid. To depict a vectorial scattergram, in Figure 13C, the two dot patterns found in Figures 13A,B are superimposed, where green and orange vectors highlight discrimination between human and machine translations, respectively. It is interesting to note that in human translations (green vectors), except for a short vector in the vicinity of the orange vector, almost all vectors show the type of Equation 6a, in striking contrast to the machine translation (orange vector) exhibiting the type of Equation 6d.
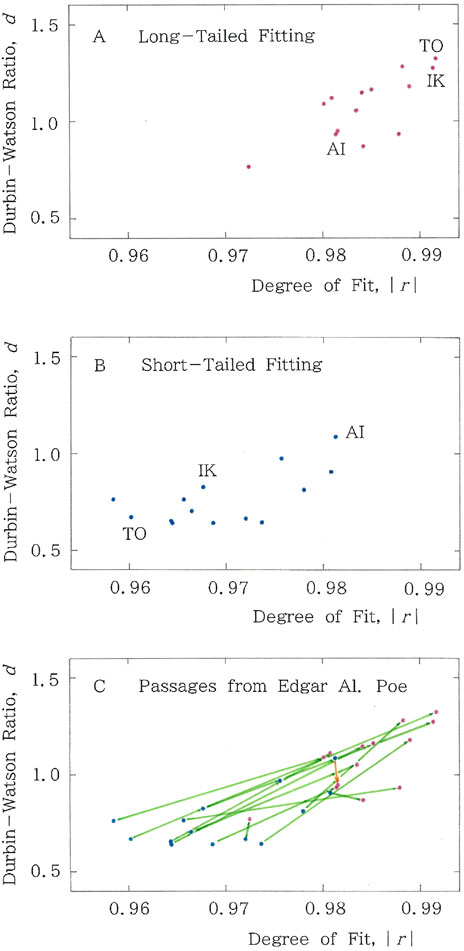
Figure 13. Scattergrams for translated passages from Poe. (A) Red dots represent the means for the long-tailed fitting (Equation 1a), while (B) blue dots represent those for the short-tailed fitting (Equation 2). The initial TO and IK indicate the translation by Takayoshi Ogawa [37] and Ichiro Kono [31], respectively; AI indicates a machine translation by Google Translate. (C) Superimposition of (A) and (B). Green and orange vectors highlight discrimination between human and machine translations, respectively.
Although it could not be assumed that our quantitative measure alone can completely capture the quality of translations, there seems to be a significant correlation between the computed results in Figure 13C and the achievements of the translators. To reveal this speculation in more detail, a trans-paragraph analysis has been carried out for the following four translators exhibiting relatively high scores, with red dots on the upper right in this figure:
Takayoshi Ogawa (1956–) [37],
Ichiro Kono (1930–2023) [31],
Seiji Tanizaki (1890–1971) [25], and
Akira Ooka (1958–) [35].
In addition to the first paragraph (denoted with Roman numeral I), the analysis has been expanded up to the subsequent two paragraphs, namely, the first plus second (denoted with II) and the first to third paragraphs (denoted with III). The results for the mean values of the degree of fit, |r|, and the Durbin–Watson ratio, d, are shown in Figures 14A–D. First, it is interesting to see, in sharp contrast to the other three translators, the astonishing stability in the motion of Ogawa’s vectors depicted in Figure 14A. This observation aptly indicates that the translation by Ogawa preserves correlations at least over the three paragraphs (2,507 syllabics). For his translation, the calculation has been carried out for texts up to the seventh paragraph. Example results of the long-tailed metrics (fitted to Equation 1a) are Mean: |r| = 0.991 and d = 1.252 for the expansion up to the fifth paragraph (3,616 syllabics), while Mean: |r| = 0.991 and d = 1.097 for that up to the seventh paragraph (4,640 syllabics). Note again that as given in Supplementary Appendix 2, the same metrics for the first paragraph (1,217 syllabics) are Mean: |r| = 0.992 and d = 1.323. Evidently, for Ogawa’s translation, the decaying rate due to the expanding paragraphs can be regarded as far from substantial. It should be noted that over the past 34 years (1989–2023), he has published 55 English-to-Japanese translations. Here, the writers of English texts include not only Poe but also Ernest Hemingway, Nevil Shute, F. Scott Fitzgerald, Stephen King, John Connolly, Jhumpa Lahiri, and O. Henry. In contrast, for the other three translators, the numbers of published translations amount to 40 for Kono (over the past 51 years; 1955–2006), 19 for Tanizaki (over the 57 years; 1913–1970), and 9 for Ooka (over the 35 years; 1986–2021).
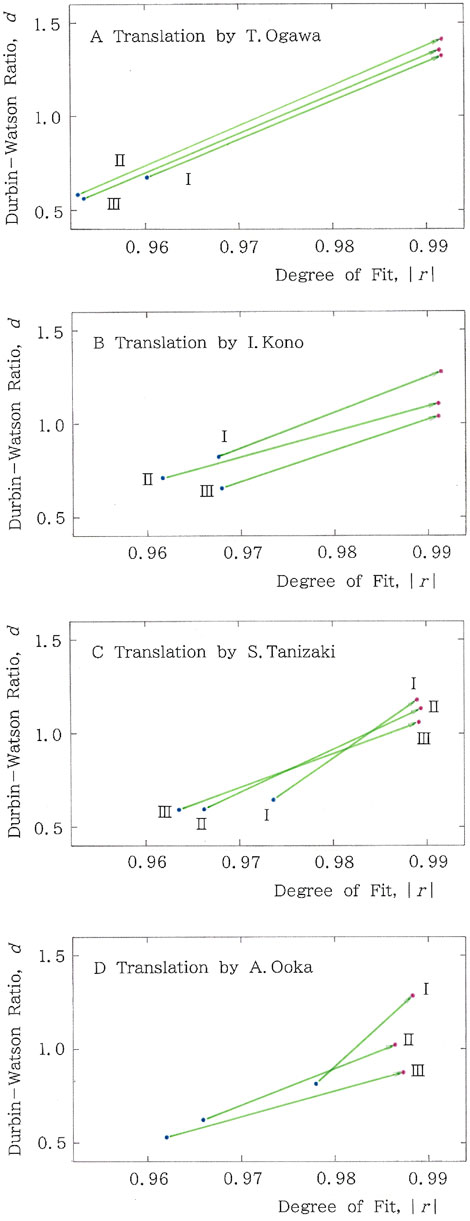
Figure 14. Vectorial scattergrams for trans-paragraph passages from Poe, where the meaning of the two-tone colors is the same as in Figure 13C. The Roman numerals I, II, and III indicate the first single paragraph, the first and second paragraphs, and the first to third paragraphs, respectively. Translations by (A) Takayoshi Ogawa (1,217; 1,741; and 2,507), (B) Ichiro Kono (1,038; 1,513; and 2,281), (C) Seiji Tanizaki (1,195; 1,655; and 2,396), and (D) Akira Ooka (1,087; 1,571; and 2,355) are chosen, where the numerals in parentheses indicate the grand totals of syllabics in the first, the first plus second, and the first to third paragraphs, respectively.
5.2 Original passages from Kenzaburo Oe and their backtranslations
A vectorial scattergram for passages from Shiiku by Kenzaburo Oe [39, 41] is illustrated in Figure 15A. It is interesting to see the mixture of the three types of vectors: Equation 6a for the original Japanese (K. Oe) and the backtranslation by a human translator (HI#2); Equation 6b for the two Google’s machine translations (AI#1 and AI#2); and Equation 6c for two human translators (HI#1 and HI#3). In particular, a comparison between the Japanese original (K. Oe) and the backtranslations by Google’s AI (AI#1 and AI#2) suggests that, for the latest several years, one kind of AI might have possibly become a rival of human intelligence. Finally, to evaluate the ability of the latest AI (AI#2), Figure 15B compares the counts of LT dominance, as defined by Equation 6a. Note that in Equation 6, instead of the means, vector angles are obtained for every point of the sequence n; for instance, for K. Oe, the total counts are 57 for Equation 6a, 6 for Equation 6b, 7 for Equation 6c, and 7 for Equation 6d. It should be stressed that the counts for the updated AI#2 are comparable to those of HI#2 but differ from those of the original Japanese (K. Oe).
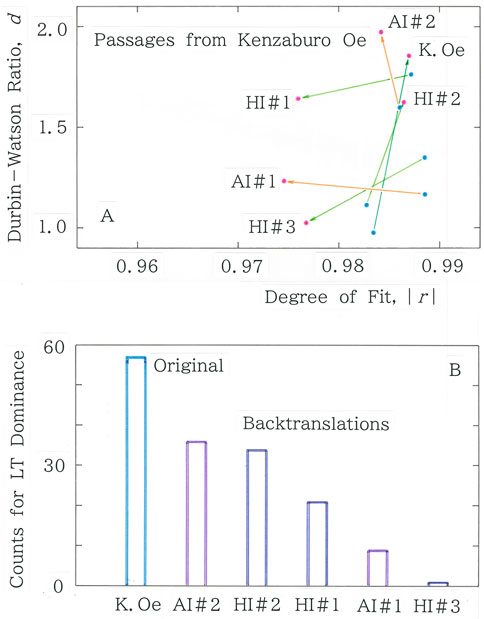
Figure 15. (A) Vectorial scattergram for passages from Shiiku by Kenzaburo Oe [39, 41], where red dots represent the means for the long-tailed fitting (Equation 1a), while blue dots represent those for the short-tailed counterpart (Equation 2). Each vector is directed from the blue dot to the red dot. (B) Comparison among counts for the long-tailed dominance.
5.3 Effects due to additional redundancy: an experiment
It seems certain that one of the main factors for reducing the quality of general writings is the frequent and rash use of a specific word. To examine whether our method could detect the stylistic deterioration due to a disturbance in the long-range correlation of a text, the following experiment was carried out: the quality of every sentence in a paragraph is deteriorated on purpose by putting a trisyllabic conjunctive /so.si.te/, “and,” on its head (Method 1), while that of every phrase is deteriorated by putting the same conjunctive on the head (Method 2). With these perturbations, it is possible to reduce the quality of the paragraph without changing its meaning. First, for passages from Teruhiko Kuze (Figure 3B), the experimental results of the Durbin–Watson ratio, d, at the end of the sequence in the long-tailed fitting (Equation 1a) are d = 1.883 (unperturbed) →0.958 (Method 1) →0.572 (Method 2). (For the degree of fitting, |r|, there has been no significant difference between the three). Comparison between the three numerals reveals a substantial reduction in the ratio with increasing perturbations. Next, for passages from Poe (Figure 5), the numerical results of the two translators are as follows: for the Ogawa’s translation (Figure 5B), d = 1.374 (unperturbed) →0.940 (Method 1) →1.020 (Method 2), while for the Kono’s translation (Figure 5D), d = 1.260 (unperturbed) →0.994 (Method 1) →0.624 (Method 2). Here, a significant reduction in the ratio can be observed, in particular, for Kono’s sequence. Finally, the results for passages from Oe (Figure 8B) are d = 1.687 (unperturbed) →1.181 (Method 1)→0.760 (Method 2).
To conclude, in all the cases above, excessive addition of a specific conjunctive substantially decreases, not to mention the quality of the paragraph, the Durbin–Watson ratio. In other words, artificial disturbance of the long-range correlation through frequent use of a specific conjunction results in the reduction of fit to the long-tailed distribution, Equation 1a. Again, the long-range correlation and the long-tailed distribution are two sides of the same coin.
6 Conclusion
We performed a comparative assessment of the quality of translations of English literary passages into Japanese. First, the translated texts have been expressed with 45 syllabics, and the ranking of their frequencies was analyzed statistically using both the two nonlinear regressions and the Durbin–Watson ratio. Along with examples in the previous paper [15] dealing with a dialectal spread, the validity of our method was further confirmed through comparisons with results of two examples: the popularity ranking of 800 Japanese boy names and passages from a Japanese novel. To visualize the degree of broken symmetry toward the long-tailed distribution, a representation using a two-dimensional vector has been employed. Subsequently, the method was applied to sixteen translations of passages from Edgar Allan Poe and five backtranslations of passages from Kenzaburo Oe. A diachronic analysis of computed results for translations by both humans and AI has shown that, in recent years, capabilities of one kind of AI appear to have been improved. However, we still cannot affirm clearly that it has become a formidable competitor. Finally, this paper has focused on a case study of a quantitative evaluation on the quality of both human and machine translations. Systematic research on this remains.
Data availability statement
The original contributions presented in the study are included in the article/Supplementary Material; further inquiries can be directed to the corresponding author.
Author contributions
KH: conceptualization, data curation, formal analysis, funding acquisition, investigation, methodology, project administration, resources, software, supervision, validation, visualization, writing – original draft, and writing – review and editing.
Funding
The author(s) declare that no financial support was received for the research and/or publication of this article.
Conflict of interest
The author declares that the research was conducted in the absence of any commercial or financial relationships that could be construed as a potential conflict of interest.
The author declared that he was an editorial board member of Frontiers, at the time of submission. This had no impact on the peer review process and the final decision.
Generative AI statement
The author(s) declare that no Generative AI was used in the creation of this manuscript.
Publisher’s note
All claims expressed in this article are solely those of the authors and do not necessarily represent those of their affiliated organizations, or those of the publisher, the editors and the reviewers. Any product that may be evaluated in this article, or claim that may be made by its manufacturer, is not guaranteed or endorsed by the publisher.
Supplementary material
The Supplementary Material for this article can be found online at: https://www.frontiersin.org/articles/10.3389/fphy.2025.1596816/full#supplementary-material
References
2. Burkette A, Kretzschmar WA. Exploring linguistic science: language use, complexity and interaction. Cambridge, UK: Cambridge University Press (2018).
3. Stanisz T, Drożdż S, Kwapień J. Complex systems approach to natural language. Phys Rep (2024) 1053:1–84. doi:10.1016/j.physrep.2023.12.002
4. Mendenhall TC. A mechanical solution of a literary problem. Popular Sci Monthly (1901) 60:96–105.
5. Williams CB. Mendenhall’s studies of word-length distribution in the works of Shakespeare and Bacon. Biometrika (1975) 62:207–12. doi:10.1093/biomet/62.1.207
6. Hayata K. Golden distribution of probabilities. Forma (2014) 29:33–40. doi:10.5047/forma.2014.006
7. Rovenchak A, Buk S. Part-of-speech sequences in literary text: evidence from Ukrainian. J Quantitative Linguistics (2018) 25:1–21. doi:10.1080/09296174.2017.1324601
8. Liu J, Gunn E, Youssef F, Tharayil J, Lansford W, Zeng Y. Fractality in Chinese prose. Digital Scholarship in the Humanities (2023) 38:604–20. doi:10.1093/llc/fqac062
9. Stanisz T, Drożdż S, Kwapień J. Statistics of punctuation in experimental literature: the remarkable case of Finnegans Wake by James Joyce. Chaos (2024) 34:083124. doi:10.1063/5.0203530
10. Dec J, Dolina M, Drożdż S, Stanisz T. Multifractal Hopscotch in Hopscotch by Julio Cortázar. Entropy (2024) 26:716. doi:10.3390/e26080716
11. F Pellegrino, E Marsico, I Chitoran, and C Coupé, editors. Approaches to phonological complexity. Berlin, Germany: Mouton de Gruyter (2009).
12. Hayata K. Frustration in the pattern formation of polysyllabic words. Front Phys (2017) 4:50. doi:10.3389/fphy.2016.00050
13. Hayata K. Phonological rules of present-day Japanese in sign-language dictionaries. J Quantitative Linguistics (2017) 24:367–78. doi:10.1080/09296174.2017.1314907
14. Hayata K. Phonological complexity in the Japanese short poetry: coexistence between nearest-neighbor correlations and far-reaching anticorrelations. Front Phys (2018) 6:31. doi:10.3389/fphy.2018.00031
15. Hayata K. Dialectal tsunamis emerging from the Simmel effect: a statistical approach to the snail-paced spread of cultural epidemic. Front Phys (2024) 12:1425907. doi:10.3389/fphy.2024.1425907
16. Kanter I, Kessler DA. Markov processes: linguistics and Zipf’s law. Phys Rev Lett (1995) 74:4559–62. doi:10.1103/physrevlett.74.4559
17. Mantegna RN, Buldyrev SV, Goldberger AI, Havlin S, Peng CK, Simons M, et al. Systematic analysis of coding and noncoding DNA sequences using methods of statistical linguistics. Phys Rev E (1995) 52:2939–50. doi:10.1103/physreve.52.2939
19. Nishizawa N, Makino K. Ranking of Japanese given names. Tokyo, Japan: Shinjimbutsuoraisha (2001).
20. Schenkel A, Zhang J, Zhang Y-C. Long range correlation in human writings. Fractals (1993) 1:47–57. doi:10.1142/s0218348x93000083
21. Amit M, Shmerler Y, Eiseenberg E, Abraham M, Shnerb N. Language and codification dependence of long-range correlations in texts. Fractals (1994) 2:7–13.
22. Diks C, van Houwelingen JC, Takens F, DeGoede J. Reversibility as a criterion for discriminating time series. Phys Lett A (1995) 201:221–8. doi:10.1016/0375-9601(95)00239-y
24. Poe EA. The fall of the house of Usher and other writings. New York, NY, USA: Penguin Books (1986). (originally published in 1839).
40. Crystal D. The Cambridge encyclopedia of language. Cambridge, UK: Cambridge University Press (1987).
Keywords: statistical linguistics, mathematical stylistics, long-tailed syllabic distribution, Durbin–Watson ratio, backtranslation experiment, artificial intelligence
Citation: Hayata K (2025) Combination of the ranking method and time reversal asymmetry for evaluating the quality of translations: a case study on passages from works by Edgar Allan Poe and Kenzaburo Oe. Front. Phys. 13:1596816. doi: 10.3389/fphy.2025.1596816
Received: 20 March 2025; Accepted: 24 June 2025;
Published: 21 August 2025.
Edited by:
Alessandro Vezzani, National Research Council (CNR), ItalyCopyright © 2025 Hayata. This is an open-access article distributed under the terms of the Creative Commons Attribution License (CC BY). The use, distribution or reproduction in other forums is permitted, provided the original author(s) and the copyright owner(s) are credited and that the original publication in this journal is cited, in accordance with accepted academic practice. No use, distribution or reproduction is permitted which does not comply with these terms.
*Correspondence: Kazuya Hayata, aGF5YXRhQHNndS5hYy5qcA==