- 1National Key Laboratory of Metrology and Calibration, Beijing Institute of Radio Metrology and Measurement, Beijing, China
- 2College of Electronic Science and Technology, National University of Defense Technology, Changsha, China
- 3National Key Laboratory for Positioning, Navigation and Timing Technology, Changsha, China
The optical frequency transitions with long-lifetime spin triplet states produced by the two valence electrons in the outermost layer of alkaline earth atoms make calcium atom a promising quantum frequency reference. Electron-shelving detection improves the signal-to-noise ratio of the clock transition spectrum, enabling a calcium atomic beam optical frequency standard. This scheme employs the 1S0-1P1 transition at 423 nm to detect the 1S0-3P1 transition at 657 nm, emphasizing the importance of 423 nm laser stability. While the performance of these clocks is well-studied, research on the atomic beam itself is limited. This study investigates frequency shifts in neutral calcium atoms’ 1S0-1P1 transition at 423 nm and their 1S0-3P1 transition at 657 nm. We measure the frequency shift caused by temperature, laser power, and laser alignment, providing insights to optimize the design of the calcium beam’s physical apparatus.
1 Introduction
Optical frequency standards are essential in various fields, including fundamental scientific research and technical innovations [1–3]. At present, significant research efforts have been dedicated to the development of optical clocks, encompassing both ion-based optical clocks and lattice optical clocks [4–9]. The majority of existing optical frequency standards rely on cold atoms or ions, which necessitate large volumes and fragile and complex systems with limited up-time [10–12]. These configurations are suitable for frequency primary standards. Atomic beam optical clocks offer the benefits of a high signal-to-noise ratio and miniaturization, making them advantageous for both laboratory-based and field-deployed timekeeping. Their applicability extends across positioning, navigation, and timing applications in civilian, commercial, and defense sectors [13–15]. Numerous research groups have developed several optical clocks based on atomic beams, utilizing strontium beams [16, 17], ytterbium beams [18], and calcium beams [19]. The relatively narrow natural linewidth of 375 Hz in calcium and commercial lasers make calcium an optimal atomic choice for achieving miniaturized thermal atomic beam frequency standard. In 1999, the Physikalisch-Technische Bundesanstalt (PTB) pioneered the first calcium atomic beam optical clock [20]. Peking University has done seminal work for the calcium beam frequency standard, which first proposed the electron-shelving detection scheme [21] and the velocity grating method [22]. In 2019, researchers at National Institute of Standards and Technology (NIST) demonstrated a stability of less than 6 × 10⁻¹⁶ at 1 s, which decreased to less than 2 × 10⁻¹⁶ at 1,000 s by utilizing the Ramsey spectrum on calcium beams [23]. Their stability results exceed the performance of other thermal atomic or molecular systems by 1–2 orders of magnitude. The United States Naval Observatory (USNO) advanced this achievement by employing the spectroscopy laser modulation in a laser-cooled calcium beam, which increased the Ramsey fringe amplitude by a factor of 14 and improved the Allan deviation to 3.4 × 10⁻¹⁵ at 1 s [24].
While the majority of research groups focus on the performance of clocks, relatively little attention has been given to the study of atomic beams themselves. A research team at USNO has analyzed variations in clock frequency to assess the limits on the long-term frequency stability of a calcium atomic beam optical clock [25]. Meanwhile, another group has evaluated various perturbative effects in a strontium clock, including first- and second-order Doppler and Zeeman effects, AC Stark shift, collisional shifts, and the mechanical effects of light [26]. However, no studies to date have reported results on the frequency shifts of both the clock laser and the probe laser. The study investigates the frequency shift properties of the 1S0-3P1 657 nm clock transition and the 1S0-1P1 423 nm transition, which facilitates the detection mechanism of the narrow clock transition [21]. It quantifies the frequency variations induced by temperature fluctuations, laser power, and laser alignment. These findings guide the development of high-performance physical apparatuses for atomic beam optical clocks using the electron-shelving detection scheme and offer a framework for parameter optimization.
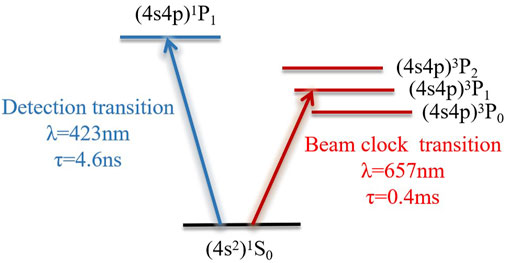
Figure 1 presents the atomic energy levels of calcium. The 423 nm transition from the ground state 4s4s1S0 to the excited state 4s4p1P1 serves as a spectroscopic detection tool, exhibiting a short energy level lifetime of approximately 4.6 ns as a cycling transition. Meanwhile, the 657 nm transition from the ground state 4s4s1S0 to the excited state 4s4p3P1 serves as the clock transition [27], featuring a 375 Hz linewidth and a 0.4 ms lifetime. Direct detection of the 657 nm clock transition yields a low signal-to-noise ratio. To enhance detection, we use electron-shelving detection, leveraging the rapid 1S0-1P1 423 nm transition to observe the narrow 1S0-3P1 657 nm clock transition [21]. The stabilization of 423 nm laser can also reflect the properties of atomic beams. Thus, we study the frequency shift of both the 423 nm transition and the 657 nm transition.
The remainder of the paper is structured as follows. Section 2 provides an overview of the experimental setup. Section 3 presents the results and the analysis of theoretical predictions. Finally, Section 4 concludes the study.
2 Experimental setup
2.1 Frequency shift of 1S0-1P1 transition at 423 nm
Two identical atomic beam vacuum systems are employed to minimize the impact of physical systems on the experiment. An ion pump with a 20 L/s pumping speed maintains long-term vacuum stability at 6E-8 Pa. As the atomic beam emitted from the oven exhibits divergence, a collimation aperture is positioned before the laser interaction zone to reduce its divergence angle, with a distance of d = 100 mm from the nozzle of the oven. The size of the crucible nozzle is r = 3 mm. A 10 mm-long capillary array with a 0.2 mm inner and 0.4 mm outer diameter further collimates the atomic beam. The divergence angle of the atomic beam is 30 mrad because of the angular selection given by the presence of the aperture. Quantum projection noise limits the signal-to-noise ratio of atomic transitions, requiring sufficient atomic beam intensity for laser interaction. Calcium, with a melting point of 1,113.15 K, is heated to 873.15 K in a vacuum, facilitating its rapid, directional ejection and spraying out of the crucible nozzle in the form of atomic vapor.
The 423 nm laser must be incident perpendicular to the atomic beam to target atoms with zero transverse velocity. A photomultiplier tube (PMT) detects the fluorescence signal produced by the interaction between the 423 nm laser and atoms. The 423 nm atomic absorption spectroscopy is recorded, and an error signal is generated using a lock-in amplifier. This study examines the frequency shift properties of the 1S0-1P1 transition in neutral calcium at 423 nm. The frequency shift is measured by heterodyning two independently locked 423 nm lasers, which are locked to the atomic resonance. An acousto-optic modulator (AOM) induces a 144 MHz frequency shift after one of the 423 nm lasers. We measure the frequency’s dependence on temperature, laser power, and laser alignment. The experimental setup is depicted in Figure 2.
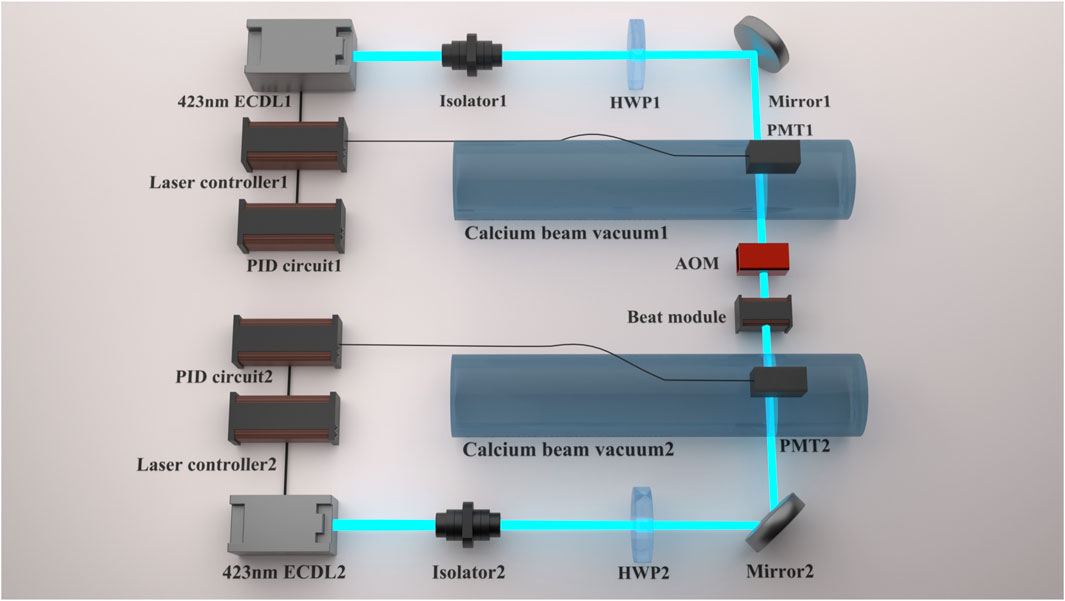
Figure 2. Configuration of frequency shift measuring by heterodyning the two 423 nm lasers. HWP: half-wave plate.
2.2 Frequency shift of 1S0-3P1 transition at 657 nm
In this experiment, we employ a saturated absorption spectroscopy scheme to detect the clock signal. The calcium atomic beam frequency standard utilizes three locking loops, including stabilizing the 423 nm detection laser to atomic resonance, locking the 657 nm clock laser to a Fabry-Perot cavity, and locking of the 657 nm clock laser to atomic resonance by adjusting the AOM1 frequency. The 423 nm transition enables electron-shelving detection. After achieving stable locking of both lasers, the 423 nm laser serves as the shelved readout for population measurement and 657 nm clock signal detection. Figure 3 illustrates the schematic of the calcium atomic beam optical frequency standard.
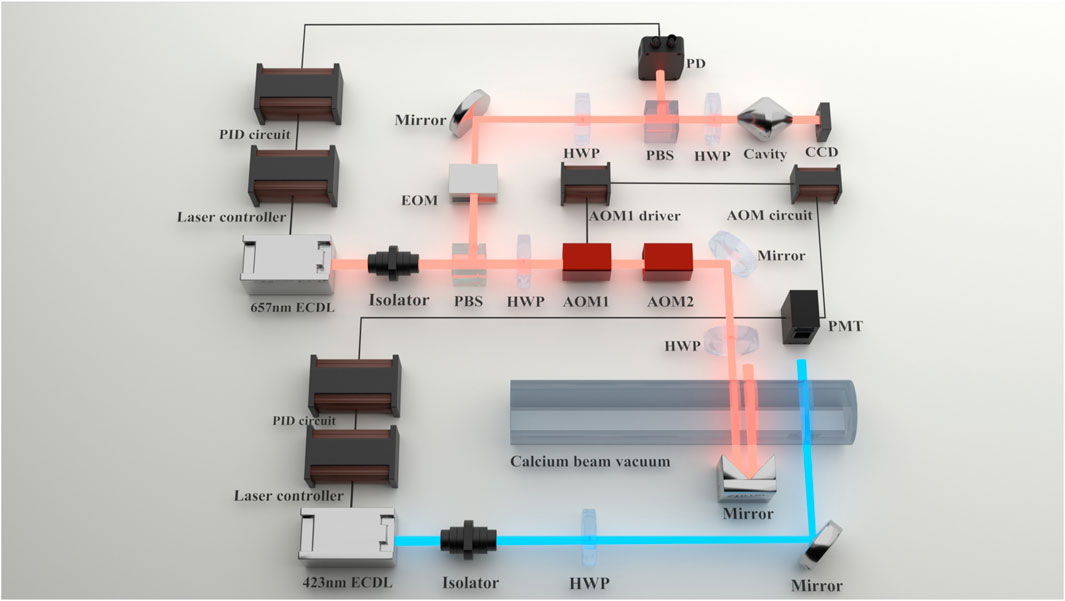
Figure 3. Optical frequency standard based on a calcium atomic beam, including a clock laser (red) and a probe laser (blue). EOM: electro-optic modulator; PBS: polarizing beam splitter; CCD: charge-coupled device; PD: photodiode.
The 657 nm external cavity semiconductor laser serves as the clock transition laser. Its frequency is stabilized using the Pound-Drever-Hall (PDH) technique, locking it to an ultra-stable resonant cavity. After frequency stabilization by PDH locking, the linewidth of the 657 nm laser is heterodyned with another set of 657 nm laser using PDH technique. The fitted Lorentz linewidth is 32.16 Hz, and one set of the 657 nm laser linewidth is less than 32.16 Hz. To bridge the frequency difference between the ultra-cavity stabilized 657 nm laser and the calcium atomic resonance frequency, AOM1 and AOM2 apply four frequency shifts to align the laser frequency with the atomic transition. AOM1 operates at 101.894 MHz and AOM2 at 198.26 MHz, resulting in a total frequency shift of about 600 MHz via a double pass configuration. The 657 nm clock laser is then stabilized to the atomic resonance through feedback control of an AOM frequency, ensuring the output of the optical frequency standard.
After stabilizing the calcium atomic beam frequency standard, we analyze the frequency shifts induced by temperature, laser power, and laser alignment. The stabilized clock laser output after AOM1 is heterodyned with an optical frequency comb locked to a hydrogen maser, enabling measurement of the 657 nm laser’s frequency shift. The frequency stability of the hydrogen maser is 6.0 × 10⁻¹⁴ at 1 s and 1.1 × 10⁻¹⁵ at 1,000 s. The schematic of frequency shift measuring experimental setup is shown in Figure 4.
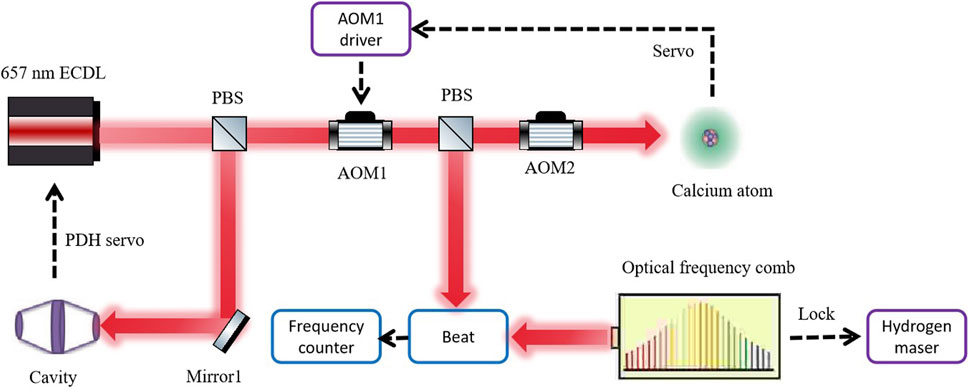
Figure 4. Configuration of frequency shift measuring by heterodyning clock laser with an optical frequency comb.
3 Results
3.1 Frequency shift of 1S0-1P1 transition at 423 nm
3.1.1 Frequency shift of 1S0-1P1 transition at 423 nm caused by oven temperature
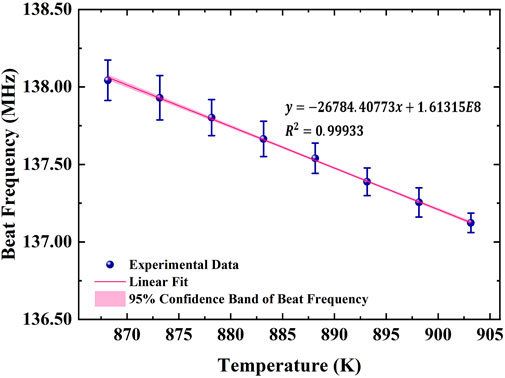
The temperature of one oven is set to 873.15 K, while the temperature of the second oven is adjusted within the range of 868.15 K–903.15 K. Figure 5 illustrates the frequency shift of the 423 nm transition in calcium as a function of oven temperature, with a fitted coefficient of 26.78 kHz/K between the frequency shift and temperature. For 423 nm laser long-term stability at the E−13 level, the frequency shift must remain below 70.9 Hz, which requires that oven temperature fluctuations be limited to 2.65 × 10⁻³ K.
3.1.2 Frequency shift of 1S0-1P1 transition at 423 nm caused by laser power
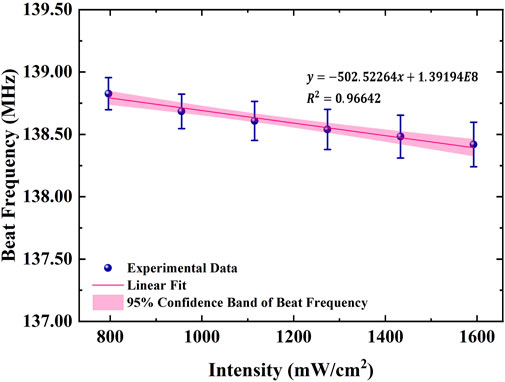
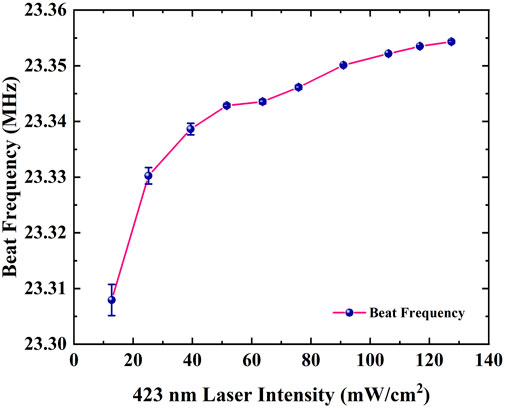
We maintain the temperature of two ovens at 873.15 K and adjust the laser power using a HWP before a polarization beam splitter. One 423 nm laser’s power varies from 25 to 50 mW, while the other 423 nm laser power is fixed at 17 mW. Figure 6 illustrates the frequency shift of the 423 nm transition as a function of laser intensity, with a fitted coefficient of 502.52 Hz/(mW/cm2) between frequency shift and laser intensity. For 423 nm laser long-term stability at the E−13 level, the laser power fluctuations should be limited to 4.43 μW.
3.1.3 Frequency shift of 1S0-1P1 transition at 423 nm caused by laser alignment
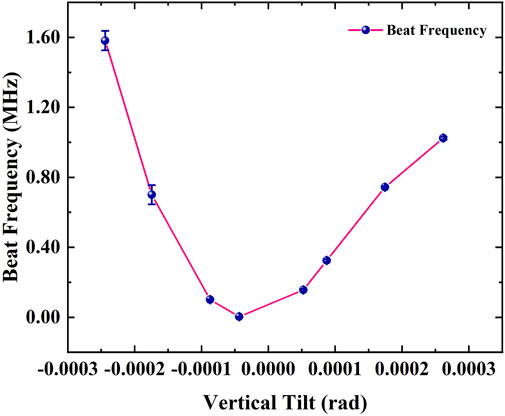
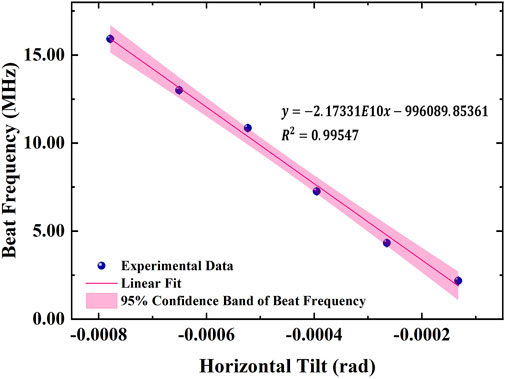
We set the two ovens to 873.15 K and examined the frequency dependence on the two orthogonal adjustments of the mirror mount by varying the actuator on the last mirror. Figures 7, 8 illustrate the resulting frequency shift of the 423 nm transition as a function of vertical position and horizontal position, respectively. The fitted coefficient between frequency shift and laser alignment is 2.17 × 10⁴ Hz/μrad. By aligning the laser vertically at the atomic beam’s radial center—as can be seen by the inflection point in Figure 7—the frequency shift can be minimized due to the beam’s symmetry. For 423 nm laser long-term stability at the E-13 level, the laser alignment fluctuations should be limited to 3.27 nrad.
3.2 Frequency shift of 1S0-3P1 transition at 657 nm
3.2.1 Frequency shift of 1S0-3P1 transition at 657 nm caused by oven temperature
After stabilizing the calcium atomic beam frequency standard, we measure the stable output clock laser using an optical frequency comb referenced to a hydrogen maser. The stability of clock laser is 2.43 × 10⁻¹³ at 1 s and 5.31 × 10⁻¹⁴ at 200 s as shown in Figure 9A. We also demonstrate the fluctuations of beat frequency in Figure 9B. The frequency stability of the clock laser at 1 s is limited to the noise of an optical frequency comb locked to a hydrogen maser and the noise in the beat frequency link. The stabilized clock laser output after AOM1 is also heterodyned with an optical cavity stabilized laser and the stability of clock laser is
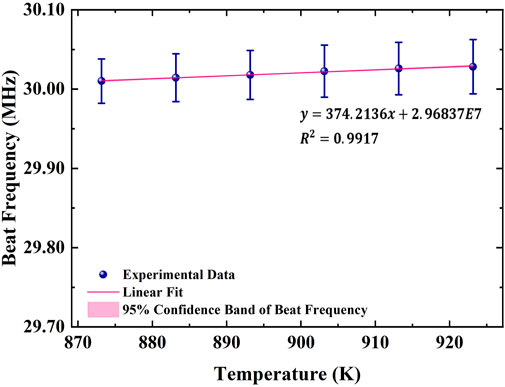
The oven temperature is varied from 893.15 K to 923.15 K, and the resulting frequency shift of the 657 nm transition as a function of oven temperature is depicted in Figure 10. The frequency shift-temperature fitted coefficient is 374.21 Hz/K. We calculate the temperature changes of the oven temperature by measuring the voltage fluctuations of the thermocouple. The fluctuation of oven temperature per second does not exceed 0.04 K, therefore the frequency shift is within 3.74 Hz. This drift would correspond to a fractional frequency change of 3.28 × 10⁻¹⁴, which was below the calcium system performance at the time. For clock long-term stability at the E-17 level, the frequency shift must remain below 5 mHz, requiring oven temperature fluctuations to be limited to 1.34 × 10⁻⁵ K.
The second-order Doppler frequency shift, primarily driven by atom velocity, is the dominant source of temperature-induced frequency shift [28]. Because atom velocity is determined by oven temperature, higher temperatures increase the atomic beam speed, altering the relative velocity felt during the interaction between atoms and laser [29], which in turn shifts atomic resonance frequencies. Meanwhile, an increase in temperature can cause the opto-mechanics to expand slightly, inducing a residual first-order Doppler shift.
3.2.2 Frequency shift of 1S0-3P1 transition at 657 nm caused by laser power
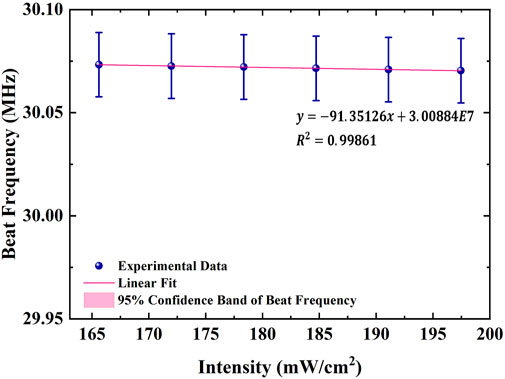
We set the oven temperature at 923.15 K. Laser power is adjusted via a HWP positioned before a polarization beam splitter, varying the 657 nm laser power between 5.2 and 6.0 mW. Figure 11 illustrates the frequency shift of the 657 nm transition as a function of laser intensity, with a fitted coefficient between frequency shift and laser intensity of 91.35 Hz/(mW/cm2). We record the fluctuations of laser power which do not exceed 5.15 × 10⁻⁵ mW per second, corresponding to the frequency shift within 0.05 Hz. This drift would correspond to a fractional frequency change of 1.1 × 10⁻¹⁶, which was well below the calcium system performance at the time. To maintain the clock long-term stability at the E−17 level, the laser power fluctuations should be limited to 1.72 nW. The frequency shift variation with laser power results from the ac Stark shift, where a near-resonant pump laser alters atomic energy levels based on its frequency and intensity.
3.2.3 Frequency shift of 1S0-3P1 transition at 657 nm caused by laser alignment
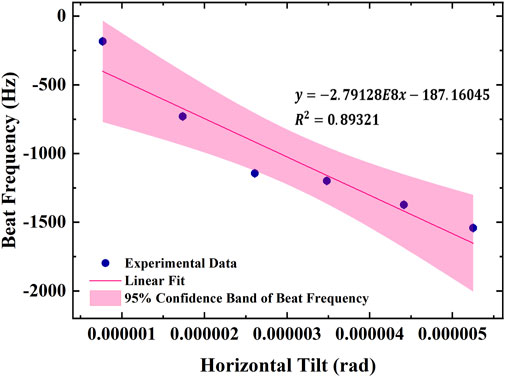
We set the temperature of the two ovens at 923.15 K and investigated the influence of laser alignment on clock frequency by adjusting the actuator on the final mirror of the saturated absorption spectroscopy. Frequency dependence is assessed along the two orthogonal axes of the mirror mount. Figure 12 illustrates the frequency shift of the 657 nm transition as a function of laser alignment. The fitted correlation coefficient between frequency shift and laser alignment is 279 Hz/μrad. Maintaining clock long-term stability at the E-17 level requires limiting the frequency shift to below 5 mHz, necessitating laser alignment fluctuations within 1.03 nrad.
The key Doppler-related effect in our thermal atomic beam ensemble is the first- and second-order Doppler shift. The first-order Doppler shift can be mitigated using saturated absorption spectroscopy. In our experiment, the clock frequency variations with laser alignment indicate instabilities due to residual first-order Doppler shifts [30]. We find that laser alignment stability is critically required in the horizontal direction, aligned with atomic motion, while the frequency shift remains relatively small at the vertical inflection point. The first-order Doppler frequency shift can be expressed as Equation 1.
where
where
For the residual first-order Doppler shift, we assume that the mean velocity of the atomic beam is
For the calcium atom transition at 657 nm,
The longitudinal speed of the calcium atomic beam is given by [31] as Equation 6
where
Considering the fitting coefficient we measured is 279 Hz/μRad, the maximum actual frequency shift is 1.46 × 10³ Hz. Thus, theoretical analysis can predict our measured values appropriately.
3.2.4 Frequency shift of 657 nm clock laser relative to 423 nm probe laser
We also measure the power and frequency shifts of the 423 nm probe laser on the clock transition frequency. We first record the frequency shift of 657 nm laser relative to 423 nm laser power. We set the oven temperature at 903.15 K. Laser power is adjusted via a HWP positioned before a polarization beam splitter, varying the 423 nm laser power between 1.2 and 12 mW. Figure 14 illustrates the frequency shift of the 657 nm clock laser as a function of 423 nm laser intensity. The saturation intensity of laser can be expressed as Equation 8
where
Then we study the frequency shift of 657 nm laser relative to 423 nm laser frequency. We set the oven temperature at 903.15 K. Figure 15 illustrates the frequency shift of the 657 nm clock laser as a function of the frequency of 423 nm probe laser, with a fitted coefficient of 0.00106. As the 423 nm laser drifts 2 Hz per second, the clock laser drifts 2.12 mHz per second. These drifts would correspond to a fractional frequency change of 4.65 × 10⁻¹⁸, which was well below the calcium system performance at the time.
4 Conclusion
Our study systematically analyzes the frequency shift properties induced by temperature, laser power, and laser alignment, focusing on both the 1S0-3P1 657 nm clock transition and the 1S0-1P1 423 nm transition used for electron-shelving detection. We determine the fitted coefficients correlating frequency shift with oven temperature, laser power, and laser alignment. These frequency shifts enable precise control of key parameters to achieve the desired frequency stability. This work serves as a reference for optimizing our high-performance physical system for a calcium atomic beam optical clock, with the calcium beam optical clock offering significant advancements in the fielded optical atomic timekeeping.
Data availability statement
The original contributions presented in the study are included in the article/supplementary material, further inquiries can be directed to the corresponding authors.
Author contributions
YC: Conceptualization, Writing – review and editing, Formal Analysis, Software, Investigation, Methodology, Data curation, Writing – original draft. YS: Writing – review and editing, Supervision, Conceptualization. JM: Methodology, Writing – review and editing. JP: Writing – review and editing. MM: Writing – review and editing. XX: Writing – review and editing. SZ: Writing – review and editing.
Funding
The author(s) declare that no financial support was received for the research and/or publication of this article.
Conflict of interest
The authors declare that the research was conducted in the absence of any commercial or financial relationships that could be construed as a potential conflict of interest.
Generative AI statement
The author(s) declare that no Gen AI was used in the creation of this manuscript.
Publisher’s note
All claims expressed in this article are solely those of the authors and do not necessarily represent those of their affiliated organizations, or those of the publisher, the editors and the reviewers. Any product that may be evaluated in this article, or claim that may be made by its manufacturer, is not guaranteed or endorsed by the publisher.
References
1. Lange R, Huntemann N, Rahm JM, Sanner C, Shao H, Lipphardt B, et al. Improved limits for violations of local position invariance from atomic clock comparisons. Phys Rev Lett (2021) 126.1: 011102. doi:10.1103/PhysRevLett.126.011102
2. Schioppo M, Brown RC, McGrew WF, Hinkley N, Fasano RJ, Beloy K, et al. Ultrastable optical clock with two cold-atom ensembles. Nat Photon (2017) 11(1):48–52. doi:10.1038/nphoton.2016.231
3. Takano T, Takamoto M, Ushijima I, Ohmae N, Akatsuka T, Yamaguchi A, et al. Geopotential measurements with synchronously linked optical lattice clocks. Nat Photon (2016) 10(10):662–6. doi:10.1038/nphoton.2016.159
4. Huntemann N, Sanner C, Lipphardt B, Tamm C, Peik E. Single-ion atomic clock with 3×10⁻¹⁸ systematic uncertainty. Phys Rev Lett (2016) 116(6):063001. doi:10.1103/physrevlett.116.063001
5. Schmidt PO, Rosenband T, Langer C, Itano WM, Bergquist JC, Wineland DJ. Spectroscopy using quantum logic. Science (2005) 309.5735:749–52. doi:10.1126/science.1114375
6. Aeppli A, Kim K, Warfield W, Safronova MS, Ye J. Clock with 8×10-19 systematic uncertainty. Phys Rev Lett (2024) 133.2:023401. doi:10.1103/PhysRevLett.133.023401
7. Zhang C, Ooi T, Higgins JS, Doyle JF, Wense L, Beeks K, et al. Frequency ratio of the 229mTh nuclear isomeric transition and the 87Sr atomic clock. Nature (2024) 633:63–70. doi:10.1038/s41586-024-07839-6
8. Peik E, Tamm C. Nuclear laser spectroscopy of the 3.5 eV transition in Th-229. Europhysics Lett (2003) 61(2):181–6. doi:10.1209/epl/i2003-00210-x
9. Tkalya EV, Varlamov VO, Lomonosov VV, Nikulin SA. Processes of the nuclear isomer 229mTh (3/2+, 3.5±1.0 eV) resonant excitation by optical photons. Physica Scripta (1996) 53(3):296–9. doi:10.1088/0031-8949/53/3/003
10. Sanner C, Huntemann N, Lange R, Tamm C, Peik E, Safronova MS, et al. Optical clock comparison for Lorentz symmetry testing. Nature (2019) 567(7747):204–8. doi:10.1038/s41586-019-0972-2
11. Cui K, Chao S, Sun C, Wang S, Zhang P, Wei Y, et al. Evaluation of the systematic shifts of a 40Ca+–27Al+ optical clock. Eur Phys J (2022) 76(8):140. doi:10.1140/epjd/s10053-022-00451-1
12. Guo F, Tan W, Zhou C, Xia J, Chen Y, Liang T A proof-of-concept model of compact and high-performance 87Sr optical lattice clock for space. AIP Adv (2021) 11(12):125116. doi:10.1063/5.0064087
13. Morinaga A, Riehle F, Ishikawa J, Helmcke J. A Ca optical frequency standard: frequency stabilization by means of nonlinear Ramsey resonances. Appl Phys B (1989) 48:165–71. doi:10.1007/BF00692142
14. Olson J, Fox R, Brown R, Fortier T, Sheerin T, Oates CW, et al. High-stability laser using ramsey-bordé interferometry. In: 2017 joint conference of the European frequency and time forum and IEEE international frequency control symposium (EFTF/IFCS). Besancon, France (2017). p. 32–3. doi:10.1109/FCS.2017.8088793
15. Hemingway B, Taylor J, Swanson TB, Peil S. Preliminary investigation of a calcium thermal beam in order to build an operational optical clock. In: 2018 IEEE international frequency control symposium (IFCS). Olympic Valley, CA, USA (2018). p. 1–3. doi:10.1109/FCS.2018.8597569
16. Manai I, Molineri A, Fréjaville C, Duval C, Bataille P, Journet R, et al. Shelving spectroscopy of the strontium intercombination line. J Phys B: Mol Opt Phys (2020) 53:085005. doi:10.1088/1361-6455/ab707f
17. Fartmann O, Jutisz M, Mahdian A, Schkolnik V, Tietje IC, Zimmermann C, et al. Ramsey-Bordé atom interferometry with a thermal strontium beam for a compact optical clock. EPJ Quan Technol (2025) 12:31. doi:10.1140/epjqt/s40507-025-00332-7
18. Offer RF, Hilton AP, Bourbeau-Hébert N, Klantsataya E, Luiten AN. A laser-cooled optical beam clock for portable applications. In: 2023 Joint conference of the IEEE International Frequency Control Symposium, European Frequency and Time Forum and Asia-Pacific Workshop on Time and Frequency, Toyama, Japan (2023).
19. Shang H, Zhang X, Zhang S, Pan D, Chen H, Chen J. Miniaturized Calcium beam optical frequency standard using fully-sealed vacuum tube with 10-15 instability. Opt Express (2017) 25:30459–67. doi:10.1364/OE.25.030459
20. Kersten P, Mensing M, Sterr U, Riehle F. A transportable optical calcium frequency standard: dedicated to J. Helmcke on the occasion of his 60th birthday. Appl Phys B (1999) 68:27–38. doi:10.1007/s003400050582
21. Huang K, Zhang J, Yu D, Chen Z, Zhuan W, Chen J. Application of electron-shelving detection via 423 nm transition in Calcium-beam optical frequency standard. Chin Phys Lett (2006) 23(12):3198–201. doi:10.1088/0256-307X/23/12/021
22. Shang H, Pan D, Zhang X, Xue X, Shi T, Chen J. Ultrastable laser referenced on velocity-grating atom interferometry. Phys Rev A (2022) 105:L051101. doi:10.1103/PhysRevA.105.L051101
23. Olson J, Fox RW, Fortier TM, Sheerin TF, Brown RC, Leopardi H, et al. Ramsey-Bordé matter-wave interferometry for laser frequency stabilization at 10-16 frequency instability and below. Phys Rev Lett (2019) 123:073202. doi:10.1103/PhysRevLett.123.073202
24. Tobias WG, Hemingway B, Peil S. Cold beam optical clock with multifrequency spectroscopy. Phys Rev Lett (2024) 134:043401. doi:10.1103/PhysRevLett.134.043401
25. Hemingway B, Akin TG, Taylor J, Peil S. Stability budget for thermal calcium-beam optical clock. In: 2020 joint conference of the IEEE international frequency control symposium and international symposium on applications of ferroelectrics (IFCS-isaf). USA: Keystone, CO (2020). p. 1–4. doi:10.1109/IFCS-ISAF41089.2020.9234909
26. Ferrari G, Cancio P, Drullinger R, Giusfredi G, Poil N, Prevedelli M, et al. Precision frequency measurement of visible intercombination lines of strontium. Phys Rev Lett (2003) 91(24):243002. doi:10.1103/PhysRevLett.91.243002
27. Degenhardt C, Stoehr H, Lisdat C, Wilpers G, Schnatz H, Lipphardt B, et al. Calcium optical frequency standard with ultracold atoms: approaching 10-15 relative uncertainty. Phys Rev A (2005) 72:062111. doi:10.1103/PhysRevA.72.062111
28. Barger RL. Influence of second-order Doppler effect on optical Ramsey fringe profiles. Opt Lett (1981) 6(3):145–7. doi:10.1364/ol.6.000145
29. Boulanger JS. A new method for the determination of velocity distributions in cesium beam clocks. Metrologia (1986) 23(1):37–44. doi:10.1088/0026-1394/23/1/005
30. Strathearn A, Offer RF, Hilton AP, Klantsataya E, Luiten AN, Anderson RP, et al. Wave-front curvature in optical atomic beam clocks. Phys Rev A (2023) 108(1):013105. doi:10.1103/PhysRevA.108.013105
Keywords: optical clock, frequency standard, frequency shift properties, electron-shelving detection, fielded optical timekeeping
Citation: Chen Y, Su Y, Ma J, Peng J, Ma M, Xue X and Zhang S (2025) Frequency shift properties of a calcium beam optical clock. Front. Phys. 13:1597737. doi: 10.3389/fphy.2025.1597737
Received: 25 March 2025; Accepted: 05 May 2025;
Published: 16 May 2025.
Edited by:
Qing Ai, Beijing Normal University, ChinaCopyright © 2025 Chen, Su, Ma, Peng, Ma, Xue and Zhang. This is an open-access article distributed under the terms of the Creative Commons Attribution License (CC BY). The use, distribution or reproduction in other forums is permitted, provided the original author(s) and the copyright owner(s) are credited and that the original publication in this journal is cited, in accordance with accepted academic practice. No use, distribution or reproduction is permitted which does not comply with these terms.
*Correspondence: Xiaobo Xue, eGJ4dWUyMDNAMTYzLmNvbQ==; Shengkang Zhang, emhhbmdza0AxMjYuY29t
 Yu Chen
 Yabei Su1
 Xiaobo Xue
 Shengkang Zhang