 Likun Lei
 Yu Wang1
- 1School of Application and Economics, Guizhou University of Finance and Economics, Guiyang, China
- 2School of Economics and Management, Guizhou Normal University, Guiyang, Guizhou, China
With the global energy market becoming increasingly tight and the rapid development of Chinese oil industry, the transmission of information and mutual influence among sectors have become increasingly prominent. In light of this, this paper focuses on the three major sectors within Chinese oil industry chain from 2014 to 2024: oil extraction, oil processing, and oil trading. By employing the TVP-VAR-DY and BK models, we analyze the return spillover effects and dynamic correlations among the upstream, midstream, and downstream sectors of the oil industry chain. The results indicate that there are significant return spillover effects among these three sectors, with their price fluctuations not existing independently but rather influencing and being influenced by each other. Specifically, the oil trading sector predominantly acts as a spillover recipient, while the oil processing sector consistently serves as a net spillover transmitter across the three markets. Furthermore, as the frequency of spillovers increases, the spillover index among the three markets gradually decreases. Notably, when confronted with extreme event shocks, the overall total spillover level of the oil industry system significantly amplifies.
1 Introduction
Oil, hailed as the “lifeblood of modern industry,” is a vital lifeline for a country’s economic development and industrial production, with its market dynamics and the interactions among various segments of the industrial chain increasingly becoming the focus of attention in academia and industry (see, e.g., [1–6]). Within this chain, industries such as oil extraction, processing, and trade are intricately interconnected and mutually influential. Oil extraction, as the upstream segment, directly impacts the production costs and market supply of downstream oil processing enterprises through its output and costs. Oil processing, in turn, produces a variety of petrochemical products by refining crude oil to meet market demands. Meanwhile, oil trade, bridging domestic and international markets, is an indispensable link in the oil industry chain.
With the changes in the global economic situation and the adjustment of energy structure, the spillover effects within the oil industry chain have become increasingly pronounced. Since the outbreak of the 2008 financial crisis, the crude oil market has been in a persistent state of vulnerability (see, e.g., [7]). Notably, in recent years, the convergence of major unexpected events like the 2019 pandemic and the Russia-Ukraine conflict has significantly reduced global oil demand, undoubtedly exacerbating the instability and unpredictability of crude oil market prices (see, e.g., [8]). In this context, the spillover effects and dynamic correlations between various industries within the oil industry chain are more significant. On the one hand, price fluctuations in domestic and international oil markets exert direct or indirect impacts on all segments of the oil industry chain. On the other hand, internal price fluctuations within the oil industry chain can also be transmitted to other financial markets through trade, investment, and other channels, triggering broader market volatility. This spillover effect not only escalates risks within the oil industry chain but also poses greater challenges to related enterprises and investors. Therefore, analyzing the spillover effects within Chinese oil industry chain not only uncovers the interactive mechanisms of price fluctuations among various sectors within the industry chain but also provides policymakers with a scientific basis for risk management and market regulation. Furthermore, it aids investors in optimizing their investment portfolios, reducing market risks in the face of extreme events, and fostering the stable development of the oil industry chain.
The aims of this study are to comprehensively analyzes the price spillover effects and their time-varying characteristics among the oil extraction, processing, and trade sectors within Chinese oil industry chain. To achieve these aims, the paper primarily addresses the following two questions: Firstly, how to accurately depict and quantify the return spillover relationships and net spillover effects among these three sectors? Secondly, how to uncover the transmission mechanisms and dynamic changes of these spillover effects across different frequency domains (short-term, medium-term, and long-term)? To address these questions, this study employs stock index data from the oil extraction, oil processing, and oil trade sectors within the Shenwan Tertiary Industry Index. By employing a combined method of the TVP-VAR-DY model and the BK model, we aim to capture and deeply uncover the dynamic variation characteristics of the return spillover effects among different sectors within the petroleum industry chain, as well as the evolution of these effects over time.
The contributions of this article lie in the following three aspects: firstly, it integrates the oil extraction, oil processing, and oil trade industries in Chinese oil industry chain into a unified research framework, and comprehensively analyzes the return spillover relationship and net spillover relationship among the three through the TVP-VAR-DY model. Secondly, the BK model was introduced to measure the dynamic spillover effects among the three major industries in the oil industry chain from a combined perspective of time and frequency domains. We analyze the transmission mechanisms of price signals across different frequency domains in depth, revealing the mutual influence of price fluctuations in the three industries in the short, medium, and long term. Finally, we analyze in detail the net directional and bidirectional spillover effects of oil extraction, oil processing, and oil trade industries in different frequency domains, and drew spillover network diagrams to visually display the different roles of the three industries in spillover propagation, and tracked the dynamic changes of these roles.
The remainder of this paper is structured as follows: Section 2 presents a literature review, summarizing previous research on spillover effects within crude oil markets. Section 3 introduces the research methodology, including the application of the TVP-VAR-DY model and the BK model. Section 4 conducts an empirical analysis, presenting the detailed research findings. Finally, Section 5 concludes the paper, offering recommendations and future research directions.
2 Literature review
Current scholarship has extensively investigated spillover effects in crude oil markets. Researchers have utilized various econometric approaches to examine inter-market relationships within international crude oil markets. According to the market linkage theory, prices across different markets exhibit characteristics of mutual influence and coordinated fluctuations due to factors such as economic interconnections and trade activities. Chen et al. [9], Elder et al. [10], Liao et al. [11], Caporin et al. [12] empirically reveal that there is a significant correlation and co-integration between WTI and Brent crude oil market, and Hammoudeh et al. [13] further demonstrate significant spillover effects between crude oil and refined product markets, including various petroleum products such as heating oil and gasoline, Additionally, Ji and Fan [14] find a lead-lag relationship among major international crude oil markets (WTI, Brent, Dubai, Tapis, and Nigeria), providing a new perspective for understanding the dynamics of the global crude oil market. Leong [15] focuses on the causal relationship between BRENT crude oil futures returns and crude oil related industry stock indices, as well as the dynamic correlation and risk spillover effects between international oil prices and domestic oil related industry stock markets, further confirming the heterogeneous impact of oil price fluctuations on industry markets.
The interaction between futures and spot markets remains a central topic in energy finance research. Studies by Huang et al. [16], Lei and Yong [17], Lee and Zeng [18], Wang and Wu [19], Mehrara and Hamldar [20], Chen et al. [21], Chang and Lee [22], Klein [23] substantially confirm the substantial correlation and spillover effects between futures and spot markets for WTI and Brent crude oil. Furthermore, Magkonis and Tsouknidis [24] extend this understanding by revealing similar spillover effects between futures and spot prices of crude oil commodities across various markets, thereby deepening our comprehension of crude oil market integration. With the advancement of research, scholars have increasingly focused on the price transmission mechanisms within the petroleum industry chain. Complex Systems Theory and Sociophysics posit that financial markets constitute dynamic networks formed through nonlinear interactions among a multitude of heterogeneous agents (e.g., investors, institutions, and information nodes), emphasizing that market fluctuations stem from the superposition of multiple micro-level behavioral feedback loops rather than being driven by singular factors. The petroleum industry chain represents a quintessential complex network system, where price fluctuations are not transmitted through simple linear relationships but are instead influenced by multiple factors, such as market structure, policy interventions, and investor behaviors. For instance, Guo et al. [25] select 10 oil products from three crucial links—oil production, consumption, and market transactions—within the oil industry chains across global markets. Employing network motif analysis, they explored the price lead-lag relationships among these products. Their findings reveal the presence of price lead-lag relationships both horizontally across regions and vertically within the industry chain. Qi et al. [26] comprehensively analyzed the price spillover relationships between major commodities within the Chinese petroleum industry chain by constructing a multidimensional spillover network, revealing the transmission path and mediating role of crude oil price fluctuations within the industry chain.
With the rapid development of Chinese economy and the continuous growth of energy consumption, the Chinese crude oil market has become increasingly important in the international crude oil market. Scholars have conducted extensive research on the correlation between the Chinese crude oil market and the international crude oil market. These studies all show that there is a significant correlation and spillover effect between Chinese crude oil prices and international crude oil prices (see, e.g., [3, 27–31]).
Compared with existing studies, this paper contributes to the literature in three key aspects. Firstly, while most existing research concentrates on price dynamics in the overall market or specific markets, this study provides a more targeted and in-depth analysis by focusing on price transmission mechanisms across different segments of Chinese petroleum industry chain. Second, methodologically, we introduce an enhanced time-varying parameter vector autoregression (TVP-VAR) model, which allows for more precise identification of nonlinear transmission effects. Third, in terms of theoretical contribution, our findings not only confirm the vertical transmission of price information along the industry chain but also reveal the critical mediating role of petroleum processing—a novel insight that enriches the understanding of price signal propagation in capital markets. By quantifying the micro-level price transmission mechanisms within Chinese petroleum industry, this study offers policymakers and corporate decision-makers more actionable insights, underscoring the novelty and significance of our research.
3 Methodology
3.1 TVP-VAR-DY spillover index model
To further explore the spillover effects and time-varying characteristics of the three key links in the oil industry chain, namely, extraction, processing, and trade, this article employs the TVP-VAR-DY model proposed by Antonakakis et al. [32], which combines the time-varying parameter vector autoregressive (TVP-VAR) model with the spillover index method (DY) based on generalized variance decomposition proposed by Diebold and Yilmaz [33], Diebold and Yılmaz [34], It provides an effective tool for measuring the relationship and influences between financial markets (see, e.g., [35–40]). In the specific research process, the TVP-VAR model is constructed by Equations 1, 2:
where
Furthermore, Koop et al. [41], Pesaran and Shin [42] introduced the concept of Generalized Forecast Error Variance Decomposition (GFEVD) based on the Wold theorem. To effectively apply this concept, it is necessary to transform the TVP-VAR model into a TVP-VMA process (Equation 3):
where
where H represents the prediction period,
Based on the prediction error variance matrix constructed above, the following spillover indices can be obtained:
The spillover from market i to other markets j is defined as Equation 7:
Market i receiving spillover from other markets j is given by Equation 8:
The net spillover effect of market i on other markets j can be calculated as Equation 9:
The net pairing spillover index NPDC is given by Equation 10:
3.2 Frequency-domain spillover index model
When a market faces price shocks from other markets, its response and price spillover effects may exhibit different durations, that is, different frequency performance. Baruník and Křehlík [44] argue that the DY spillover index method is apply at the overall level, which may cover spillovers of different frequencies. Therefore, researchers adopt the spectral representation method of covariance. This method obtains the frequency response function through the Fourier transform of coefficients, which can then be used to obtain the generalized variance decomposition in the frequency domain. Specifically, at a given frequency ω, the calculation process of generalized prediction error variance decomposition is as follows:
According to the spectral decomposition method of Stiassny [45], the frequency response function
Frequency GFEVD is a combination of spectral density and GFEVD, which also requires normalization in the time domain as shown in Equations 12, 13:
Where
The total revenue spillover within frequency band d can be calculate using the following equations (from Equations 15–19):
Baruník and Křehlík [44] argue that the above formula only describes fluctuations within specific frequency bands. The contribution of the given frequency band d to the total spillover can be measured by a weighted metric (from Equations 20–24), where the weight is
The oil industry chain, encompassing upstream extraction, midstream processing, and downstream trade sectors, exhibits return that are influenced by a multitude of macroeconomic factors, policy interventions, and market supply-demand dynamics, with their effects evolving over time. The TVP-VAR-DY model, built upon the vector autoregression (VAR) framework and incorporating time-varying parameter (TVP) and dynamic correlation (DY) features, provides an effective analytical tool for investigating return spillover effects and dynamic interdependencies among these sectors.
4 Empirical analysis
4.1 Data
According to the division of the industry chain, upstream industries in the oil industry chain engage in oil extraction and development, while downstream industries engage in oil transportation, refining, processing, and sales. The oil industry stock index is one of the comprehensive indicators for measuring the actual operational performance of oil enterprises. Therefore, this article selects the stock indices of oil extraction (Ex), oil processing (Pr), and oil trade (Tr) industries from the tertiary industry index of Shenwan as representatives for studying the upstream, midstream, and downstream industries of oil, aiming to deeply explore the dynamic correlation and mutual influence between the stock index returns of the oil industry chain. We collect daily data spanning from 2 January 2014 to 26 April 2024, all source from the Eastmoney Choice Financial Terminal1. After screening and matching, a total of 2,496 samples are finally obtained. To calculate the return, we perform logarithmic first-order differencing on all data:
Table 1 shows the descriptive statistics of each variable. According to the skewness coefficient, the stock index of the oil extraction industry shows a right-skewed feature, while the stock indices of both the oil processing and oil trade industries display left-skewed features; From the kurtosis perspective, the kurtosis of each variable is greater than 3, showing a hyperkurtosis distribution, which suggests a relatively concentrated distribution of data. After ADF testing, all sequences significantly rejected the null hypothesis of the existence of unit roots, thus proving that all variables are stationary. Therefore, we can proceed with modeling and analysis.
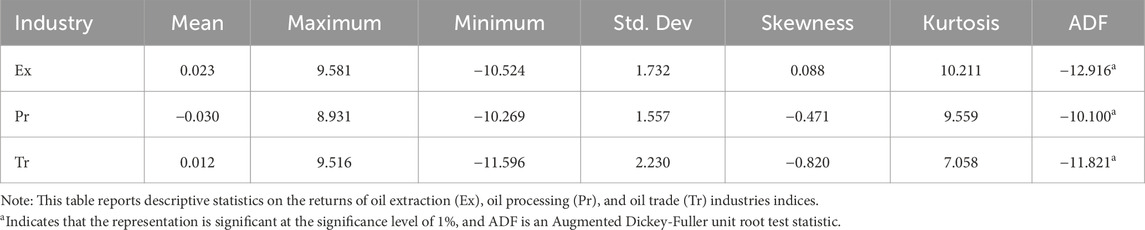
Table 1. Descriptive statistics.
4.2 Static analysis
To analyze the connectivity of the total spillover of stock index returns in the oil extraction, oil processing, and oil trade industries in the time domain and short-term (1–5 days), medium-term (5–22 days), and long-term (22-infinite extension) frequencies, we calculate connectivity matrices in both the time and frequency domains. During the modeling process, we selected the optimal lag length of the VAR model as the 7th order based on the AIC criterion, and the results are presented in Tables 2, 3.
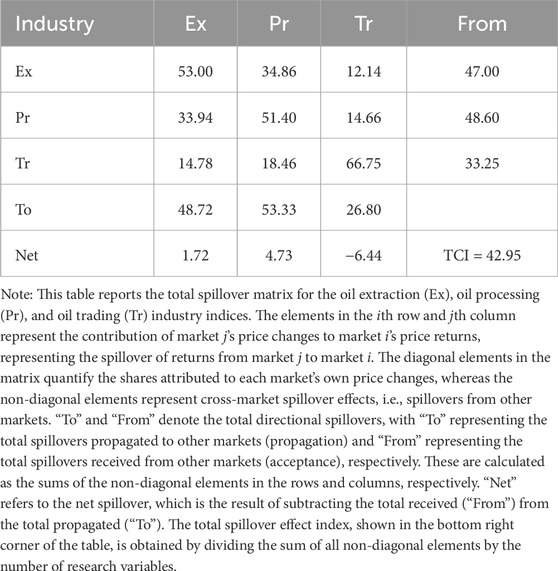
Table 2. Total connectedness.
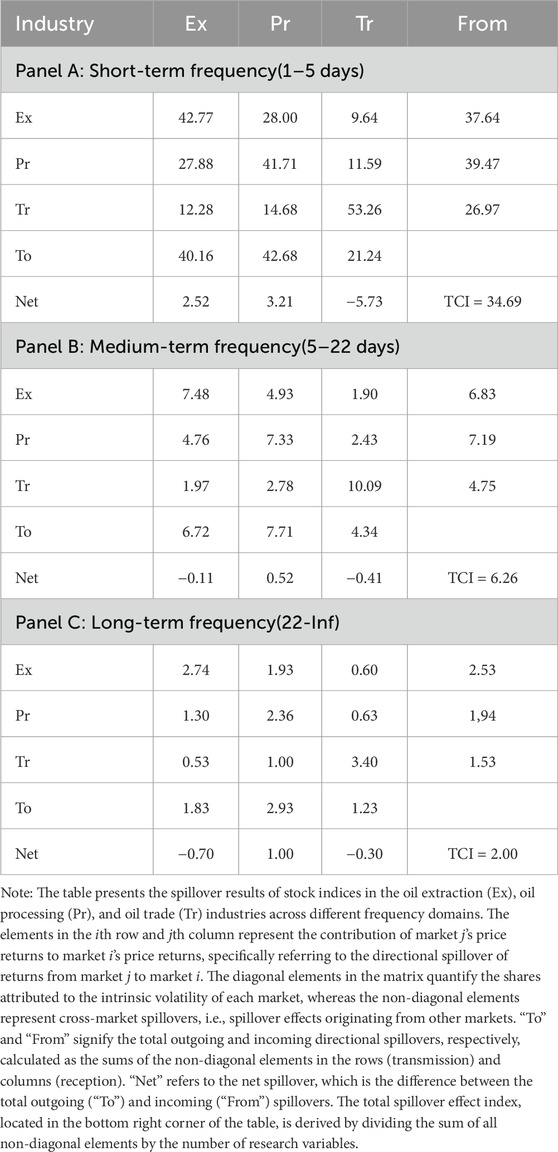
Table 3. Frequency connectedness.
Table 2 reports the total spillover matrix of stock indices in the oil extraction, oil processing, and oil trading industries. The data in Table 2 reveal that the diagonal elements of the matrix generally exhibit higher values than the non-diagonal elements, indicating that each variable has the most significant spillover effect on itself. In other words, the impact of the returns of each variable on itself dominates. The total spillover effect in the oil extraction, oil processing, and oil trading industries is as high as 42.95%, indicating that nearly half of the return variation among the three markets can be attributed to the impacts from the other two markets, which means a significant spillover relationship among variables. From the Net Spillover Index (Net), it can be seen that both the oil extraction industry and the oil processing industry have a net spillover greater than 0, indicating that they are the transmitters of spillover in the research system. Conversely, the oil trading industry has a net spillover less than 0, indicating that it is the recipient of spillovers.
Table 3 presents a detailed list of the changes in spillover effects in different frequency domains. We observe that the spillover effects between the three markets were 34.69%, 6.26%, and 2.00% in the short, medium, and long-term frequency domains, respectively. Specifically, the BK model divides the total spillover into three-time spans and we study the different degrees of spillover in these three time spans. The frequency domain results in Table 3 show that as the time span increases, the spillover index among the three markets gradually diminishes. In addition, we also found that regardless of whether in short, medium, or long cycles, the oil trading industry has always been a transmitter of return spillovers, the oil processing industry has always been a receiver of spillovers, and the oil extraction industry transitions from being a transmitter to a risk receiver.
4.3 Dynamic analysis
Under the influence of special events, the market price of the crude oil industry chain may undergoes significant fluctuations. Static spillover analysis mainly focuses on evaluating the average impact of each variable across the entire sample period. However, this approach has inherent limitations, as it struggles to effectively capture the time-varying nature of spillovers between markets and the specific spillover effects within distinct frequency domains. Therefore, we further analyze the dynamic spillover effects between markets from the perspective of each frequency domain. Figure 1 provides a visual display of three frequency domain spillover indices: short-term, medium-term, and long-term, where the total spillover across the time domain is equal to the sum of the spillovers in each frequency domain.
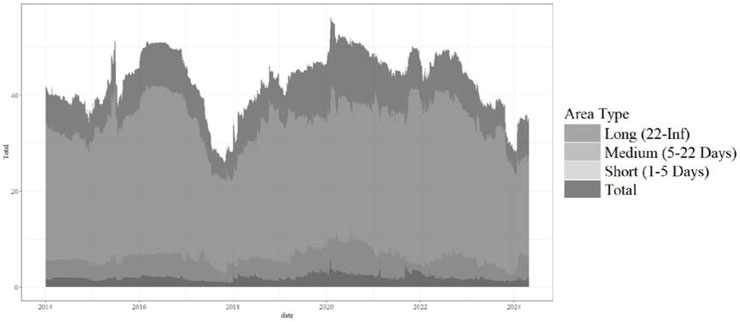
Figure 1. Dynamic total connectedness in various frequencies. This figure presents the trend in dynamic total spillover effects across different frequency bands within Chinese oil industry chain, spanning from 2 January 2014, to 26 April 2024. The analysis is based on the results derived from the TVP-VAR-DY model and the BK model. The frequency bands considered include the short-term band (set at 1–5 days, reflecting the 5-day trading week in stock markets), the medium-term green band (spanning 5–22 days, considering approximately 22 trading days in a month), and the long-term band (exceeding 22 days). The total spillover effect is calculated as the summation of spillover effects across these three frequency bands: short-term, medium-term, and long-term.
As shown in Figure 1, the overall trend reveals significant volatility in the total spillover index of the system. The fluctuation range of the total return spillover index between markets generally falls between 20% and 50%, and in exceptional cases, the peak can reach approximately 60%, indicating that the spillover effects between the oil extraction, oil processing, and oil trading industries exhibit time-varying characteristics. Notably, the spillover effect primarily manifests in the short term, with impacts lasting less than a week, suggesting a rapid spread among markets. In contrast, the long-term spillover effects appear relatively weak, possibly attributed to the fact that the long-term behavior of the oil extraction, processing, and trading industries within the oil industry chain is primarily governed by their inherent fundamentals.
According to the time-domain and frequency-domain charts, there are five significant increases in the total spillover index, namely, the oil price crash in 2014, the Chinese stock market crash in 2015, the United Kingdom Brexit in 2016, the outbreak of the pandemic in 2020, and the Russia-Ukraine conflict in 2022. In 2014, amid weak demand for crude oil, the Organization of the Petroleum Exporting Countries (OPEC) continued to increase crude oil production in order to maintain its market share and engage in fierce competition with US shale oil companies. This move led to a continuous increase in oil supply and a rebalancing of supply and demand in the crude oil market, resulting in significant market volatility. This change has also intensified the spillover effects between relevant markets in the Chinese oil industry chain, making the entire industry chain face more complex and volatile risks. The “6.26” stock market crash in China was the main reason for the rise in the total spillover index in 2015. This crash caused significant turbulence in the Chinese oil market, with various industries facing strong external shocks, thereby strengthening the correlation between different markets. At the beginning of 2016, the total spillover index began to show an upward trend again, which may be attributed to two factors: one is Brexit, and the other is major political, economic, and terrorist events, including the oil crisis. In 2020, the global epidemic broke out, and as the spread of the disease continued to expand, related risks also intensified. The total spillover effect at different time periods sharply increased and reached a peak. The increase in uncertainty during this period has led to a more uniform response from investors to shocks, thereby enhancing the connections among markets at different time frequencies. In 2022, the Russia-Ukraine conflict again triggered market turbulence, leading to an increase in the total spillover effect in oil-related industries. With the implementation of a series of measures by the Chinese government aimed at restoring the economy and improving people’s livelihoods, such as the temporary zero tax rate on coal imports in response to the Russia-Ukraine conflict, the exemption of VAT for small-scale taxpayers, and the normalization of epidemic control measures, the spillover effect is gradually declining. At this point, the total spillover index began to stabilize, though it still remains relatively high compared to pre-extreme-event levels. In summary, whenever the socio-economic situation confronts major events or extreme risks, the spillover effects among oil-related industry markets will significantly intensify. As the economy and society gradually enter a period of stable development, this risk effect will also gradually stabilize.
Based on the investigation of the time-varying spillover effects of total returns in multiple markets, we further conduct in-depth analysis of the specific time-varying spillover effects between each market. Figures 2, 3 show the spillover effects and inflow effects2 of each market in the sample in the time domain and different frequency domains.
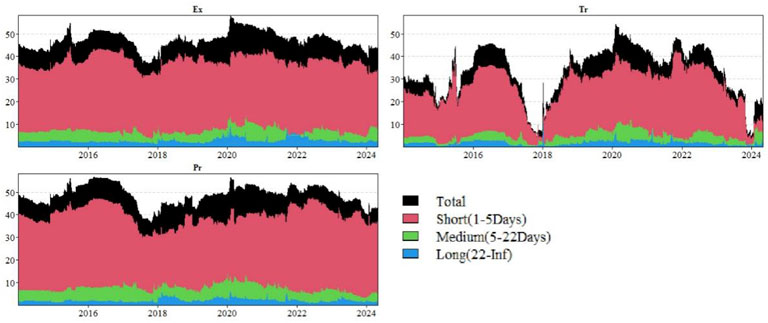
Figure 2. Dynamic total directional connectedness to others. This figure illustrates the trend in spillover effects across various frequency domains for different markets within Chinese oil industry chain, spanning from 2 January 2014, to 26 April 2024. The analysis is based on the results derived from the TVP-VAR-DY model and the BK model. The red area depicts the spillover in the short-term frequency band (1–5 days), the green area represents the spillover in the medium-term frequency band (5–22 days), and the blue area reflects the spillover in the long-term frequency band (exceeding 22 days). The black area, on the other hand, presents the summation of spillover effects across these three frequency bands: short-term, medium-term, and long-term.
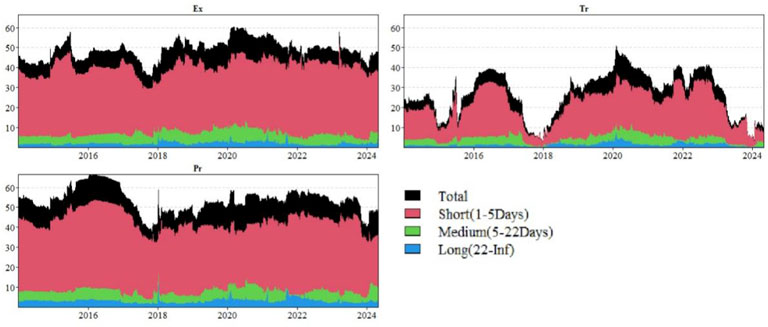
Figure 3. Dynamic total directional connectedness from others. This figure presents the trend in inflow spillover effects across different frequency domains for various markets within Chinese oil industry chain, spanning from 2 January 2014, to 26 April 2024. The analysis is based on the results derived from the TVP-VAR-DY model and the BK model. The red area illustrates the inflow spillover in the short-term frequency band (1–5 days), the green area represents the inflow spillover in the medium-term frequency band (5–22 days), and the blue area depicts the inflow spillover in the long-term frequency band (exceeding 22 days). The black area, in contrast, shows the aggregated result of inflow spillover effects across these three frequency bands: short-term, medium-term, and long-term.
From Figures 2, 3, we find that first, the directional spillover index reflects the time-varying nature of spillover effects between the oil extraction, oil processing, and oil trade industries. Secondly, from the results of directional spillover indices, the spillover indices and inflow indices of various markets show certain similarities in overall trends, with their changes mainly concentrated between 1% and 40%. Finally, the net spillover effects of all variables in the time domain and short-term frequency bands are very obvious, while the spillover effects in the medium and long-term frequency bands are relatively small, which is consistent with the results of the static analysis previously mentioned.
Due to the bidirectional nature of spillover effects, a higher spillover index only indicates stronger correlation between markets, but cannot accurately reveal the direction of net spillover from one market to another. Therefore, it is necessary to conduct in-depth analysis of the net spillover index to determine the direction of return spillovers in the oil extraction, oil processing, and oil trade industries.
According to the net spillover index graph in Figure 4, the net spillover index fluctuates between positive and negative values, showcasing its temporal variability. Predominantly, however, the oil extraction and processing market exhibits a positive trend in its net spillover index, indicating that these industries have a greater spillover effect on the oil trading industry than they receive from other markets. Conversely, the oil trading industry’s net spillover index registers a negative value, revealing its primary role as a recipient of spillovers. These findings suggest that within the oil industry chain, the extraction sector, as the primary source of crude oil resources, directly influences market supply through its production decisions and output adjustments. The processing sector, relying on crude oil supplied by extraction, transforms raw materials into various petroleum products through advanced refining technologies. Both sectors occupy relatively upstream positions in the value chain. Due to their control over critical resources and processing capabilities, they exert greater dominance in pricing and supply dynamics, more actively transmitting market fluctuations to the trade sector while receiving comparatively limited spillover effects from other markets. Conversely, the oil trade sector operates at the mid-to-downstream level of the industrial chain. In terms of market structure, it faces constraints from upstream supply conditions (extraction and processing) while simultaneously responding to demand fluctuations from end consumers. Additionally, external factors such as trade policies, tariff adjustments, and import-export quotas significantly impact its operations. These combined factors render the trade sector more susceptible to external shocks, primarily absorbing spillover effects transmitted from upstream industries rather than generating substantial outward spillovers. From this analysis, it becomes evident that while directional spillover effects can illuminate the overall beneficial impact of a variable on others within the system, the degrees of correlation and sensitivity among variables vary. Consequently, further analysis and discussion are paramount.
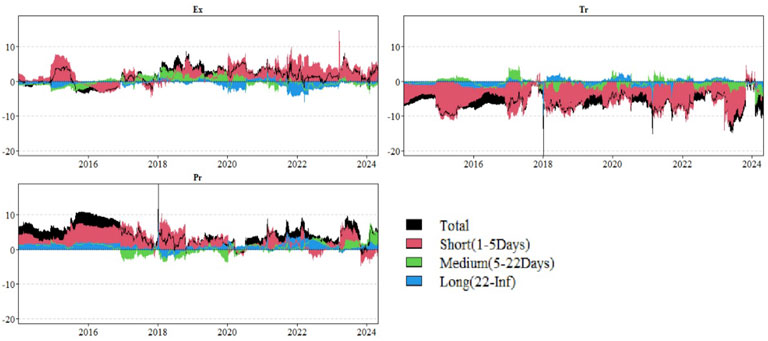
Figure 4. Dynamic net directional connectedness. This figure presents an analysis based on the TVP-VAR-DY model and the BK model. It reveals the dynamic evolution of net spillover effects across various markets within Chinese oil industry chain across different frequency domains, spanning from 2 January 2014, to 26 April 2024. These net spillover effect indices are derived by calculating the difference between the “outward spillovers” (To) and “inward spillovers” (From) for each market variable. Positive values indicate that the market variable acts as a net transmitter to other variables across the entire industry chain, whereas negative values suggest that the market variable is a net receiver, primarily receiving influences or information from other variables. The red areas reflect net spillovers in the short-term frequency band (1–5 days); green areas represent net spillovers in the medium-term frequency band (5–22 days); and blue areas depict net spillovers in the long-term frequency band (beyond 22 days). The black areas present the summation of net spillover effects across the short-term, medium-term, and long-term frequency bands.
To delve into the dynamic mechanism of mutual influence between two industries, we employed a spillover index model with time-varying parameters, analyzing the pairwise spillover effects of returns across industries. The results are depicted in Figure 5.
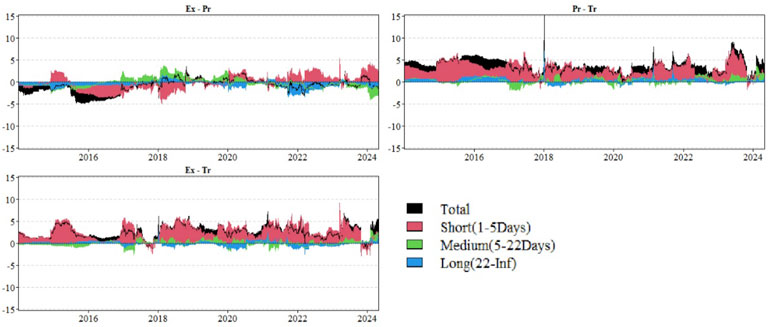
Figure 5. Dynamic net-pairwise directional connectedness. This figure presents the trend in net pairwise spillover effects across various markets within Chinese oil industry chain, spanning from 2 January 2014, to 26 April 2024. The analysis is based on the TVP-VAR-DY model and the BK model. The red area depicts the net pairwise spillovers in the short-term frequency band (1–5 days); the green area represents those in the medium-term band (5–22 days); and the blue area indicates the net pairwise spillovers in the long-term band (beyond 22 days). The black area, on the other hand, summarizes the net pairwise spillover effects across all three frequency bands—short-term, medium-term, and long-term.
From Figure 5, we find that the net paired spillover index of the oil extraction and processing industries varies significantly between positive and negative values, revealing the possibility of bidirectional time-varying asymmetric spillover effects between markets. The size and direction of this net spillover index often fluctuate significantly at certain critical moments, driven by multiple factors. Specifically, the net spillover index of the extraction industry initially showed a significant positive value, followed by a significant change in 2016, which was likely closely related to major political and economic events at the time, such as Brexit. After 2019, the index rose significantly again and became positive, which may be closely related to multiple factors such as energy price fluctuations, the pandemic, and international political events (such as the Russia-Ukraine conflict). These factors work together in the oil market, leading to increased uncertainty in oil supply and costs, which in turn affects downstream industries. In the oil processing industry market, the positive and negative fluctuations of spillover effects reflect their high sensitivity to market dynamics in the extraction industry. During the sample period, the oil trading industry’s net spillover index mostly showed negative values, indicating that the industry played a more significant role as a spillover receiver for most of the time.
To further investigate the directional spillover effects of different variables, we constructed the spillover network diagram, which is shown in Figure 6. From left to right, we have the DY time domain, short-term, medium-term, and long-term frequency domains. Blue represents the net transmitter of spillover, and yellow represents the net receiver of spillover. The arrows in the figure visually display the direction of the spillover effect, whereas the thickness of the arrows accurately reflects the strength of the spillover effect. Specifically, the thicker the arrow, the more significant the corresponding spillover effect, that is, the greater the impact of one market or variable on another market or variable. This representation allows us to intuitively understand the degree of mutual influence between different markets or variables.
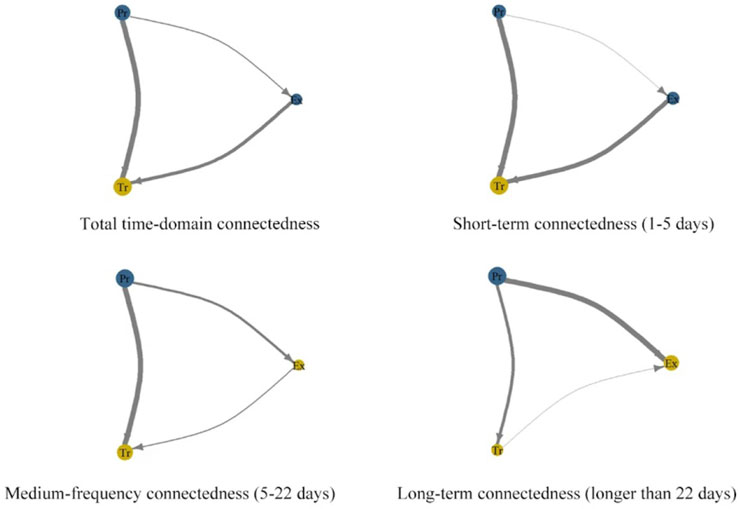
Figure 6. Directional connectedness network. This figure presents a visual representation where each edge connecting two nodes signifies the net pairwise spillover between two markets. The direction of the arrow indicates which market receives the shock from which market, and the thickness of the arrow reflects the intensity of the spillover effect. Blue nodes represent markets that are the originators of shocks within the system, while yellow nodes signify markets that are the recipients of shocks within the system.
As depicted in Figure 6, the oil processing industry exhibits spillover effects on both oil extraction and oil trade, and the oil trade industry is mainly affected by spillover effects. This observation can be attributed to the oil processing industry’s pivotal position in the industrial chain, bridging upstream oil extraction and downstream oil trade and terminal consumption. Consequently, its operational status carries significant weight in the industry chain, directly impacting the operations and profitability of both upstream and downstream enterprises. On the other hand, the oil trading industry is more susceptible to fluctuations in the global oil supply-demand relationship. In instances of global oversupply or inadequate demand for oil, oil prices tend to decline, subsequently compressing profitability within the oil trading industry. This finding aligns with the aforementioned analysis.
4.4 Robustness test
To verify whether the empirical findings of this paper are overly reliant on the choice of model parameters, we adopt the robustness check methodology employ by Pavlova et al. [46], Wu et al. [38], Kočenda and Moravcová [47], among others. By adjusting the lag order of the TVP-VAR model, we investigate the sensitivity of spillover effects to variations in the lag order. On the basis of the benchmark 7th order, we additionally construct TVP-VAR models with 5th, 6th, 8th, and 9th orders. Subsequently, based on the estimation outcomes of these models featuring varying lag orders, we calculate the corresponding total spillover index. The results are shown in Figure 7, which shows the variation of the total spillover index for lag orders of 5th, 6th, 8th, and 9th from top to bottom.
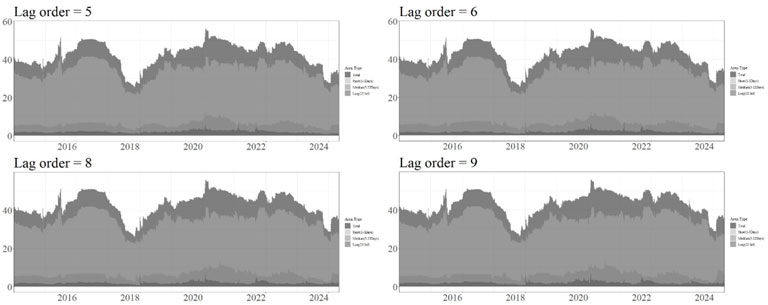
Figure 7. Dynamic total connectedness with different lag orders. This figure presents the trend of dynamic total spillover effects across different frequency domains for China’s oil industry chain, utilizing the TVP-VAR model with lag orders of 5, 6, 8, and 9, respectively.
From the perspective of the size of the total spillover index, both Figures 1, 7 fluctuate roughly within the range of 20%–50%, with similar values, indicating a significant spillover effect in the returns of Chinese oil extraction industry, oil processing industry, and oil trade industry. In terms of the trend in the total spillover index’s variations, both Figures 1, 7 show obvious time-varying characteristics, and the trend over time is basically consistent. Especially in extreme situations, the total spillover index shows a significant increase, confirming that the total spillover index of Chinese oil extraction, oil processing, and oil trading markets is highly sensitive to extreme economic events. Generally, the total spillover index in Figures 1, 7 has experienced five periods of significant growth, namely, the period of oil price collapse in 2014, the period of Chinese stock market crash in 2015, the period of Brexit in 2016, the period of infectious disease outbreak in 2020, and the period of Russia-Ukraine conflict in 2022. In summary, the empirical results of this article are robust and not overly dependent on the lag order chosen by the model.
5 Concluding remarks
5.1 Conclusion
This paper employs the Time-Varying Parameter Generalized Variance Decomposition Spillover Index Model (TVP-VAR-DY) and the Baruník and Křehlík (BK) model, combined with a time-frequency domain perspective, to conduct an in-depth analysis of both static and dynamic spillover effects within China’s oil industry chain system. The research not only calculates static spillover indices to evaluate the overall spillover intensity and direction within the system but also obtains dynamic spillover indices through a rolling sample window approach. This allows for the examination of spillover fluctuations throughout the entire sample period. Furthermore, by incorporating significant events, the study explores the changes in price linkage and risk contagion within the system in response to external shocks. Firstly, the results reveal significant dynamic and asymmetric spillover effects among the three major industries of oil extraction, oil processing, and oil trade in the Chinese oil market. This finding reveals that price fluctuations among these three industries are not isolated but intertwined and mutually influential. Specifically, the oil processing industry plays a major role as a net spillover source, with its price fluctuations having a significant impact on the oil extraction and oil trade industries. In contrast, the oil trade industry primarily acts as a net spillover receiver, with its price fluctuations being significantly influenced by the other two industries. This asymmetric spillover effect demonstrates the complex interaction among various segments within the oil industry chain. Secondly, a deeper analysis from the frequency dimension reveals significant differences in spillover effects at different frequencies. As the frequency increases, the spillover index among the three markets gradually decreases, indicating the time-varying nature of the spillovers among market returns. Specifically, in the short term, the spillover effect among markets is most significant, reaching 34.69%; in the medium term, the spillover effect weakens to 6.26%; and in the long term, the spillover effect further decreases to 2%. This finding reveals the strong mutual influence of market returns spillovers in the short term and their gradual weakening trend in the long term. Thirdly, when confronted with the impact of extreme events, the overall total spillover level of the system tends to significantly amplify. Different types of extreme events have significant impacts on the directional spillover effects of market returns and the net pairwise spillover effects among markets, exhibiting their respective differences and dynamic changes. This finding emphasizes the important influence of extreme events on the spillover effects within the oil industry chain.
5.2 Implications
Building upon these findings, several insights are proposed. Given the dynamic, bidirectional, and asymmetric spillover effects among Chinese petroleum extraction, processing, and trade industries, it is imperative to strengthen collaborative management across the upstream and downstream segments of the industrial chain. Enterprises in these sectors should establish a digital information-sharing platform to exchange real-time data on production, inventory, and sales, jointly develop risk prevention and control plans, and achieve efficient resource allocation and risk sharing.
As the oil processing industry serves as a critical net spillover source, it is essential to formulate precise risk management policies. Enterprises should adopt advanced risk assessment models to conduct quantitative analyses of risks such as raw material price fluctuations and market supply-demand imbalances. Additionally, they should utilize futures hedging to lock in costs and enhance risk resilience. Government regulatory agencies must develop a comprehensive market monitoring system, leveraging big data and blockchain technologies to track global oil market dynamics in real time.
Given the time-varying nature of inter-market spillover effects, short-term measures should include establishing market liquidity monitoring indicators to closely observe significant market fluctuations. Enterprises should flexibly adjust inventory and production schedules, while governments should promptly implement temporary regulatory policies. In the medium term, enterprises ought to optimize their investment portfolios based on market trends, and governments should refine energy strategic reserve mechanisms. In the long run, even if spillover effects diminish, continuous optimization of risk management mechanisms remains crucial. Governments should promote energy structure transition, and enterprises should explore new energy ventures.
In the face of extreme events, systemic spillover levels tend to amplify. Therefore, governments and enterprises must enhance preparedness by establishing comprehensive risk early-warning and emergency response mechanisms, improving extreme event response capabilities, and proactively mitigating potential crises. Furthermore, international cooperation and exchange should be strengthened to collectively address the challenges and risks confronting the global oil market.
5.3 Limitations and future works
This study also acknowledges certain limitations. While it recognizes the impact of extreme events on the overall system spillover level, it does not delve deeply into the distinctions among different types of extreme events, such as natural disasters, policy shifts, and fluctuations in international oil prices, or their specific impact mechanisms. Furthermore, the primary focus of this study is on the return spillover effects within the oil industry chain, without considering the influence of external factors, such as the global economic environment and geopolitical risks, on these internal spillover effects. Future research could consider utilizing advanced models such as high-frequency data models or machine learning algorithms for comparative validation, refining the classification of extreme events and analyzing their impact mechanisms, as well as expanding the analysis to include external linkages of the industry chain to gain a more comprehensive understanding of the dynamic changes within the oil industry chain.
Data availability statement
Data will be made available on request.
Author contributions
LL: Supervision, Writing – original draft. YW: Writing – original draft, Writing – review and editing, Formal Analysis. LW: Writing – review and editing. YM: Writing – review and editing.
Funding
The author(s) declare that financial support was received for the research and/or publication of this article. Guizhou Province Major Science and Technology Achievement Transformation Project [QKHCG(2024)ZD016], Guizhou Provincial Education Department Natural Science Research Project [Qian Jiao Ji (2023) No. 033]; Key Project of Education Science Planning in Guizhou Province “Research on Evaluation and Improvement of Layered Blended Teaching Effect Based on MOOC” (Project No. 2020A046).
Conflict of interest
The authors declare that the research was conducted in the absence of any commercial or financial relationships that could be construed as a potential conflict of interest.
Generative AI statement
The author(s) declare that no Generative AI was used in the creation of this manuscript.
Publisher’s note
All claims expressed in this article are solely those of the authors and do not necessarily represent those of their affiliated organizations, or those of the publisher, the editors and the reviewers. Any product that may be evaluated in this article, or claim that may be made by its manufacturer, is not guaranteed or endorsed by the publisher.
Footnotes
1The data are available at https://choice.eastmoney.com/.
2The spillover index serves as an indicator of the degree to which a market is influenced by other markets, while the inflow index reveals the degree to which a market is influenced by other markets.
References
1. Liang C, Wei Y, Li X, Zhang X, Zhang Y. Uncertainty and crude oil market volatility: new evidence. Appl Econ (2020) 52(27):2945–59. doi:10.1080/00036846.2019.1696943
2. Jie LI, Huang L, Ping LI. Are Chinese crude oil futures good hedging tools? Finance Res Lett (2021) 38:101514. doi:10.1016/j.frl.2020.101514
3. Yang Y, Ma YR, Hu M, Zhang D, Ji Q. Extreme risk spillover between Chinese and global crude oil futures. Finance Res Lett (2021) 40:101743. doi:10.1016/j.frl.2020.101743
4. Liang C, Liao Y, Ma F, Zhu B. United States Oil Fund volatility prediction: the roles of leverage effect and jumps. Empirical Econ (2022) 62(5):2239–62. doi:10.1007/s00181-021-02093-5
5. Wei Y, Wang Z, Li D, Chen X. Can infectious disease pandemic impact the long-term volatility and correlation of gold and crude oil markets? Finance Res Lett (2022) 47:102648. doi:10.1016/j.frl.2021.102648
6. Ma F, Lu X, Zhu B. Uncertainty and fluctuation in crude oil price: evidence from machine learning models. Ann Operations Res (2023) 345:725–55. doi:10.1007/s10479-023-05463-7
7. Nasir MA, Naidoo L, Shahbaz M, Amoo N. Implications of oil prices shocks for the major emerging economies: a comparative analysis of BRICS. Energy Econ (2018) 76:76–88. doi:10.1016/j.eneco.2018.09.023
8. Abuzayed B, Al-Fayoumi N. Risk spillover from crude oil prices to GCC stock market returns: new evidence during the COVID-19 outbreak. The North Am J Econ Finance (2021) 58:101476. doi:10.1016/j.najef.2021.101476
9. Chen W, Huang Z, Yi Y. Is there a structural change in the persistence of WTI–Brent oil price spreads in the post-2010 period? Econ Model (2015) 50:64–71. doi:10.1016/j.econmod.2015.06.007
10. Elder J, Miao H, Ramchander S. Price discovery in crude oil futures. Energy Econ (2014) 46:S18–S27. doi:10.1016/j.eneco.2014.09.012
11. Liao HC, Lin SC, Huang HC. Are crude oil markets globalized or regionalized? Evidence from WTI and Brent. Appl Econ Lett (2014) 21(4):235–41. doi:10.1080/13504851.2013.851766
12. Caporin M, Fontini F, Talebbeydokhti E. Testing persistence of WTI and Brent long-run relationship after the shale oil supply shock. Energy Econ (2019) 79:21–31. doi:10.1016/j.eneco.2018.08.022
13. Hammoudeh S, Li H, Jeon B. Causality and volatility spillovers among petroleum prices of WTI, gasoline and heating oil in different locations. The North Am J Econ Finance (2003) 14(1):89–114. doi:10.1016/S1062-9408(02)00112-2
14. Ji Q, Fan Y. Dynamic integration of world oil prices: a reinvestigation of globalisation vs. regionalisation. Appl Energy (2015) 155:171–80. doi:10.1016/j.apenergy.2015.05.117
15. Leong SH. Global crude oil and the Chinese oil-intensive sectors: a comprehensive causality study. Energy Econ (2021) 103:105558. doi:10.1016/j.eneco.2021.105558
16. Huang BN, Yang CW, Hwang MJ. The dynamics of a nonlinear relationship between crude oil spot and futures prices: a multivariate threshold regression approach. Energy Econ (2009) 31(1):91–8. doi:10.1016/j.eneco.2008.08.002
17. Lei C, Yong Z. The properties and cointegration of oil spot and futures prices during financial crisis. Energy Proced (2011) 5:353–9. doi:10.1016/j.egypro.2011.03.060
18. Lee CC, Zeng JH. Revisiting the relationship between spot and futures oil prices: evidence from quantile cointegrating regression. Energy Econ (2011) 33(5):924–35. doi:10.1016/j.eneco.2011.02.012
19. Wang Y, Wu C. Are crude oil spot and futures prices cointegrated? Not always. Econ Model (2013) 33:641–50. doi:10.1016/j.econmod.2013.05.013
20. Mehrara M, Hamldar M. The relationship between spot and futures prices in Brent oil crude market. Int Lett Social Humanistic Sci (2014) 39:15–9. doi:10.18052/www.scipress.com/ilshs.39.15
21. Chen PF, Lee CC, Zeng JH. The relationship between spot and futures oil prices: do structural breaks matter? Energy Econ (2014) 43:206–17. doi:10.1016/j.eneco.2014.03.006
22. Chang CP, Lee CC. Do oil spot and futures prices move together? Energy Econ (2015) 50:379–90. doi:10.1016/j.eneco.2015.02.014
23. Klein T. Trends and contagion in WTI and Brent crude oil spot and futures markets-The role of OPEC in the last decade. Energy Econ (2018) 75:636–46. doi:10.1016/j.eneco.2018.09.013
24. Magkonis G, Tsouknidis DA. Dynamic spillover effects across petroleum spot and futures volatilities, trading volume and open interest. Int Rev Financial Anal (2017) 52:104–18. doi:10.1016/j.irfa.2017.05.005
25. Guo S, Li H, An H, Ma N, Sun Q, Feng S, et al. Detecting the horizontal/vertical price relationship patterns in the global oil industry chain through network analysis. Energy (2024) 296:131054. doi:10.1016/j.energy.2024.131054
26. Qi Y, Bai J, Liu S. Spillover dynamics among commodities along the Chinese oil industrial chain: from the perspective of multidimensional networks. Int Rev Econ & Finance (2024) 96:103612. doi:10.1016/j.iref.2024.103612
27. Huang X, Huang S. Identifying the comovement of price between China's and international crude oil futures: a time-frequency perspective. Int Rev Financial Anal (2020) 72:101562. doi:10.1016/j.irfa.2020.101562
28. Palao F, Pardo Á, Roig M. Is the leadership of the Brent-WTI threatened by China’s new crude oil futures market? J Asian Econ (2020) 70:101237. doi:10.1016/j.asieco.2020.101237
29. Ji Q, Zhang D, Zhao Y. Intra-day co-movements of crude oil futures: China and the international benchmarks. Ann Operations Res (2022) 313(1):77–103. doi:10.1007/s10479-021-04097-x
30. Wang J, Qiu S, Yick HY. The influence of the Shanghai crude oil futures on the global and domestic oil markets. Energy (2022) 245:123271. doi:10.1016/j.energy.2022.123271
31. Lee CC, Zhou H, Xu C, Zhang X. Dynamic spillover effects among international crude oil markets from the time-frequency perspective. Resour Policy (2023) 80:103218. doi:10.1016/j.resourpol.2022.103218
32. Antonakakis N, Chatziantoniou I, Gabauer D. Refined measures of dynamic connectedness based on time-varying parameter vector autoregressions. J Risk Financial Management (2020) 13(4):84. doi:10.3390/jrfm13040084
33. Diebold FX, Yilmaz K. Better to give than to receive: predictive directional measurement of volatility spillovers. Int J Forecast (2012) 28(1):57–66. doi:10.1016/j.ijforecast.2011.02.006
34. Diebold FX, Yılmaz K. On the network topology of variance decompositions: measuring the connectedness of financial firms. J Econom (2014) 182(1):119–34. doi:10.1016/j.jeconom.2014.04.012
35. Shah AA, Paul M, Bhanja N, Dar AB. Dynamics of connectedness across crude oil, precious metals and exchange rate: evidence from time and frequency domains. Resour Policy (2021) 73:102154. doi:10.1016/j.resourpol.2021.102154
36. Mo B, Meng J, Zheng L. Time and frequency dynamics of connectedness between cryptocurrencies and commodity markets. Resour Policy (2022) 77:102731. doi:10.1016/j.resourpol.2022.102731
37. Hoque ME, Soo-Wah L, Billah M. Time-frequency connectedness and spillover among carbon, climate, and energy futures: determinants and portfolio risk management implications. Energy Econ (2023) 127:107034. doi:10.1016/j.eneco.2023.107034
38. Wu H, Zhu H, Huang F, Mao W. How does economic policy uncertainty drive time–frequency connectedness across commodity and financial markets? The North Am J Econ Finance (2023) 64:101865. doi:10.1016/j.najef.2022.101865
39. Liang C, Goodell JW, Li X. Impacts of carbon market and climate policy uncertainties on financial and economic stability: evidence from connectedness network analysis. J Int Financial Markets, Institutions Money (2024) 92:101977. doi:10.1016/j.intfin.2024.101977
40. Polat O, Ertuğrul HM, Sakarya B, Akgül A. TVP-VAR based time and frequency domain food & energy commodities connectedness an analysis for financial/geopolitical turmoil episodes. Appl Energy (2024) 357:122487. doi:10.1016/j.apenergy.2023.122487
41. Koop G, Pesaran MH, Potter SM. Impulse response analysis in nonlinear multivariate models. J Econom (1996) 74(1):119–47. doi:10.1016/0304-4076(95)01753-4
42. Pesaran HH, Shin Y. Generalized impulse response analysis in linear multivariate models. Econ Lett (1998) 58(1):17–29. doi:10.1016/S0165-1765(97)00214-0
43. Chatziantoniou I, Gabauer D. EMU risk-synchronisation and financial fragility through the prism of dynamic connectedness. The Q Rev Econ Finance (2021) 79:1–14. doi:10.1016/j.qref.2020.12.003
44. Baruník J, Křehlík T. Measuring the frequency dynamics of financial connectedness and systemic risk. J Financial Econom (2018) 16(2):271–96. doi:10.1093/jjfinec/nby001
45. Stiassny A. A spectral decomposition for structural VAR models. Empirical Econ (1996) 21:535–55. doi:10.1007/BF01180700
46. Pavlova I, De Boyrie ME, Parhizgari AM. A dynamic spillover analysis of crude oil effects on the sovereign credit risk of exporting countries. The Q Rev Econ Finance (2018) 68:10–22. doi:10.1016/j.qref.2018.03.003
Keywords: oil industry chain, spillover effect, TVP-VAR-DY model, BK model JEL classification: C22, C53, G11, G17
Citation: Lei L, Wang Y, Wu L and Mao Y (2025) Spillover effects in stock index returns within Chinese oil industry chain. Front. Phys. 13:1599993. doi: 10.3389/fphy.2025.1599993
Received: 25 March 2025; Accepted: 30 May 2025;
Published: 18 June 2025.
Edited by:
Ze Wang, Capital Normal University, ChinaReviewed by:
Tingwei Fang, Capital University of Economics and Business, ChinaTao Wu, Chengdu University of Technology, China
Copyright © 2025 Lei, Wang, Wu and Mao. This is an open-access article distributed under the terms of the Creative Commons Attribution License (CC BY). The use, distribution or reproduction in other forums is permitted, provided the original author(s) and the copyright owner(s) are credited and that the original publication in this journal is cited, in accordance with accepted academic practice. No use, distribution or reproduction is permitted which does not comply with these terms.
*Correspondence: Liang Wu, MTAwNDA3MzY2QGd6bnUuZWR1LmNu