 K. Herweg
 V. Schulz1,2,3,4,5†
 S. Gundacker
- 1University Hospital RWTH Aachen, Aachen, Germany
- 2Institute of Imaging and Computer Vision, RWTH Aachen University, Aachen, Germany
- 3Hyperion Hybrid Imaging Systems GmbH, Aachen, Germany
- 4Physics Institute III B, RWTH Aachen University, Aachen, Germany
- 5Fraunhofer Institute for Digital Medicine MEVIS, Aachen, Germany
- 6Institute of High Energy Physics, Austrian Academy of Sciences, Vienna, Austria
In the pursuit of developing the fastest time-of-flight positron emission tomography (ToF-PET) detectors, understanding and minimizing noise factors that significantly influence the timing performance of such detectors are vital. Currently, state-of-the-art ToF-PET detectors are silicon photomultiplier (SiPM)-based scintillation detectors, which introduce SiPM-specific noise sources, such as cross-talk. Cross-talk can occur in three scenarios, namely, direct, delayed, and external cross-talk. Although there have been technological developments to address direct and delayed cross-talk, external cross-talk remains challenging to study because it often gets combined with the signal and other noise sources. This work aims to deepen our understanding of external cross-talk by measuring its probability and time distribution across different detector configurations. For this purpose, we conduct dark count measurements with high-frequency electronics and an oscilloscope for readout. We investigate two Broadcom NUV-MT SiPMs, one with
1 Introduction
In the last two decades, silicon photomultipliers (SiPMs) have become the standard photosensor for positron emission tomography (PET) [1–10] due to their high gain, compactness, and cost-effectiveness. They find significant application in the current search for the fastest time-of-flight PET (TOF-PET) detectors [11] owing to their continuously improved timing capabilities [5], [11–15].
SiPMs consist of an array of single-photon avalanche diodes (SPADs) which are connected in parallel and operated in the Geiger mode. There are two possible modes of readout for these SPADs: an analog SiPM, where the sum of signals over all connected SPADs is read out and then digitized in a separate circuit, often an application-specific integrated circuit (ASIC), e.g., NINO [16, 17], TOFPET2 [17–20], or FastIC [17, 21, 22], and a digital SiPM, where each SPAD is digitized individually [5, 6], [23–26]. In both of these readouts, we encounter cross-talk, which contributes significantly to signal deterioration [14, 26, 27].
Cross-talk occurs in all SPAD-based devices and originates from optical photons, which are created by each avalanche through hot intra-band luminescence [28]. There are three different types of cross-talk based on the photon’s interactions before being detected in the sensor (see Figure 1). First, if the cross-talk photon travels through the silicon and triggers an avalanche in a different SPAD of the same SiPM, it is called internal or direct cross-talk [14, 27, 29]. Second, if the cross-talk photon is absorbed in the bulk of a different SPAD and therefore causes a delayed avalanche, it is called a delayed cross-talk [14, 27]. Third, if the cross-talk photon leaves the silicon sensor and is detected after being reflected from the cover glass or crystal coupled to the silicon, it is considered to be external cross-talk [2, 27, 29].
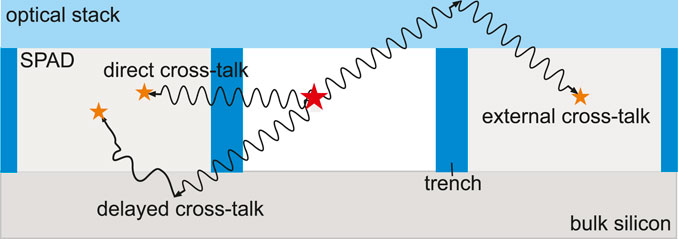
Figure 1. Sketch of an SiPM cross-section describing the three different cases of cross-talk. Direct cross-talk directly traverses SPAD borders and trenches (dark blue) and triggers an avalanche in the neighboring SPAD (light gray). Delayed cross-talk is absorbed in the SiPM bulk silicon (dark gray), which triggers a delayed avalanche in the neighboring SPAD. Lastly, external cross-talk leaves the silicon completely and is reflected from the surface of the SiPM coverglass or a crystal coupled to the SiPM (optical stack, light blue) into the neighboring SPAD, where it triggers an avalanche. Inspired by [27] under CC BY 4.0.
Two of these types of cross-talk have been recently addressed by FBK and Broadcom using metal trenches in between SPADs (NUV-MT SiPMs), which absorb internal and delayed cross-talk photons [30]. Thus, external cross-talk remains as a significant contributor to noise, whose reduction and performance influence has recently been investigated by [31, 32]. Since external cross-talk travels through the optical stack (cover glass, coupling, and scintillator) of a scintillation detector, it is delayed compared to the original avalanche. Depending on the optical stack, this delay of the external cross-talk could impact the timing performance of scintillation detectors.
The impact of delayed cross-talk is especially detrimental in applications where few photons are detected, e.g. Cherenkov radiation. Cherenkov radiation is an alternative to scintillation to further improve the timing performance in TOF-PET. Recently, many investigations have been made into using the Cherenkov radiation of bismuth germanium oxide (BGO) for improving timing performance [9, 15], [33–38]. In BGO detectors, the combination of scintillation and Cherenkov radiation in addition to the few Cherenkov photons makes it challenging to achieve ultra-fast timing performance. The DIGILOG project [38, 39] aims to use finely segmented SiPMs or
In this work, we extend the knowledge available on external cross-talk probability and time distribution based on different optical stacks. We also discuss whether external cross-talk can be distinguished from true events and corrected for. For this purpose, we conduct dark count measurements and time-resolved cross-talk measurements with power-efficient high-frequency (HF) electronics [9, 40, 41] as a readout for NUV-MT SiPMs of different sizes coupled to BGO crystals of different lengths.
2 Materials and methods
In this work, we measured the cross-talk of two differently sized Broadcom NUV-MT SiPMs, AFBR-S4N22P014M and AFBR-S4N44P014M (both with
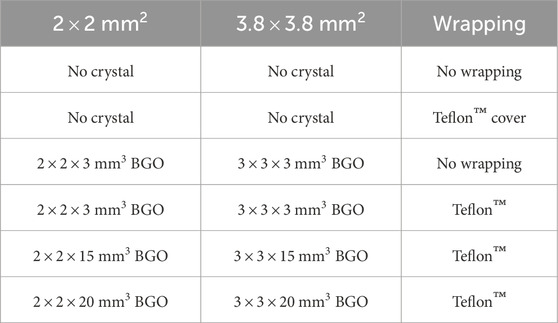
Table 1. Crystal and SiPM configurations used in measurements.
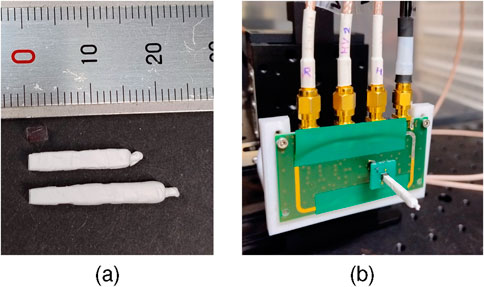
Figure 2. (a) shows the three different crystal lengths with a cross-section of
Measurements were conducted with the timing channel of an HF readout, as described in [9, 40, 41] (see Figure 2b), and an oscilloscope (LeCroy Waverunner 9404M-MS, bandwidth 4 GHz, 20 GS/s) for digitization. The setup was put in a temperature-controlled dark chamber at 16°C. All measurements were conducted for four different bias voltages (
2.1 Dark count scans
To determine the dark count and cross-talk behavior for different SiPM and crystal configurations, we set a low threshold on the falling edge of the timing signal, which has a negative polarity. We then collected waveforms in the time range of
2.2 Time-resolved cross-talk measurement
For estimating the time distribution of cross-talk photons, we measured the time difference
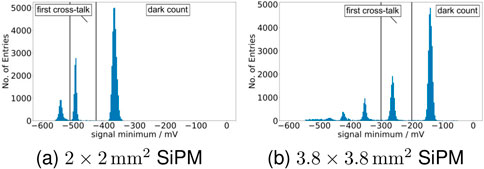
Figure 3. The histogram of the signal minimum for the
After filtering to dark count and cross-talk events (see Figure 3), the respective time difference distributions (see Figure 4) were fitted with a Gaussian curve, and the mean and the full width at half maximum (FWHM) were extracted.
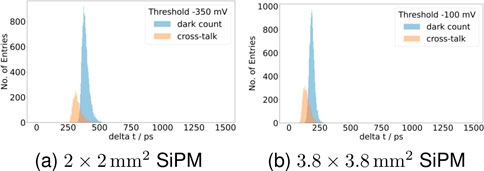
Figure 4. The histograms of time differences between the first timing threshold of
3 Results
3.1 Dark count rates and cross-talk probability
Investigating the changes in the measured DCR based on different optical stacks, it can be seen that, although adding a crystal without wrapping does not significantly change the DCR at different thresholds, adding a reflector like Teflon™ to the optical stack either directly on top of the SiPM or wrapped around the coupled crystal significantly increases the cross-talk (see Figure 5 for 45 V bias voltage). This observation holds for SiPM sizes and all bias voltages. The cross-talk probability for the 45 V bias voltage is increased from 24.8 ± 0.4% (
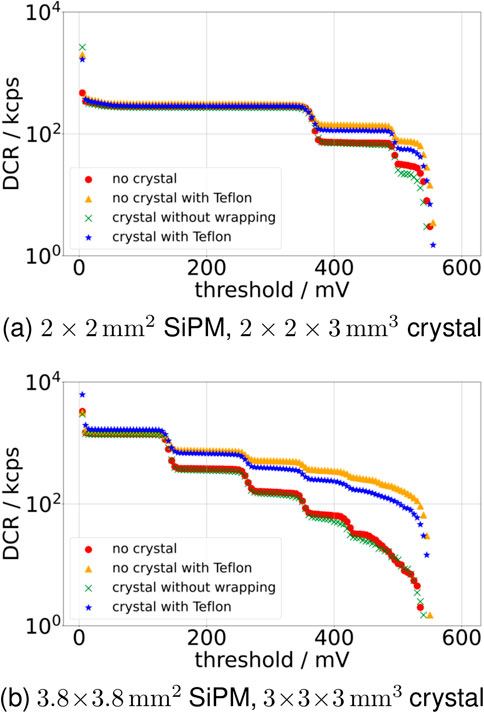
Figure 5. Development of the DCR and cross-talk probability over different thresholds at
While comparing Teflon-wrapped crystals of different sizes in terms of the DCR, it is notable that the cross-talk probability decreases more strongly for the longer crystals than for the shorter ones (see Figure 6). This effect is especially visible in Figure 6b for the
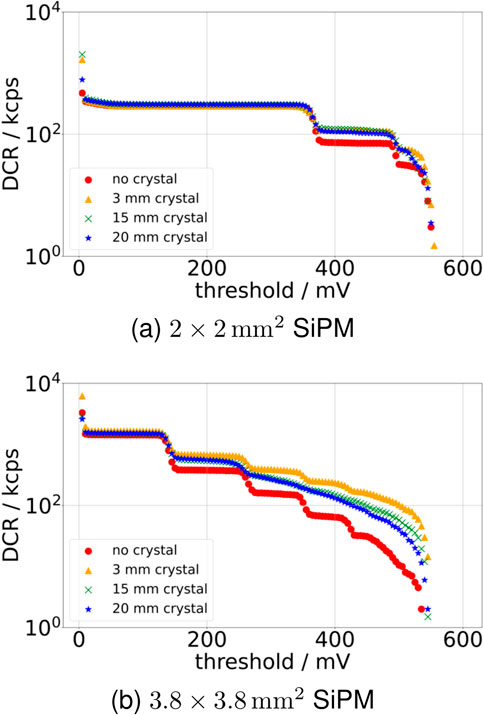
Figure 6. The development of the DCR over different thresholds at
For the different bias voltages investigated, we could observe an overall increase in cross-talk probability for the
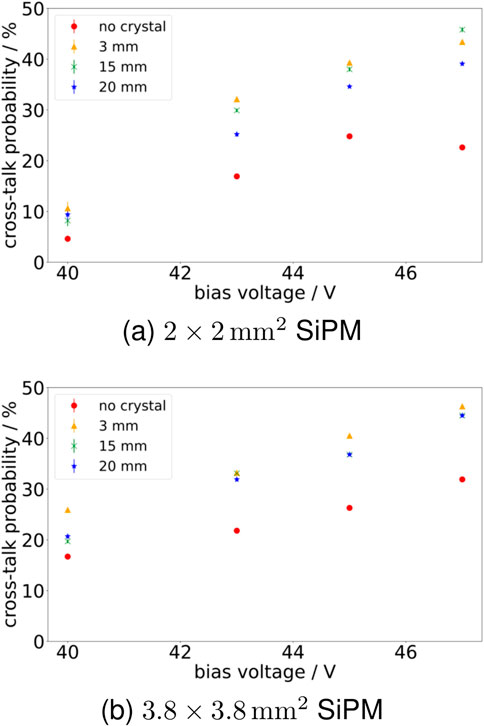
Figure 7. Cross-talk probability for different bias voltages. (a) Shows the
3.2 Time-resolved cross-talk measurement
For the
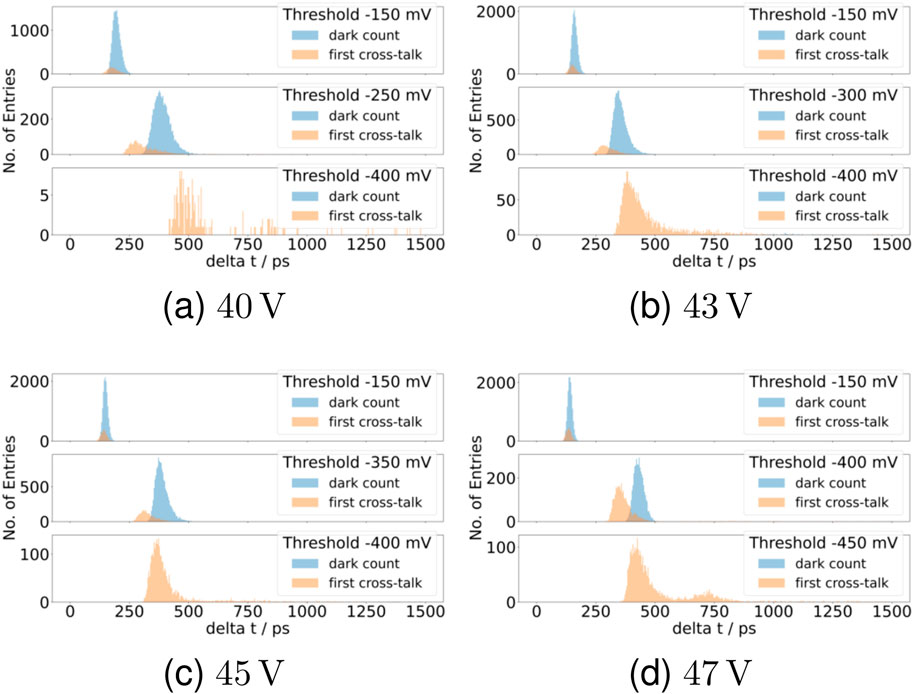
Figure 8. Time differences between different thresholds on the falling edge of the signal for the
Considering now a bias voltage of
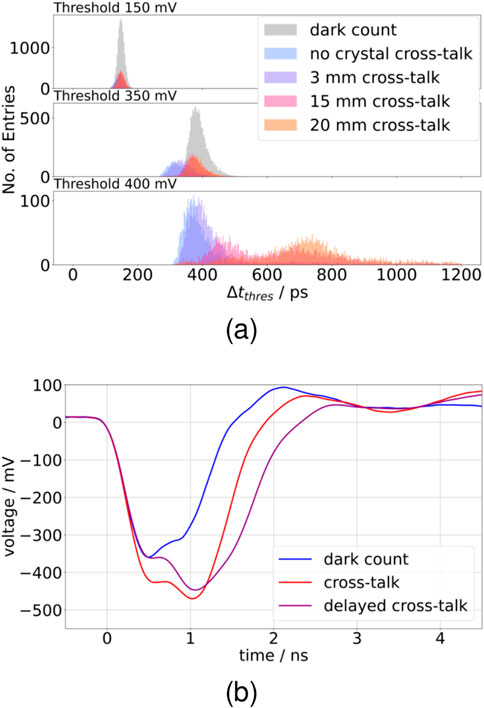
Figure 9. Time differences between different thresholds on the falling edge of the signal for the
For the
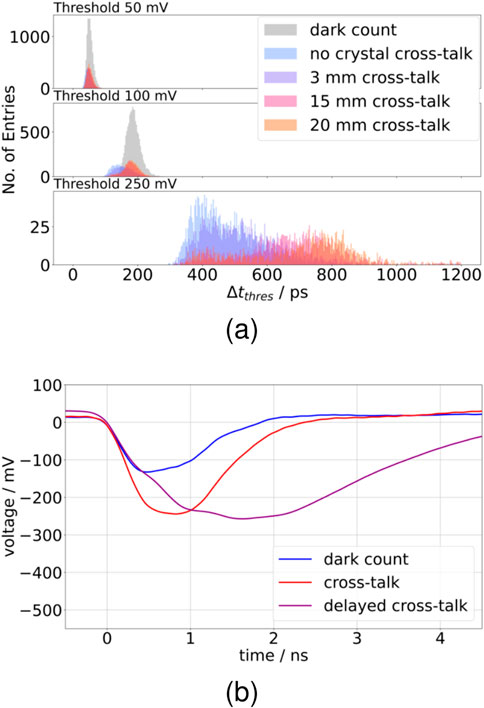
Figure 10. Time differences between different thresholds on the falling edge of the signal for the
We plot the mean of the time difference distributions for dark counts and first cross-talk photons separately (see Figure 11). The error on the means in Figure 11 was chosen to represent the FWHM of the distributions in order to detect the threshold at which cross-talk and dark counts can be distinguished from each other based on the calculated time difference or fall time. For both SiPMs, the mean of the dark count and cross-talk distributions diverge from a common starting point for the measurement with no crystal and Teflon™ wrapping (see Figures 11a,b). For the
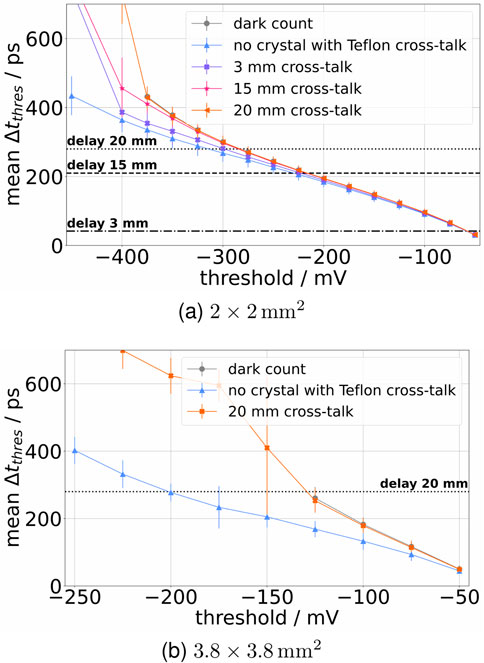
Figure 11. Mean time differences plotted against different thresholds on the falling edge of the signal for the
4 Discussion
4.1 Dark count rates and cross-talk probability
The measured DCR and cross-talk probability fall in the same order of magnitude, as stated in the Broadcom datasheets [42, 43]. A slight deviation in the DCR from the datasheet can be explained through the lower temperature in our setup during measurements (
As observed in Figure 6b, for the measurements with crystals, the DCR steps are more smeared out compared to the SiPM without crystal. In addition, it is apparent that this smearing is more prominent for the longer crystals. We believe that this behavior is caused by a variation in the arrival time of the cross-talk photons, which, depending on when in relation to the primary dark count the cross-talk is detected, will change the signal amplitude for a multi-photon signal.
4.2 Time-resolved cross-talk measurement
In the time-resolved cross-talk measurements, we have discovered that with our measurement setup, we can identify a difference in fall time between a measurement with and without a crystal, if the crystal is sufficiently long and the expected delay of cross-talk photons therefore long enough. We could see this difference for both
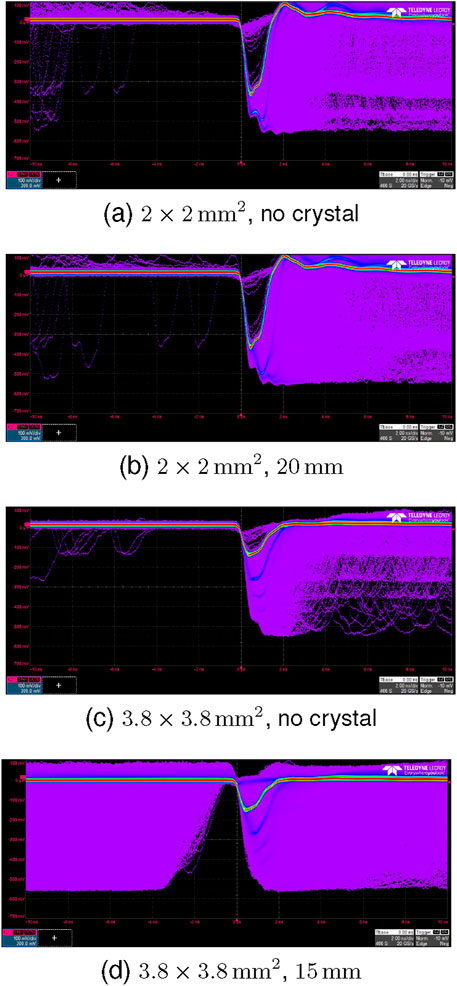
Figure 12. Waveforms for no crystal and
The time difference distributions of cross-talk photons for the most part show as a single peak distribution. In the singular case where a second peak occurs (see Figure 8d), a higher time difference is observed than for the main peak. This double-peak structure appears to be an artifact of the readout electronics, likely attributable to saturation and bandwidth limitations. This hypothesis is supported by the absence of the double peak in the
When the SiPM is directly wrapped in Teflon™, the difference in the cross-talk and dark count time difference distributions for even small thresholds (see Figures 11a,b) shows that the cross-talk photons arrive almost instantly. Therefore, events with cross-talk have a significantly steeper rising edge, which is also visible in Figures 9b, 10b, 12. When a
Regarding fast timing for ToF-PET, this means that in a few-photon measurement with fast signal rise time, as expected for the DIGILOG project [38, 39], cross-talk should not impact the first-photon timing performance significantly as long as thresholds below the expected arrival time of cross-talk photons are chosen. For readouts with slower rise time or bandwidth limitations, cross-talk might still impact the rising edge of the signal even before their expected arrival time. Additionally, if we want to acquire more information than the first-photon timestamp, direct and delayed external cross-talk could combine with later arriving photons, making it difficult to determine the time structure of an event. Further studies are necessary to investigate these possibilities.
5 Conclusion and outlook
In this work, we have quantified that only adding additional optically transparent materials, though with a different refractive index, does not significantly increase the probability to detect cross-talk. For a significant increase, a reflector must be added to the optical stack of the detector. Using a reflector, at most a 1.9-fold increase in the measured cross-talk can be expected for a Broadcom NUV-MT SiPM, independent of its size. In addition, the increase in measured cross-talk decreases with increasing crystal length, down to a 1.4-fold increase of the measured cross-talk for a
The time-resolved measurements have shown that, with the HF readout, it is possible to resolve the shift in cross-talk arrival time when coupling crystals of
As a continuation of this work, a more elaborate measurement setup with a laser as the start signal could be considered to provide a more highly resolved measurement. It is important to note the limitations of our current readout electronics approach, which present challenges that are not easily overcome. Further investigation is needed, possibly with reduced gain performance, to achieve a clearer understanding of the timing aspects of external cross-talk and to mitigate saturation effects.
Data availability statement
The raw data supporting the conclusions of this article will be made available by the authors, without undue reservation.
Author contributions
KH: conceptualization, data curation, formal analysis, investigation, methodology, software, writing – original draft, and writing – review and editing. VS: writing – review and editing. SG: conceptualization, investigation, supervision, and writing – review and editing.
Funding
The author(s) declare that financial support was received for the research and/or publication of this article. This research is funded by the Deutsche Forschungsgemeinschaft (DFG, German Research Foundation) - 500540345 and the Swiss National Foundation (SNF) - #200021L_208073. Open access funding was provided by the Open Access Publishing Fund of RWTH Aachen University.
Acknowledgments
The authors declare the following financial interests/personal relationships which may be considered potential competing interests with the work reported in this paper: VS is the co-founder and employee of the spin-off company Hyperion Hybrid Imaging Systems GmbH, Aachen, Germany.
Conflict of interest
Author VS is co-founder of and employed by Hyperion Hybrid Imaging Systems GmbH.
The remaining authors declare that the research was conducted in the absence of any commercial or financial relationships that could be construed as a potential conflict of interest.
Generative AI statement
The author(s) declare that no Generative AI was used in the creation of this manuscript.
Publisher’s note
All claims expressed in this article are solely those of the authors and do not necessarily represent those of their affiliated organizations, or those of the publisher, the editors and the reviewers. Any product that may be evaluated in this article, or claim that may be made by its manufacturer, is not guaranteed or endorsed by the publisher.
References
1. Kim CL, Wang GC, Dolinsky S. Multi-pixel photon counters for tof pet detector and its challenges. IEEE Trans Nucl Sci (2009) 56:2580–5. doi:10.1109/TNS.2009.2028075
2. Spanoudaki VC, Levin CS. Photo-detectors for time of flight positron emission tomography (tof-pet). Sensors (Switzerland) (2010) 10:10 484–505. doi:10.3390/s101110484
3. Nassalski A, Moszynski M, Syntfeld-Kazuch A, Szczesniak T, Swiderski L, Wolski D, et al. Multi pixel photon counters (mppc) as an alternative to apd in pet applications. IEEE Trans Nucl Sci (2010) 57:1008–14. doi:10.1109/TNS.2010.2044586
4. Yamaya T, Mitsuhashi T, Matsumoto T, Inadama N, Nishikido F, Yoshida E, et al. A sipm-based isotropic-3d pet detector x’tal cube with a three-dimensional array of 1 mm3 crystals. Phys Med Biol (2011) 56:6793–807. doi:10.1088/0031-9155/56/21/003
5. Dam HTV, Borghi G, Seifert S, Schaart DR. Sub-200 ps crt in monolithic scintillator pet detectors using digital sipm arrays and maximum likelihood interaction time estimation. Phys Med Biol (2013) 58:3243–57. doi:10.1088/0031-9155/58/10/3243
6. Casella C, Heller M, Joram C, Schneider T. A high resolution tof-pet concept with axial geometry and digital sipm readout. Nucl Instr Methods Phys Res Section A: Acc Spectrometers, Detectors Associated Equipment (2014) 736:161–8. doi:10.1016/j.nima.2013.10.049
7. Schug D, Lerche C, Weissler B, Gebhardt P, Goldschmidt B, Wehner J, et al. Initial pet performance evaluation of a preclinical insert for pet/mri with digital sipm technology. Phys Med Biol (2016) 61:2851–78. doi:10.1088/0031-9155/61/7/2851
8. Lamprou E, Gonzalez-Montoro A, Canizares G, Ilisie V, Sanchez F, Freire M, et al. Tof-pet detectors based on asic technology and analog sipms. In: 2018 IEEE Nuclear Science Symposium and Medical Imaging Conference, NSS/MIC 2018 - Proceedings (2018). p. 1–4. doi:10.1109/NSSMIC.2018.8824517
9. Gundacker S, Turtos RM, Auffray E, Paganoni M, Lecoq P. High-frequency sipm readout advances measured coincidence time resolution limits in tof-pet. Phys Med Biol (2019) 64(5):055012. doi:10.1088/1361-6560/aafd52
10. Shimazoe K, Yoshino M, Ohshima Y, Uenomachi M, Oogane K, Orita T, et al. Development of simultaneous pet and compton imaging using gagg-sipm based pixel detectors. Nucl Instr Methods Phys Res Section A: Acc Spectrometers, Detectors Associated Equipment (2020) 954:161499. doi:10.1016/j.nima.2018.10.177
11. Lecoq P. Pushing the limits in time-of-flight pet imaging. IEEE Trans Radiation Plasma Medical Sciences (2017) 1:473–85. doi:10.1109/trpms.2017.2756674
12. Gundacker S, Auffray E, Jarron P, Meyer T, Lecoq P. On the comparison of analog and digital sipm readout in terms of expected timing performance. Nucl Instr Methods Phys Res Section A: Acc Spectrometers, Detectors Associated Equipment (2015) 787:6–11. doi:10.1016/j.nima.2014.10.020
13. Nemallapudi MV, Gundacker S, Lecoq P, Auffray E. Single photon time resolution of state of the art sipms,” Journal Instrumentation (2016) vol. 11, 10 doi:10.1088/1748-0221/11/10/P10016
14. Gundacker S, Heering A. The silicon photomultiplier: fundamentals and applications of a modern solid-state photon detector. Phys Med Biol (2020) 65(17):17TR01. doi:10.1088/1361-6560/ab7b2d
15. Gundacker S, Borghi G, Cherry SR, Gola A, Lee D, Merzi S, et al. On timing-optimized sipms for cherenkov detection to boost low cost time-of-flight pet. Phys Med Biol (2023) 68(16):165016. doi:10.1088/1361-6560/ace8ee
16. Anghinolfi F, Jarron P, Martemiyanov A, Usenko E, Wenninger H, Williams M, et al. Nino: an ultra-fast and low-power front-end amplifier/discriminator asic designed for the multigap resistive plate chamber. Nucl Instr Methods Phys Res Section A: Acc Spectrometers, Detectors Associated Equipment (2004) 533:183–7. doi:10.1016/j.nima.2004.07.024
17. Nadig V, Gundacker S, Herweg K, Naunheim S, Schug D, Weissler B, et al. Asics in pet: what we have and what we need. EJNMMI Phys (2025) 12:16. doi:10.1186/s40658-025-00717-8
18. Francesco AD, Bugalho R, Oliveira L, Pacher L, Rivetti A, Rolo M, et al. Tofpet2: a high-performance asic for time and amplitude measurements of sipm signals in time-of-flight applications. Journal Instrumentation (2016) 11(3):C03042. doi:10.1088/1748-0221/11/03/C03042
19. Bugalho R, Francesco AD, Ferramacho L, Leong C, Niknejad T, Oliveira L, et al. Experimental characterization of the tofpet2 asic. Journal Instrumentation (2019) 14(3 Mar):P03029. doi:10.1088/1748-0221/14/03/P03029
20. Nadig V, Schug D, Weissler B, Schulz V. Evaluation of the petsys tofpet2 asic in multi-channel coincidence experiments. EJNMMI Phys (2021) 8(1):30. doi:10.1186/s40658-021-00370-x
21. Gómez S, Alozy J, Campbell M, Fernandez-Tenllado J, Manera R, Mauricio J, et al. Fastic: a fast integrated circuit for the readout of high performance detectors. Journal Instrumentation (2022) 17:C05027. doi:10.1088/1748-0221/17/05/C05027
22. Mariscal-Castilla A, Gómez S, Manera R, Fernández-Tenllado JM, Mauricio J, Kratochwil N, et al. Toward sub-100 ps tof-pet systems employing the fastic asic with analog sipms. IEEE Trans Radiation Plasma Medical Sciences (2024) 8(7 Sep):718–33. doi:10.1109/TRPMS.2024.3414578
23. Degenhardt C, Prescher G, Frach T, Thon A, Gruyter Rd, Schmitz A, et al. The digital silicon photomultiplier-a novel sensor for the detection of scintillation light. In: IEEE nuclear science symposium conference record (2009). doi:10.1109/NSSMIC.2009.5402190
24. Goldschmidt B, Lerche CW, Solf T, Salomon A, Kiessling F, Schulz V. Towards software-based real-time singles and coincidence processing of digital pet detector raw data. IEEE Trans Nucl Sci (2013) 60:1550–9. doi:10.1109/TNS.2013.2252193
25. Gramuglia F, Muntean A, Venialgo E, Lee M-J, Lindner S, Motoyoshi M, et al. Cmos 3d-stacked fsi multi-channel digital sipm for time-of-flight pet applications. In: 2020 IEEE nuclear science symposium and medical imaging conference, NSS/MIC 2020. Boston, MA: Institute of Electrical and Electronics Engineers Inc. (2020). doi:10.1109/NSS/MIC42677.2020.9507833
26. Pratte JF, Nolet F, Parent S, Vachon F, Roy N, Rossignol T, et al. 3d photon-to-digital converter for radiation instrumentation: motivation and future works. Sensors (2021) 21:598–31. doi:10.3390/s21020598
27. Acerbi F, Gundacker S. Understanding and simulating sipms. Nucl Instr Methods Phys Res Section A: Acc Spectrometers, Detectors Associated Equipment (2019) 926:16–35. doi:10.1016/j.nima.2018.11.118
28. Lacaita AL, Zappa F, Bigliardi S, Manfredi M. On the bremsstrahlung origin of hot-carrier-induced photons in silicon devices. Tech Rep (1993) 40:577–82. doi:10.1109/16.199363
29. Guan Y, Anfimov N, Cao G, Xie Z, Dai Q, Fedoseev D, et al. Study of silicon photomultiplier external cross-talk. Journal Instrumentation (2024) 19(6 Jun):P06024. doi:10.1088/1748-0221/19/06/P06024
30. Merzi S, Brunner SE, Gola A, Inglese A, Mazzi A, Paternoster G, et al. Nuv-hd sipms with metal-filled trenches. Journal Instrumentation (2023) 18(5):P05040. doi:10.1088/1748-0221/18/05/P05040
31. Lee S, Choong WS, Cates JW. Characterization of external optical crosstalk reduction for sipm-based scintillation detectors with an optical bandpass filter. Nucl Instr Methods Phys Res Section A: Acc Spectrometers, Detectors Associated Equipment (2024) 1061(Apr):169101. doi:10.1016/j.nima.2024.169101
32. Kratochwil N, Roncali E, Cates JW, Arino-Estrada G Crosstalk between sipms in dual-ended readout. In: 2024 IEEE nuclear science symposium (NSS), medical imaging conference (MIC) and room temperature semiconductor detector conference (RTSD) (2024). doi:10.1109/NSS/MIC/RTSD57108.2024.10657276
33. Kratochwil N, Gundacker S, Lecoq P, Auffray E. Pushing cherenkov pet with bgo via coincidence time resolution classification and correction. Phys Med Biol (2020) 65(11):115004. doi:10.1088/1361-6560/ab87f9
34. Kratochwil N, Auffray E, Gundacker S. Exploring cherenkov emission of bgo for tof-pet. IEEE Trans Radiation Plasma Medical Sciences (2021) 5:619–29. doi:10.1109/TRPMS.2020.3030483
35. Gonzalez-Montoro A, Pourashraf S, Cates JW, Levin CS. Cherenkov radiation-based coincidence time resolution measurements in bgo scintillators. Front Phys (2022) 10(Jan). doi:10.3389/fphy.2022.816384
36. Loignon-Houle F, Charlebois SA, Fontaine R, Lecomte R. Monte Carlo simulations of energy, time and spatial evolution of primary electrons generated by 511 kev photons in various scintillators. Nucl Instr Methods Phys Res Section A: Acc Spectrometers, Detectors Associated Equipment (2022) 1030:166449–9. doi:10.1016/j.nima.2022.166449
37. Latella R, Gonzalez AJ, Bonifacio DAB, Kovylina M, Griol A, Benlloch JM, et al. Exploiting cherenkov radiation with bgo-based metascintillators. IEEE Trans Radiation Plasma Medical Sciences (2023) 7:810–8. doi:10.1109/TRPMS.2023.3310581
38. Herweg K, Nadig V, Bisi S, Bruschini C, Charbon E, Schulz V, et al. Investigating musipms to overcome the limits of bgo in tof-pet. In: 2024 IEEE nuclear science symposium (NSS), medical imaging conference (MIC) and room temperature semiconductor detector conference (RTSD). IEEE (2024). p. 1–2. doi:10.1109/NSS/MIC/RTSD57108.2024.10654922
39. Gundacker S, Bruschini C, Gola A, Herweg K, Merzi S, Muntean AA, et al. Digilog: a digital-analog sipm towards 10 ps prompt-photon tagging in tof-pet. In: 2023 IEEE nuclear science symposium, medical imaging conference and international symposium on room-temperature semiconductor detectors (NSS MIC RTSD). IEEE (2023). p. 1. doi:10.1109/nssmicrtsd49126.2023.10338522
40. Cates JW, Gundacker S, Auffray E, Lecoq P, Levin CS. Improved single photon time resolution for analog sipms with front end readout that reduces influence of electronic noise. Phys Med and Biol (2018) 63(18):185022. doi:10.1088/1361-6560/aadbcd
41. Krake M, Nadig V, Schulz V, Gundacker S. Power-efficient high-frequency readout concepts of sipms for tof-pet and hep. Nucl Instr Methods Phys Res Section A: Acc Spectrometers, Detectors Associated Equipment (2022) 1039(Sep):167032. doi:10.1016/j.nima.2022.167032
44. Hampel MR, Fuster A, Varela C, Platino M, Almela A, Lucero A, et al. Optical crosstalk in sipms. Nucl Instr Methods Phys Res Section A: Acc Spectrometers, Detectors Associated Equipment (2020) 976(Oct):164262. doi:10.1016/j.nima.2020.164262
45. Gola A, Ferri A, Tarolli A, Zorzi N, Piemonte C. Sipm optical crosstalk amplification due to scintillator crystal: effects on timing performance. Phys Med Biol (2014) 59:3615–35. doi:10.1088/0031-9155/59/13/3615
Keywords: SiPM, cross-talk, scintillator, TOF, BGO, PET, optical
Citation: Herweg K, Schulz V and Gundacker S (2025) Analyzing the time distribution of external cross-talk for an SiPM-based TOF-PET detector. Front. Phys. 13:1603556. doi: 10.3389/fphy.2025.1603556
Received: 31 March 2025; Accepted: 16 June 2025;
Published: 05 August 2025.
Edited by:
Andrea Gonzalez-Montoro, Polytechnic University of Valencia, SpainReviewed by:
Nicolaus Kratochwil, University of California, Davis, United StatesEric Harmon, LightSpin Technologies, United States
Copyright © 2025 Herweg, Schulz and Gundacker. This is an open-access article distributed under the terms of the Creative Commons Attribution License (CC BY). The use, distribution or reproduction in other forums is permitted, provided the original author(s) and the copyright owner(s) are credited and that the original publication in this journal is cited, in accordance with accepted academic practice. No use, distribution or reproduction is permitted which does not comply with these terms.
*Correspondence: K. Herweg, a2F0cmluLmhlcndlZ0BsZmIucnd0aC1hYWNoZW4uZGU=; S. Gundacker, c3RlZmFuLmd1bmRhY2tlckBjZXJuLmNo
†ORCID: K. Herweg, orcid.org/0000-0002-2011-7869; V. Schulz, orcid.org/0000-0003-1341-9356; S. Gundacker, orcid.org/0000-0003-2087-3266