 Binyuan Yang1,2
 Tingyu Wang3*Jianzhong Zhang1,2Zhe Ma1,2Xiang He1,2Lipu Liu1,2Yixuan Wang1,2
 Mingjiang Zhang1,2
- 1Key Laboratory of Advanced Transducers and Intelligent Control Systems (Ministry of Education and Shanxi Province), Taiyuan University of Technology, Taiyuan, Shanxi, China
- 2College of Physics and Optoelectronic Engineering, Taiyuan University of Technology, Taiyuan, China
- 3Department of Physics, Taiyuan Normal University, Taiyuan, Shanxi, China
A hybrid phase demodulation structure combining a 3 × 3 coupler and Sagnac interferometer is proposed to improve the spatial resolution and phase demodulation performance of the phase-sensitive optical time-domain reflectometer (φ-OTDR). Through: (1) identical optical path lengths in forward/reverse Sagnac paths resolving spatial resolution degradation caused by optical path differences in conventional schemes (e.g., 3 × 3 demodulation with unbalanced Michelson or Mach-Zehnder interferometers), and (2) SOA integration dynamically adjusting phase difference between paths to enhance signal-to-noise ratio (SNR) of three output signals, this design achieves high phase demodulation quality. Through theoretical analysis and numerical simulation, the performance enhancement effect of this structure has been verified. The results indicate that the SOA modulates the phase offset of the three output signals, significantly improving the phase demodulation quality and extending the amplitude and frequency response range of the system. Compared with the positioning results achieved by the unbalanced Michelson scheme, this method offers higher spatial resolution. Fundamentally, the structure eliminates path-imbalance limitations via Sagnac symmetry while SOA-driven SNR enhancement ensures robust performance.
1 Introduction
Phase-sensitive optical time domain reflectometry (φ-OTDR) has emerged as an up-and-coming technology for various sensing applications. This technique leverages the backscattered Rayleigh signals (RBS) within optical fibers to convey external information, thereby enabling efficient monitoring and sensing of environmental changes [1–3]. Traditional φ-OTDR methodologies, which primarily rely on the intensity demodulation of RBS, exhibit limitations in their capability to detect vibration waveforms [4]. In contrast, the inherent phase information in RBS maintains a linear relationship with external vibrations, allowing phase demodulation to capture the vibration waveforms of external signal accurately. This capability significantly enhances the precision in the quantitative detection of vibrations, advancing the efficacy of φ-OTDR in diverse sensing applications [5].
Up to now, φ-OTDR phase demodulation schemes have primarily been developed based on two principal architectures: heterodyne detection and direct detection. In the heterodyne detection architecture [6], the RBS is superimposed with a local beam emitted by the laser, generating a beat frequency signal that is subsequently detected by a balanced photodetector. This configuration significantly enhances the power and quality of the received optical signal. The primary demodulation techniques employed within this architecture are digital coherent demodulation [7] and I/Q demodulation [8]. Although these methods improve the system’s signal-to-noise ratio (SNR) and sensing distance, they also introduce challenges such as laser source noise and the reduced system stability, which can compromise the accuracy and reliability of signal demodulation.
In contrast to heterodyne detection, direct detection avoids the need for a local beam, relying instead on photodetectors to directly detect the RBS signal [9]. This architecture is noted for its simplicity, cost-effectiveness, and reduced susceptibility to laser noise. Within this framework, the phase-generated carrier (PGC) modulation [10–12] and the 3 × 3 coupler method [5, 13–19] emerge as the primary phase demodulation techniques. The PGC method encodes the vibration signal into sideband signals using high-frequency carrier modulation, utilizing filtering and mixing operations to mitigate noise interference and restore the phase information of the vibration signal. This technique is distinguished by its wide dynamic range, high precision, and excellent linearity, effectively suppressing most low-frequency ambient noise [10]. However, the PGC method requires a high sampling rate and is susceptible to disturbances from the light source. Variations in phase modulation depth can introduce non-linear and harmonic distortion into the demodulation results.
The 3 × 3 coupler method [13] can effectively avoid the carrier depth modulation problem associated with the PGC method, however, it still faces challenges such as low SNR and poor sensitivity. To mitigate these problems, an interferometer is used to split the RBS into two paths, thereby increasing the interference to improve the SNR of the signal before demodulation. The primary interferometers used for this purpose are the Mach-Zehnder interferometer (MZI) [14, 15] and the Michelson interferometer (MI) [16, 17]. However, unbalanced interferometers lead to spatial resolution limitations due to optical path difference between the two interfering arms [18] and the phase demodulation performance of the system is also affected by the common-mode noise introduced by the arm difference [19].
To avoid spatial resolution deterioration and improve phase demodulation performance, this paper proposes a φ-OTDR detection scheme based on a Sagnac interferometer and a semiconductor optical amplifier (SOA). In this scheme, the Sagnac interferometer employs balanced detection, eliminating optical path difference and effectively suppressing common-mode noise. The SOA is inserted into an asymmetric position within the Sagnac interferometer, by adjusting SOA’s gain coefficient, the output intensities of the 3 × 3 coupler are optimized, thereby improving the phase demodulation quality and the system’s amplitude-frequency response range. Simulation results indicate that the proposed system not only maintains high spatial resolution but also significantly enhances both the phase demodulation quality and the amplitude-frequency response range.
2 Principle
2.1 System principle introduction
The schematic diagram of the φ-OTDR system based on hybrid 3 × 3 coupler and Sagnac interferometer is depicted in Figure 1. The system employs a narrow linewidth laser (NLL) as the light source, generating continuous light with a central wavelength of 1,550.12 nm and a linewidth of 3 kHz. This continuous light is modulated into pulsed light with a pulse width of 100 ns using an acousto-optic modulator, where the repetition period is determined by the sensing distance. The pulsed light is then amplified by an erbium-doped fiber amplifier (EDFA1) and directed into the sensing fiber through an optical circulator (OC1). The RBS light along the sensing fiber is subsequently excited and then amplified by EDFA2. The RBS light is fed into the phase demodulation module via OC2, which outputs RBS light across three channels with a 120° phase difference.
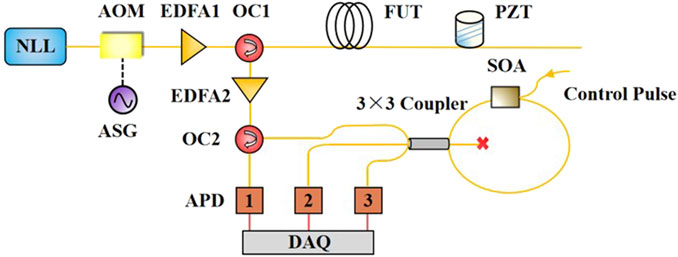
Figure 1. The φ-OTDR system of Sagnac interferometer and 3 × 3 coupler hybrid structure.
In the phase demodulation module, the RBS light is split into three signals by the 3 × 3 coupler, two of them travel into the forward and reverse light propagation paths of the Sagnac interferometer. The SOA is positioned at a distance Δx from the asymmetric center of the interferometer. The two RBS beams receive different gains as they pass through the SOA and are modulated with distinct phase shifts. They then interfere within the 3 × 3 coupler and, after beam splitting, produce three output RBS signal.
The narrow linewidth pulse propagates through the single-mode fiber, interacting with the scattering points to generate RBS signals. Due to the non-uniform distribution of scattering points and variations in the refractive index, the additional phase at each scattering point is influenced accordingly. Given that the RBS light is coherently superimposed within the pulse width range, the fiber segment corresponding to the pulse width is treated as a single sampling point. The RBS light generated by each sampling point returns to OC1 and is subsequently directed to the phase demodulation module [23].
2.2 SOA modulation phase process
The Sagnac interferometer incorporates a SOA positioned asymmetrically within the setup. The RBS light is split into two beams, which propagate along forward and reverse light propagation paths of the Sagnac loop, respectively. Due to the presence of the SOA, these beams undergo distinct cross-gain and cross-phase effects. The electric fields for the forward and reverse light propagation paths are denoted as ECW(t) and ECCW(t), respectively, and can be expressed by Equations 1, 2, as shown below:
where N represents the total number of scattering points, and e corresponds to the electric field amplitudes at the i -th and j -th scattering points. The variables τi and τj denote the time delays associated with the i -th and jth scattering points in the clockwise and counterclockwise beams, respectively. rect [·] is the rectangular pulse function, when 0<[⋅]≤1, rect [·] = 1, otherwise rect [·] = 0. The terms φccw(t) and φcw(t) represent the phase shifts in the forward and reverse paths, respectively. T represents the pulse width, c is the speed of light in a vacuum, α is the fiber’s attenuation coefficient, nf is the effective refractive index, f denotes the optical frequency.
The different modulations of the two optical paths by the SOA are achieved through control pulses [20, 21]. During the detection process described above, let L be the total length of the Sagnac loop, and let Δx denote the distance from the SOA to the symmetric center of the Sagnac loop. From time t0∼[t0+2n (L/2-Δx)/c], as the forward signal passes through the SOA, it experiences saturated gain, with a gain coefficient of G1. In contrast, in the time interval from [t0+2n (L/2-Δx)/c]∼[t0+2n (L/2+Δx)/c], the modulation injection pulse width and peak optical power cause a portion of the carriers inside the SOA to be depleted. As a result, when the reverse signal passes through the SOA, saturated gain is not achieved, and its gain coefficient is G2. Finally, the two signals return to the coupler for interference.
The instantaneous power gain of SOA satisfies the equation [22]:
In Equation 3, τc represents the spontaneous carrier lifetime, τc = 300 ps. G0 denotes the small-signal power gain, and, G0 = -exp (g0L) where g0 is the small-signal gain, g0 = 4000 m−1. L is the length of the SOA, SOA length L = 500 µm. Pin(t) represents the instantaneous power of the control light pulse. Psat is the amplifier’s saturation energy, Psat = hν0 σ/a where hν0 is the photon energy, σ is the mode cross-sectional area, and a is a constant. In this equation, the natural recovery term G (ln G0-ln G)/τc describes the process by which the gain G recovers to G0 in the absence of power input. This term is independent of the control pulse and determined solely by the carrier recombination process. The saturation term
In this model, a rectangular pulse is used as the control light source to analyze its influence on SOA, and the expression of Pin(t) is as follows:
Firstly, the effect of pulse width is analyzed: When tp is small, the interaction time between the pulse and the SOA is short, leading to rapid carrier depletion and recovery. The saturation depth is shallow, and the gain quickly recovers to close to the G0 level. As the tp increases, more carriers interact with photons during the control pulse, resulting in deeper saturation and a longer recovery time. The gain recovery process slows down. Specifically, when the pulse width reaches a certain threshold, the SOA gain will reach a saturation equilibrium point. At this point, the gain will not decrease further as the pulse width increases because all available carriers have been depleted. The system exhibits a saturation equilibrium state where the corresponding gain reduction curve stabilizes. After the end of the control pulse, the gain recovery becomes extremely slow. By numerically solving the equation, we can obtain the gain curves for different pulse widths, as shown in Figure 2a.
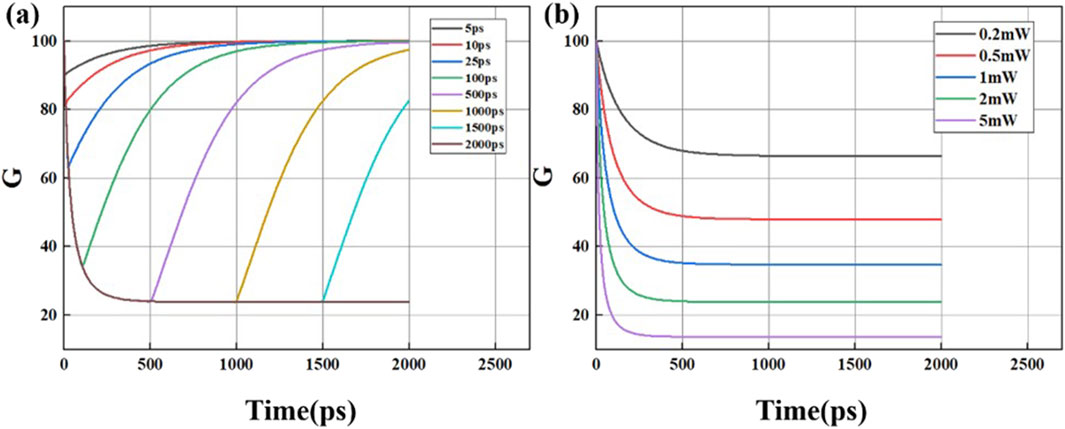
Figure 2. (a) Gain of SOA under different pulse widths, (b) gain of SOA under different pulse powers.
The power calculation is based on the steady-state solution when the pulse width reaches 2000 ps. Under steady-state conditions, the gain of the SOA can be considered to remain relatively constant over time. On this basis, we can perform a steady-state analysis by setting the gain variation rate dG/dt to zero. The dynamic Equation 3 can then be simplified as follows:
At this time, the dominant factor of the control pulse is P0. For small values of P0 the saturation term on the right side of the equation is small, which means G is close to G0 and the gain saturation is minimal. As P0 increases, the saturation term begins to dominate, causing the right side of the equation to become larger than the left side, forcing G to decrease significantly to maintain the equation’s balance. In extreme cases, where Pin(t) is sufficiently large such that the right side far exceeds the left side, G will approach zero, reflecting a state of complete gain saturation. By numerically solving Equation 5, we can obtain the gain curves for different pulse powers, as shown in Figure 2b.
The phase shift
where β is the linewidth enhancement factor, by solving Equation 5 for the gain corresponding to different control pulse powers, the resulting phase shifts can be obtained. as shown in Figure 3, for the modulation results of SOA on phase at different gains. By numerically solving Equations 5, 6, the range of phase shift variations within the adjustable range of the SOA can be determined.
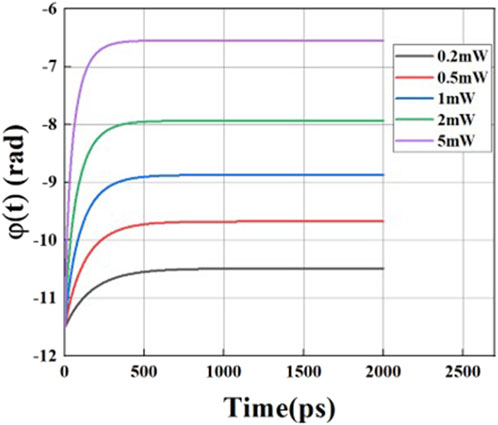
Figure 3. SOA phase modulation results at different gains.
Figure 4 illustrates the modulation process of the SOA. According to Equation 3, for the forward-propagating electric field Ecw, a modulation time of 2000 ps is required to achieve a gain coefficient G1 through the SOA, corresponding to an S1 fiber length of 0.4 m. Conversely, for the reverse-propagating electric field Eccw, a modulation time of 4000 ps is needed to attain a gain coefficient G2, resulting in an S2 fiber length of 0.8 m. This asymmetric placement of the SOA within the Sagnac interferometer ensures its integration with S1 and S2 at distinct positions. Based on the analysis of Equations 3–6, adjusting the injected pulse power enables dynamic tuning of the phase difference between clockwise and counter-clockwise propagating light, thereby enhancing the output intensities of the three optical paths.
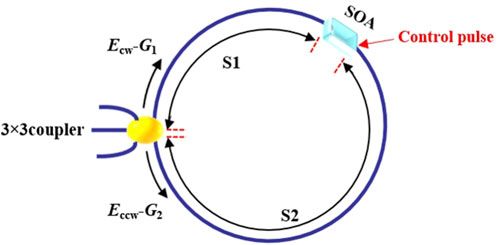
Figure 4. SOA modulation flow diagram.
The forward and reverse signals from the Sagnac interferometer are finally interfered with at the coupler to produce three ports of output Eout1, Eout2, Eout3, and the entire mathematical process of transmission is as follows As shown in Figure 5, the RBS light enters from one port, and is then output through the Sagnac interferometer in two ways as Ecw and Eccw, and then finally through the 3 × 3 coupler:
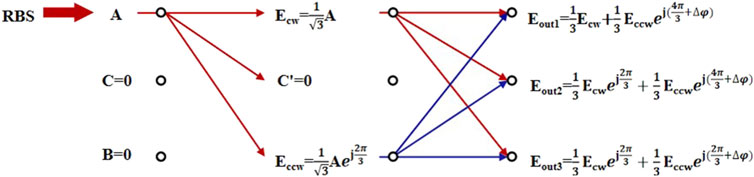
Figure 5. 3 × 3 coupler three-way optical phase transmission schematic.
where Δφ = φcw(t)-φccw(t) is the additional phase difference introduced by the SOA between the forward and reverse signals.
2.3 Phase demodulation principle
In this system, by adjusting G, we can actively control the phase difference Δφ, thereby regulating the optical power of the three outputs to avoid excessive noise interference. Equation 7 shows the three outputs of the system in that by changing the magnitude of Δφ, the intensity of the three outputs o can be changed.
According to Equation 7, the final optical intensity can be written as:
In Equation 8, where D is the average intensity of output light,
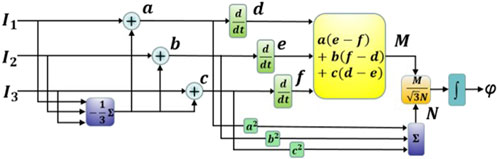
Figure 6. Flowchart of the DCM phase demodulation algorithm.
3 Simulation results
Due to the limitations in the current experimental conditions, we conducted research on this structure using theory and simulation. To validate the model’s capability for demodulating vibration events, a simulation was conducted with a 3 km-long fiber, setting the corresponding pulse repetition period, and sampling continuous RBS traces over multiple periods to simulate the system’s measurement of dynamic strain. The simulation is loaded with a standard sinusoidal waveform with a frequency of 100 Hz and a peak voltage of 1 V (where the phase vs voltage relationship is 3.5 rad/V), applied at the 2940 m position of the fiber.
3.1 Verification of dynamic strain measurements
To verify the accuracy of the model, Figure 7a, b present the demodulated phase spatiotemporal maps near the vibration location where the sensing fiber is wrapped. As observed, the demodulated time-domain waveform and spectrum are consistent with the original signal, indicating that the vibration signal has been accurately recovered.
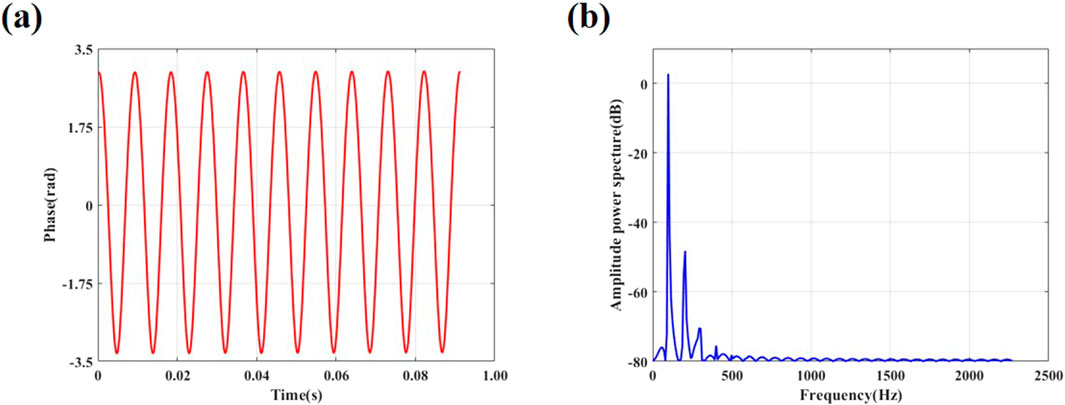
Figure 7. Demodulation results of simulated loaded 1V 100Hz signal: (a)Time Domain Demodulation Results, (b) Spectrum Demodulation Results.
3.2 Improvement of amplitude-frequency response range
Since the final demodulation accuracy is affected by the intensity of the three signals, it is important to ensure that the intensities of the three signals are as consistent as possible. This consistency can effectively improve the final demodulation results. By solving for the sum of the first norms of the intensity differences between the three signals, denoted as Idiv, and thus minimizing Equation 9, the optimum phase modulation points can be determined.
By solving the equation, four extremum points can be obtained: Δφ = 0, Δφ = π/3, Δφ = 2π/3, Δφ = π. The phase demodulation results at these extremum points are then calculated respectively.
To verify the beneficial effect of extremum points on demodulation performance, we compared the phase quality of demodulated signals by setting Δφ at extremum positions (0, π/3, 2π/3, π) and a non-extremum point (π/2). The quality of phase demodulation is evaluated using the normalized root mean square error (RMSE).
As shown in Equation 10, n is the number of discrete points involved in the calculation, Yi and yi are the discrete values of the original vibration signal and the demodulated signal, and A is the peak value of the original vibration signal.
The test protocol involved two scenarios: (1) applying a 100 Hz standard sine wave with peak voltages ranging from 1 V to 5 V to analyze voltage-dependent RMSE variations (Figure 8a); (2) fixing the voltage at 1 V while sweeping frequencies from 100 Hz to 900 Hz (200 Hz increments) to characterize frequency-dependent RMSE distributions (Figure 8b). As shown in Figure 8, the comparative analysis reveals that the three-channel output at the non-extremum point Δφ = π/2 yields a large RMSE, indicating severe distortion of the demodulated phase. In contrast, when the Δφ operates at extremum points, The RMSEs consistently remains below 0.4, indicating a better phase demodulation quality and amplitude-frequency response range compared to setting it at non-extreme points (π/2).
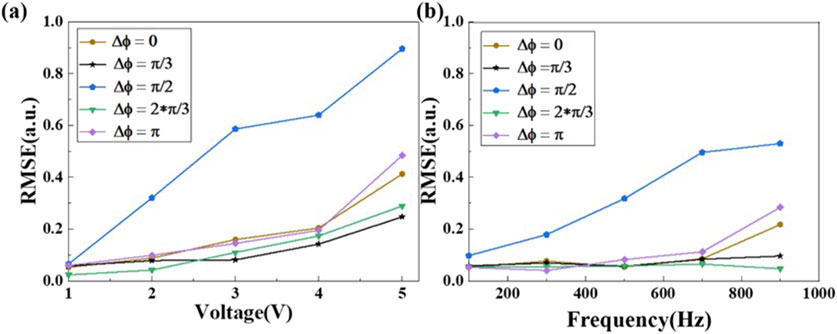
Figure 8. Simulation of RMSE results for sinusoidal signals with different voltages or frequencies: (a) RMSE results at different voltages, (b) RMSE results at different frequency.
In order to further validate the advantages of this system in terms of demodulation performance, simulations were conducted at an extremum point of Δφ = 2π/3, with a vibration frequency range of 100–900 Hz and amplitude variation range of 3.5–17.0 rad Figures 9a,b illustrate the RMSE distributions for the MI-based system and the proposed Sagnac/SOA system, respectively. As shown in Figure 9, the RMSE decreases with lower f and A, manifesting as blue regions in the lower-left contour plots. Conversely, the RMSE increases with higher f and A, transitioning the upper-right contour colors to yellow. By comparing Figures 9a,b, the blue region (low RMSE) of the Sagnac/SOA system is significantly larger than that of the MI-based system, indicating a broader amplitude-frequency response range and superior demodulation performance under the selected extremum condition. Additionally, according to Ref. [24], the amplitude-frequency response characteristic relationship among f, A, and the pulse repetition frequency fpulse is given by: 5.7f (A+1)≤fpulse.
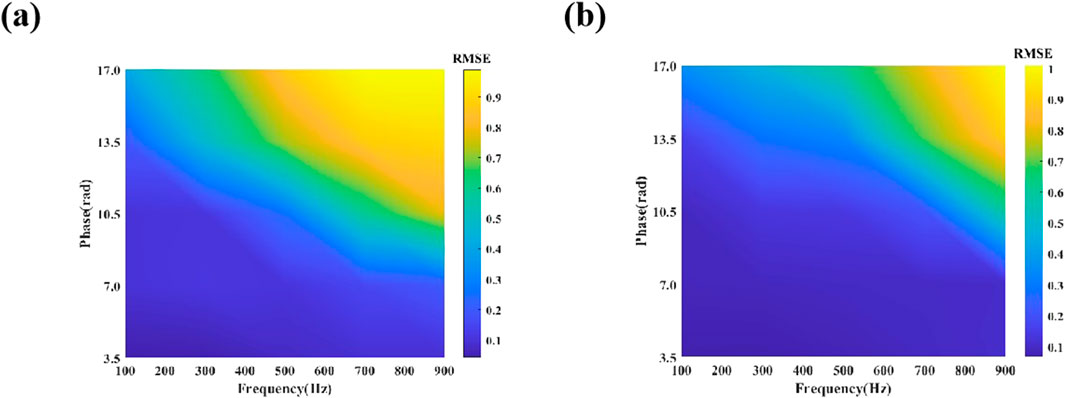
Figure 9. Simulation of RMSE results for different interferometer:(a)Michelson interferometer demodulation RMSE, (a)Sagnac interferometer demodulation RMSE.
3.3 Improvement of spatial resolution
During the signal demodulation process, the spatial resolution of the system will be broadened due to the arm length difference of the interferometer [19]. For the φ-OTDR system, the demodulation range is W + s, where W is the theoretical spatial resolution, which is only related to the pulse width. Here, s is the arm length difference of the interferometer.
The results of the spatial resolution comparison are shown in Figure 10, where Figures 10a,b are 2D views of the 3D demodulation maps of the φ-OTDR system using the MI interferometer, with the optimal setting of 10 m for the difference of the arm lengths, as described previously [18]. Figure 10a depicts the final signal demodulation results along the fiber axis from 2931 m to 2951 m, with a width of about 20 m. Figure 10b shows a two-dimensional view of the demodulation. Figures 10c,d are the demodulated outputs of the simulated system using the Sagnac interferometer, where Figure 10c shows the demodulated signal along the fiber axis from 2941 m to 2951 m with a width of about 10 m. The observed spatial resolution is consistent with the theoretical analysis. Figure 10d shows a two-dimensional view of the demodulation.
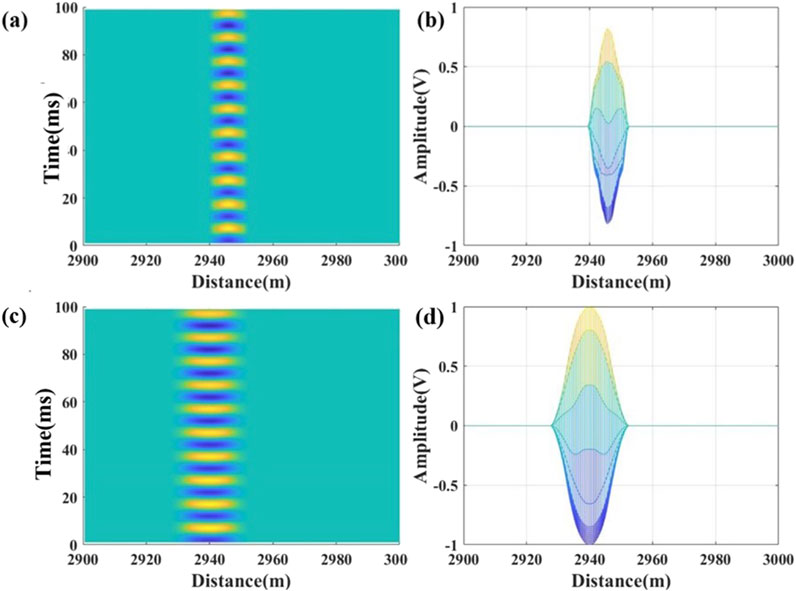
Figure 10. Spatial resolution comparison results: (a) Michelson interferometer demodulation results along the fiber axis, (b) 2D view of demodulation with Michelson interferometer, (c) Sagnac interferometer demodulation results along the fiber axis, (d) 2D view of demodulation with Sagnac interferometer.
By comparing the simulation results, it can be seen that the Saganc interferometer can effectively improve the spatial resolution and solve the shortcomings of the MI interferometer.
4 Discussions
During experimental measurements, the phase demodulation performance of the system also be affected by amplified spontaneous emission (ASE) noise introduced by the SOA, environmental interference noise, and common-mode noise induced by optical intensity fluctuations. When these noise sources are dominant, they could degrade simulation results. To eliminate the effects of the above noise, In the experiment, the ASE noise can be suppressed by embedding a 0.2 nm wavelength width filter in the SOA, the DCM algorithm is used to resist the environmental interference noise, and for the common-mode noise, it can be effectively eliminated due to the reciprocal of forward and reverse of the Sagnac interferometer. Therefore, through the above measures, it can be expected that the environmental sensitivity and noise resistance aspects of our proposed system will have a better performance in practical applications.
We introduced asymmetric 3 × 3 couplers (phase deviation ±5°, splitting ratio deviation ±5%), SOA insertion loss (3 dB), and a composite noise model (Gaussian white noise with zero mean and variance σ2 = 10–14; ASE noise power spectral density PASE = 1.2 × 10⁻¹⁰W/Hz) into the simulation validation. Additionally, random vibration noise within a 0–100 Hz frequency range was injected to simulate environmental disturbances. A standard single-frequency vibration signal (amplitude of 3.5 rad, frequency of 100 Hz) was then loaded for phase demodulation using the DCM algorithm. The results are shown in Figure 11.
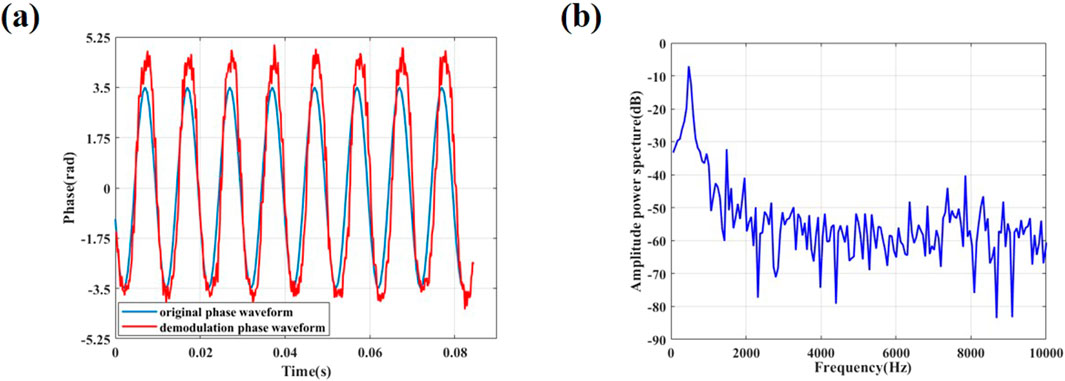
Figure 11. Simulated demodulation results for non-ideal conditions. (a) Time domain demodulation results, (b) Spectrum Demodulation Results.
Figure 11a compares the time domain waveforms between the original phase and the demodulated phase, demonstrating basic alignment between them with RMSE of 0.2068. Figure 11b presents the spectrum demodulation results, revealing a spectral SNR exceeding −7.06 dB at 100 Hz. These results confirm that the proposed system achieves robust noise resistance and effectively recovers the vibration signal waveform under realistic non-ideal conditions.
Regarding long-term stability, the system’s robustness is critically affected by temperature fluctuations and device aging in the SOA. Elevated temperatures reduce carrier density in the SOA, lowering both the gain saturation threshold and the achievable phase modulation range. This may prevent the system from reaching required phase extrema, degrading demodulation accuracy. Concurrently, ASE noise increases at higher temperatures, further degrading SNR. Device aging exacerbates these issues through gradual gain attenuation and response time drift. Prolonged operation reduces carrier density, mirroring gain degradation, and ultimately shrinking the phase modulation range. Additionally, stochastic variations in the SOA’s response time during extended use disrupt the consistency of phase differences across multiple sensing cycles, leading to demodulation failure. To alleviate these effects, thermoelectric cooling (TEC) can stabilize the SOA temperature within ±0.1°C, while software-based phase compensation algorithms dynamically adjust phase differences to maintain inter-cycle signal coherence.
Currently, there are also graphen optoelectronics-integrated [26, 27] and metasurfaces for optical phase modulators [28]. Although graphen optoelectronics-integrated modulators have the advantages of small size and low power consumption, this scheme requires extremely high fabrication accuracy and polarization-related absorption properties, resulting in high cost and polarization fading in long-term operation. The metasurfaces, on the other hand, focuses on mode-selective modulation in the field of photonic integrated circuits and CMOS, and is not able to realize vibration and phase demodulation in φ-OTDR systems. In contrast, the device proposed in this paper can realize low-cost phase modulation through SOA and perform measurement demodulation of external vibration. In the future, the integration of the above techniques with φ-OTDR can be explored to realize high-precision phase modulation and function extension.
5 Conclusion
We proposed a φ-OTDR system with a hybrid structure combining a 3 × 3 coupler and a Sagnac interferometer. Simulations were conducted to study the impact of SOA gain on the system and to compare the amplitude-frequency response characteristics under different gain conditions. Additionally, the system’s spatial resolution was compared to that of an MI interferometer. The results show that by using the saturated gain of the SOA to adjust the final output intensity of the three optical paths, the signal demodulation performance is improved when the intensities are closely matched and relatively high, resulting in an enhanced amplitude-frequency response range. Moreover, the Sagnac loop eliminates the degradation of spatial resolution caused by unbalanced arm lengths, thereby maintaining the original spatial resolution of the system.
Data availability statement
The original contributions presented in the study are included in the article/supplementary material, further inquiries can be directed to the corresponding author.
Author contributions
BY: Writing – original draft, Writing – review and editing, Data curation, Software. TW: Investigation, Methodology, Writing – review and editing. JZ: Funding acquisition, Resources, Supervision, Writing – review and editing. ZM: Investigation, Supervision, Writing – review and editing. XH: Writing – review and editing. LL: Writing – review and editing. YW: Writing – review and editing. MZ: Methodology, Project administration, Resources, Supervision, Writing – review and editing.
Funding
The author(s) declare that financial support was received for the research and/or publication of this article. This work was supported in part by the National Natural Science Foundation of China (NSFC) under Grants 62075153, 62075151, and 62205237, in part by the Shanxi Provincial Key Research and Development Project under Grant 202102150101004, in part by Shanxi Provincial Central Leading Local Science and Technology Development Fund YDZJSX20231A019, in part by the Shanxi Province Basic Research Program Jointly Funding Project (Lu An) 202403011241001 and Basic Research Program Jointly Funding Project (Traffic Control) 202303011222005, in part by the Shanxi Province Patent Conversion Special Plan 202405010.
Conflict of interest
The authors declare that the research was conducted in the absence of any commercial or financial relationships that could be construed as a potential conflict of interest.
Generative AI statement
The author(s) declare that no Generative AI was used in the creation of this manuscript.
Publisher’s note
All claims expressed in this article are solely those of the authors and do not necessarily represent those of their affiliated organizations, or those of the publisher, the editors and the reviewers. Any product that may be evaluated in this article, or claim that may be made by its manufacturer, is not guaranteed or endorsed by the publisher.
References
1. Walter F, Gräff D, Lindner F, Paitz P, Köpfli M, Chmiel M, et al. Distributed acoustic sensing of microseismic sources and wave propagation in glaciated terrain. Nat Commun (2020) 11(2436):2436. doi:10.1038/s41467-020-15824-6
2. Jousset P, Currenti G, Schwarz B, Chalari A, Tilmann F, Reinsch T, et al. Fibre optic distributed acoustic sensing of volcanic events. Nat Commun (2022) 13(1753):1753. doi:10.1038/s41467-022-29184-w
3. Lindsey NJ, Dawe TC, Ajo-Franklin JB. Illuminating seafloor faults and ocean dynamics with dark fiber distributed acoustic sensing. Science (2019) 366(6469):1103–7. doi:10.1126/science.aay5881
4. Juarez JC, Maier EW, Kyoo Nam Choi , Taylor H. Distributed fiber-optic intrusion sensor system. J Lightwave Technol (2005) 23(6):2081–7. doi:10.1109/jlt.2005.849924
5. Masoudi A, Belal M, Newson TP. A distributed optical fibre dynamic strain sensor based on phase-OTDR. Meas Sci Technol (2013) 24(8):085204. doi:10.1088/0957-0233/24/8/085204
6. Liu H, Pang F. True phase measurement of distributed vibration sensors based on heterodyne ϕ-OTDR. IEEE Photon J (2018) 10(1):7101309. doi:10.1109/JPHOT.2018.2791101
7. Pan Z, Liang K, Ye Q, Cai H, Qu R, Fang Z. Phase-sensitive OTDR system based on digital coherent detection. IEEE Asia Commun Photon Conf Exhib (2011) 1–6. doi:10.1117/12.905657
8. Wang Z, Zhang L, Wang S, Xue N, Peng F, Fan M, et al. Coherent Φ-OTDR based on I/Q demodulation and homodyne detection. Opt Express (2016) 24(2):853–8. doi:10.1364/oe.24.000853
9. Park J, Lee WK, Henry HF. Fiberoptic intrusion sensor with the configuration of an optical time-domain reflectometer using coherent interference of Rayleigh backscattering. In: Proc. SPIE 3555, optical and fiber optic sensor systems (1998). p. 49–56. doi:10.1117/12.318220
10. Fang G, Xu T, Feng S, Li F. Phase-sensitive optical time domain reflectometer based on phase-generated carrier algorithm. J Lightwave Technol (2015) 33(13):2811–6. doi:10.1109/jlt.2015.214416
11. Zhang A, Zhang S. High stability fiber-optics sensors with an improved PGC demodulation algorithm. IEEE Sens J (2016) 16(21):7681–4. doi:10.1109/jsen.2016.2604348
12. Muanenda Y, Faralli S, Oton CJ, Cheng C, Yang M, Di Pasquale F. Dynamic phase extraction in high-SNR DAS based on UWFBGs with-out phase unwrapping using scalable homodyne demodulation in direct detection. Opt Express (2019) 27(8):10644. doi:10.1364/oe.27.010644
13. Todd MD, Seaver M, Bucholtr E. Improved, operationally-passive interferometric demodulation method using 3x3 coupler. Electron Lett (2002) 38(15):784–5. doi:10.1049/el:20020569
14. Posey R, Johnson GA, Vohra ST. Strain sensing based on coherent Rayleigh scattering in an optical fibre. Electron Lett (2000) 36(20):1688–9. doi:10.1049/el:20001200
15. Zhang X, Sun Z, Shan Y, Li Y, Wang F, Zeng J, et al. A high performance distributed optical fiber sensor based on Φ-OTDR for dynamic strain measurement. IEEE Photon J (2017) 9(3):1. doi:10.1109/jphot.2017.2700020
16. Wang C, Wang C, Shang Y, Liu X, Peng G. Distributed acoustic mapping based on interferometry of phase optical time-domain reflectometry. Opt Commun (2015) 346:172–7. doi:10.1016/j.optcom.2015.02.044
17. Masoudi A, Newson TP. High spatial resolution distributed optical fiber dynamic strain sensor with enhanced frequency and strain resolution. Opt Lett (2017) 42(2):290–3. doi:10.1364/ol.42.000290
18. Wang C, Shang Y, Zhao W-A, Liu X-H, Wang C, Peng G-D. Investigation and comparison of φ-OTDR and OTDR-interferometry via phase demodulation. IEEE Sens J (2018) 18(4):1501–5. doi:10.1109/JSEN.2017.2785358
19. Shang Y, Yang Y, Wang C, Liu X, Wang C, Peng G. Optical fiber distributed acoustic sensing based on the self-interference of Rayleigh backscattering. Meas J Int Meas Confederation (2016) 79:222–7. doi:10.1016/j.measurement.2015.09.042
20. Agrawal GP, Olsson NA. Self-phase modulation and spectral broadening of optical pulses in semiconductor laser amplifiers. IEEE J Quan Electron. (1989) 25(11):2297–306. doi:10.1109/3.42059
21. Zoiros KE, Papadopoulos G, Houbavlis T, Kanellos G. Theoretical analysis and performance investigation of ultrafast all-optical Boolean XOR gate with semiconductor optical amplifier-assisted Sagnac interferometer. Opt Commun (2006) 258:114–34. doi:10.1016/j.optcom.2005.07.059
22. Eiselt W, Ludwig R, Weber HG. SLALOM: semiconductor laser amplifier in a loop mirror. J Lightwave Technol (1995) 13(10):2099–111. doi:10.1109/50.469721
23. Masoudi A, Newson TP. Analysis of distributed optical fibre acoustic sensors through numerical modelling. Opt Express (2017) 25(25):32021. doi:10.1364/oe.25.032021
24. Wang T, Zhang J, Ma, M Z. Comparison of amplitude-frequency response characteristics between DCM and Arctan algorithms in ϕ-OTDR. J Lightwave Technol (2023) 41(20):6608–14. doi:10.1109/JLT.2023.3285801
25. Fang G, Xu T, Feng S, Li F. Phase-sensitive optical time domain reflectometer based on phase-generated carrier algorithm. J Lightwave Technol 33(13):2811–6. doi:10.1109/jlt.2015.2414416
26. Meng Y, Hu F, Shen Y, Yang Y, Xiao Q, Fu X, et al. Ultracompact graphene-assisted tunable waveguide couplers with high directivity and mode selectivity. Sci Rep (2018) 8:13362. doi:10.1038/s41598-018-31555-7
27. Yuan M, Hu F, Liu Z, Xie P, Shen Y, Xiao Q, et al. Chip-integrated metasurface for versatile and multi-wavelength control of light couplings with independent phase and arbitrary polarization. Opt Express (2019) 27:16425–39. doi:10.1364/oe.27.016425
Keywords: distributed acoustic sensing, Sagnac interferometer, spatial resolution, amplitudefrequency response, phase demodulation
Citation: Yang B, Wang T, Zhang J, Ma Z, He X, Liu L, Wang Y and Zhang M (2025) Phase demodulation of hybrid 3×3 coupler and Sagnac interferometer for φ-OTDR. Front. Phys. 13:1609493. doi: 10.3389/fphy.2025.1609493
Received: 10 April 2025; Accepted: 23 June 2025;
Published: 08 July 2025.
Edited by:
Zhe Guang, Georgia Institute of Technology, United StatesReviewed by:
Yijie Shen, Nanyang Technological University, SingaporeAnwar Hussain, Islamabad Campus, Pakistan
Youchang Zhang, Advanced Micro Fabrication Equipment Corporation, China
Copyright © 2025 Yang, Wang, Zhang, Ma, He, Liu, Wang and Zhang. This is an open-access article distributed under the terms of the Creative Commons Attribution License (CC BY). The use, distribution or reproduction in other forums is permitted, provided the original author(s) and the copyright owner(s) are credited and that the original publication in this journal is cited, in accordance with accepted academic practice. No use, distribution or reproduction is permitted which does not comply with these terms.
*Correspondence: Tingyu Wang, dHl1dF90aW5neXV3YW5nQDE2My5jb20=