 Yuequn Fu
 Eirik Grude Flekkøy*
- PoreLab, The Njord Centre, Department of Physics, University of Oslo, Oslo, Norway
We study the cavitation bubble that forms as a nano-scale spherical surface is detached from a flat surface using molecular dynamics (MD) simulations. This investigation maps the onset and early development stages of cavitation at the nanoscale. We study the effects of variable pulling speeds and ambient pressures on the dynamics of the vapor bubble. It was observed that a higher pulling speed increases the cavitation volume but reduces the bubble’s lifetime. On the other hand, ambient pressure variations significantly influence both the maximum volume and the collapse rate of the cavitation. The results are summarized in a phase diagram that displays the effects of these varying pulling speeds and ambient pressures. Significantly, the study corroborates a Family-Vicsek scaling law for the bubble volume evolution.
1 Introduction
Cavitation [1–4] occurs in a widely different context. Biological examples include shrimp strikes [5], and technological examples may be found in ultrasonic cleaning [6] and pumps [7]. Cavitation may be caused by superheating a liquid beyond its boiling temperature or by reducing the liquid pressure below its saturated vapor pressure [8, 9]. The mechanisms are sometimes categorized as hydrodynamic cavitation [10–12], acoustic cavitation [13], and ultrasonic cavitation [14, 15]. Over the past decades, these phenomena have been explored extensively through numerous theoretical [16] and experimental studies [17–19], but mostly so in regimes where fluid inertia plays a main role [20, 21]. Our study focuses on the overdamped process where inertial forces are dominated by viscous and pressure forces and molecular dynamics is used in order to capture the nucleation event in addition to the subsequent hydrodynamics.
Classical nucleation theory (CNT) has traditionally been utilized for the prediction of nucleation rates [22, 23], which captures the qualitative features of the phenomenon, but falls short of making accurate quantitative predictions, although the inclusion of a curvature dependent surface tension has led to some progress [24]. The seminal work by De Luc [25] focused on superheated water, detailing a method using an oil bath to raise the water temperature to 122.5°C, while subsequent works have obtained even higher super-heating by use of various host liquids [26–28]. High stationary negative water pressures have also been obtained [29], while experimental studies utilizing laser-induced cavitation has been applied to further examine the evolution of these bubbles, demonstrating a phase of rebound and highlighting the thermodynamic influences on bubble size, nucleation rate, and lifetime [30].
The intricate morphology of cavitation bubbles has sparked significant interest across various academic disciplines [31]. This morphology is influenced by several factors, such as the molecular nature of the fluid, the ambient pressure, and temperature variations [20, 21], giving rise to a multitude of forms, including spherical, ellipsoidal, jetting, clustered, and vortex-induced shape variations [21]. Spherical cavitation bubbles are predominant in fluids with uniform pressure and within relatively quiescent environments [32]. In contrast, ellipsoidal cavitation bubbles emerge in non-uniform conditions, particularly in dynamic flow [33]. There are instances where multiple cavitation bubbles exhibit mutual attraction and assemble into chain-like configurations [33]. Throughout their lifecycles, cavitation bubbles undergo shape transformations, transitioning between spherical, oval, and other forms [30]. Moreover, observations reveal a symmetrical relationship between the growth and collapse phases of these bubbles. The collapse of cavitation bubbles can lead to various phenomena, including spherical implosions, jet formation, toroidal configurations, shockwave emissions, fragmentation, or the generation of secondary bubbles, often occurring either independently or in conjunction with one another [20, 21, 31].
Departing from the more common scenario where the bubble formation and collapse is dominated by inertial effects Combriat et al. [34] investigated how penny-shaped cavitation bubbles form and evolve when a spherical surface separates from a flat substrate under low Reynolds number conditions. Using a piezoelectric element to control the sphere-plate separation, they monitored surface separations at nanometer scales and recorded the bubble evolution with high-speed imaging, observing interface branching due to Saffman-Taylor instability and secondary nucleation at negative pressures ∼10 atm. Notably, they established a Family-Vicsek scaling law [35, 36] for the projected bubble area as a function of time, as shown in Equation 1.
where
The current study is devoted to the generation and analysis of a nanoscale cavitation bubble initiated by the withdrawal of a silica sphere from a silica base within the framework of molecular dynamics simulations. While Combriat et al. [34] relied on the Stokes equation to describe the evolution of a preexisting bubble in the limit where the pulled sphere had a much larger radius than the bubble, we extend this study by applying molecular dynamics to capture the nucleation event itself without the restriction of a scale separation between the bubble and sphere radius. In our case, the Reynolds number was calculated by the following Equation 2.
where
where
2 Models and methods
2.1 Atomistic modeling
Given the demands on extensive simulation time, a hybrid system that combines the mW (a coarse-grained model of water) [37, 38] and the crystal silica model [39] has been selected. The simulations resolve transient flow and bubble dynamics, which on a larger, coarse-grained scale would be described by the unsteady, compressible Navier-Stokes equations at low Reynolds number. This model encompasses three types of atoms: mW water molecules, silicon atoms, and oxygen atoms. The water model can simulate the transition from liquid water to vapor by means of a many-body potential, enabling precise calculations of nonbonding interactions, hydrogen bonding, and phase transitions [37]. The potential for crystalline silica is grounded in the Ab initio calculation of α-quartz, ensuring an accurate simulation of silica surfaces. This modeling approach provides a robust foundation for studying complex phase behaviors and surface interactions at the molecular level. Between water and silica, a Lennard-Jones potential [40] was chosen to capture the interaction with a cutoff distance of 9.0 Å, calculated by Equation 4.
Where
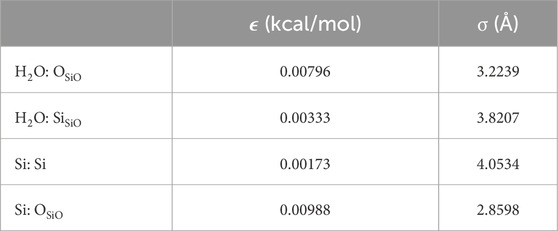
Table 1. The parameters in LJ potential between different atoms.
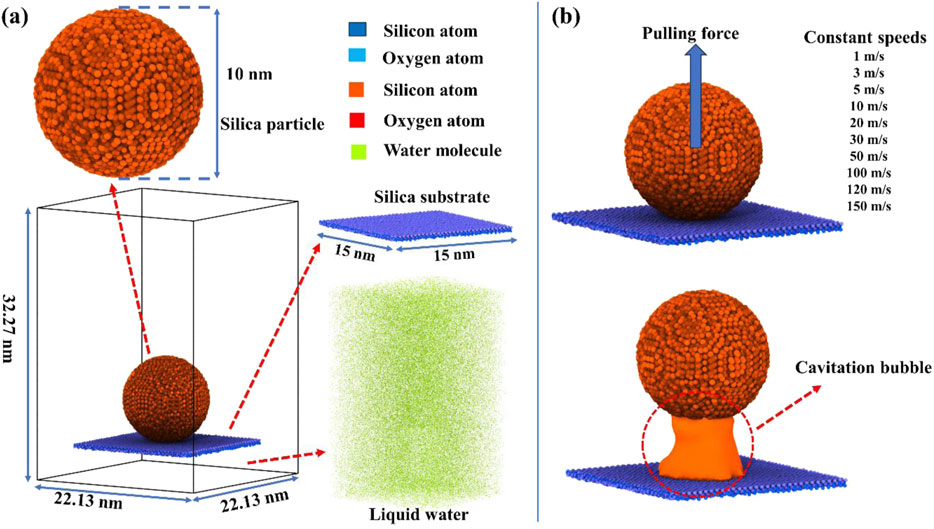
Figure 1. (a) Schematic of the simulation system, a rectangular box consisting of nano-silica particles, plane silica substrate, and liquid water. The whole simulation box is filled with water. (b) Schematic of the initial cavitation: An external force was applied to the silica sphere in order to set a fixed pulling speed by which the sphere was separated from the silica substrate, thus generating a cavitation bubble.
2.2 Molecular dynamics (MD) simulations methods
The Large-scale Atomic/Molecular Massively Parallel Simulator (LAMMPS) [41] was utilized for conducting the molecular dynamics simulations in this study. Prior to the simulations, the system underwent an energy minimization process using the steepest descent algorithm to ensure its stability. The molecular dynamics simulations were performed within both the NPT (constant number of particles, pressure, and temperature) and NVT (constant number of particles, volume, and temperature) ensembles. The system was maintained at a temperature of 300 K, regulated by the Nose–Hoover thermostat [42], and a pressure of 1 bar, controlled by the Parrinello–Rahman barostat [43]. The coupling constants for temperature and pressure were set to 1 ps and 10 ps, respectively, facilitating accurate and stable simulation conditions. The timestep for the simulation was 1 femtosecond (fs), allowing for precise tracking of the molecular dynamics over time.
To facilitate the pulling of the silica particle, counter-pulling forces were exerted on both the silica ball and the silica substrate. Specifically, harmonic springs were attached to the center of mass of the silica ball and then pulled away at a uniform velocity [44]. The silica substrate remained stationary at its original location throughout the process. The pulling forces applied to the silica sphere were a direct result of the stretching of these harmonic springs, which were configured with a uniform force constant of 400 kcal mol−1 Å−2 and a moving speed set at a constant speed. For the set of simulations where the variation of pulling speeds in the range from 1 m/s to 150 m/s, were explored, the pressure varied between 0.5 atm and 1,000 atm. The simulations were stopped once the cavitation bubble was fully dissipated. The volume of the cavitation bubble was determined by calculating the surface mesh [45]: Using a probe sphere radius of 3.5 Å points in the void were identified as those where the probe sphere centered in that point contained no atoms. For the visualization of these complex processes, the graphic rendering was accomplished using the software OVITO [46].
3 Results
Cavitation is initiated by applying an upwards external force to the silica ball that controls the given pulling speed at which the ball moves away from the silica substrate within an aqueous medium. This approach focuses on examining the morphology of cavitation bubbles and investigates the factors influencing their maximum volume and lifespan. In our case the cavitation is heterogeneous, always originating at solid surfaces.
3.1 Creating cavitation bubbles
The Reynolds number (Re) in this investigation is less than 1, implying a regime of creeping flow with pulling speeds ranging from 1 m/s to 150 m/s. Cavitation occurs at speeds exceeding 10 m/s, while lower speeds fail to produce bubbles. The separation creates a negative pressure zone at the detachment point due to viscous forces and the displacement of the surrounding water. This abrupt pressure reduction leads to the formation of a cavitation bubble. Once the bubble reaches its maximum volume it begins to collapse. During the collapse, there is a long, cylinder-shaped bubble that aligns with the pull direction. Eventually, it breaks up into a smaller bubble that forms onto the silica ball, whereas a larger one adheres to the flat substrate surface. The larger bubble eventually shrinks to zero on the substrate surface, and despite the continued movement of the silica ball, no subsequent bubbles are formed.
3.2 Morphology of cavitation bubbles
The morphology and volume evolution of the cavitation process is captured in Figure 2, with a more detailed dynamic progression available in the Supplementary Material (Cavitation-process.mp4). The dynamics are visualized using a surface mesh analysis and a graphic rendering technique. Initially, each cavitation bubble adopts a donut-like shape matching the radius of the silica particle, as illustrated in Figure 2. This torus shape is governed by the wetting properties of the surfaces and changes to a spherical topology as the ball leaves the surface. The process thus encompasses four distinct stages: the donut-like formation, cylindrical growth, and finally, collapse. Commencing with the donut-like formation, the external radius of the cavitation bubble is approximately 2.5 nm. The pressure differential thus induced leads to the formation and growth of the cavitation bubble into its cylindrical phase. During this phase, while the horizontal dimension of the bubble contracts, its longitudinal expansion continues until it reaches a peak volume of approximately 50 nm3. Beyond this growth phase, further pulling enhances only the longitudinal height, not the overall volume of the bubble. During the collapse phase, vapor condensation and compression shrinks the bubble into an hourglass shape as depicted in Figure 2d, and eventually splitting into two distinct bubbles (Figure 2e), with the top bubble being smaller and collapsing more rapidly than the larger bottom one. The final stage marks the disappearance of the last bubble, completing the cavitation process.
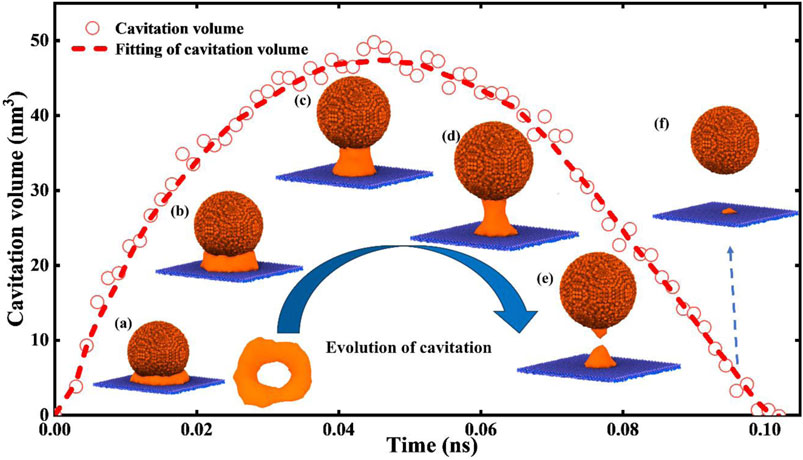
Figure 2. The relationship curve of pulling time with cavitation volume, (a–f): morphology of evolution of cavitation excited by pulling. The fitting curve is achieved by Savitzky-Golay filter [47, 48] for the purpose of smoothing a set of data.
3.3 Cavitation formation under various pulling speeds and ambient pressures
3.3.1 Pulling speed dependence
In an NVT ensemble, the application of a pulling force serves as the sole source of mechanical energy input, while the thermostat supplies thermal energy. The mechanical forces compress the surrounding water around the silica ball, facilitating the growth of a cavitation bubble that forms under negative pressure conditions locally.
Figure 3a Shows the volume of the cavitation bubbles with time when the ambient pressure P = 1 atm. Here, varying pulling speeds result in bubbles of different sizes and lifetimes; specifically, slower speeds tend to produce smaller bubbles with longer lifetimes, whereas faster speeds generate larger bubbles that have shorter lifetimes. Figure 3b shows a data collapse of the cavitation volumes and lifetime, using the data from Figure 3a normalizing the volume by its maximum value and the time by the lifetime. This relationship mirrors findings from both experimental and numerical studies of micron-scale cavitation bubbles [30]. The maximum volume Vm exhibits a direct, positive correlation with the velocity as
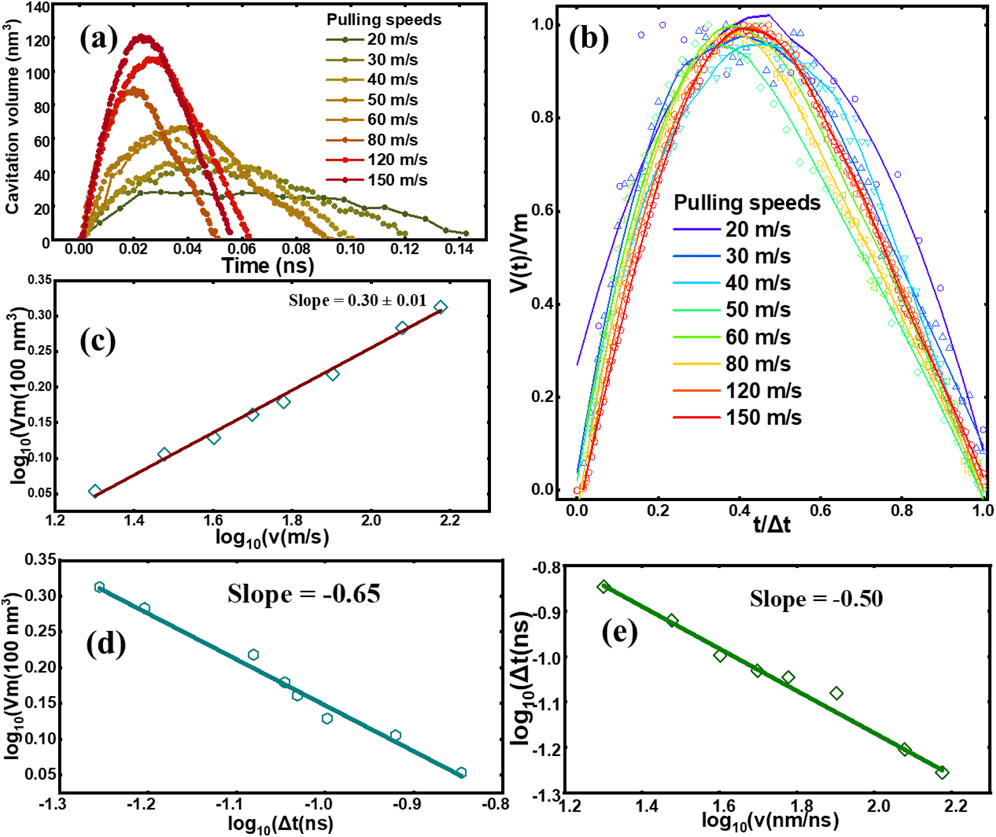
Figure 3. The maximum volume of cavitation bubble Vm versus v, the pulling speed. (a) Bubble volume versus time, (b) Collapse of the data (dots) and their fitting data (line) showing the bubble volume normalized by its maximum value versus time normalized by the lifetime, (c) Relationship between cavitation maximum volume and pulling speed, the hollow squares show the original data while the red line shows a linear fit. (d) Relationship between cavitation maximum volume and lifetime under constant pressure of 1 atm. (e) Corresponding to (d), the relationship between pulling speeds and lifetime. Due to molecular fluctuations the exact point at which the cavitation bubble will nucleate, will vary from one simulation to the next, and so there is a natural noise source in these curves.
3.3.2 Pressure dependence
Figure 4a explores the effects of the ambient pressure on the formation and collapse of cavitation bubbles. It is evident that the surrounding pressure is a critical factor in the dynamics of cavitation. In this regime the Reynolds number (Re) is still small. Under constant pulling speeds of 80 m/s, cavitation bubbles formed under higher pressures are noticeably smaller than those under lower pressures.
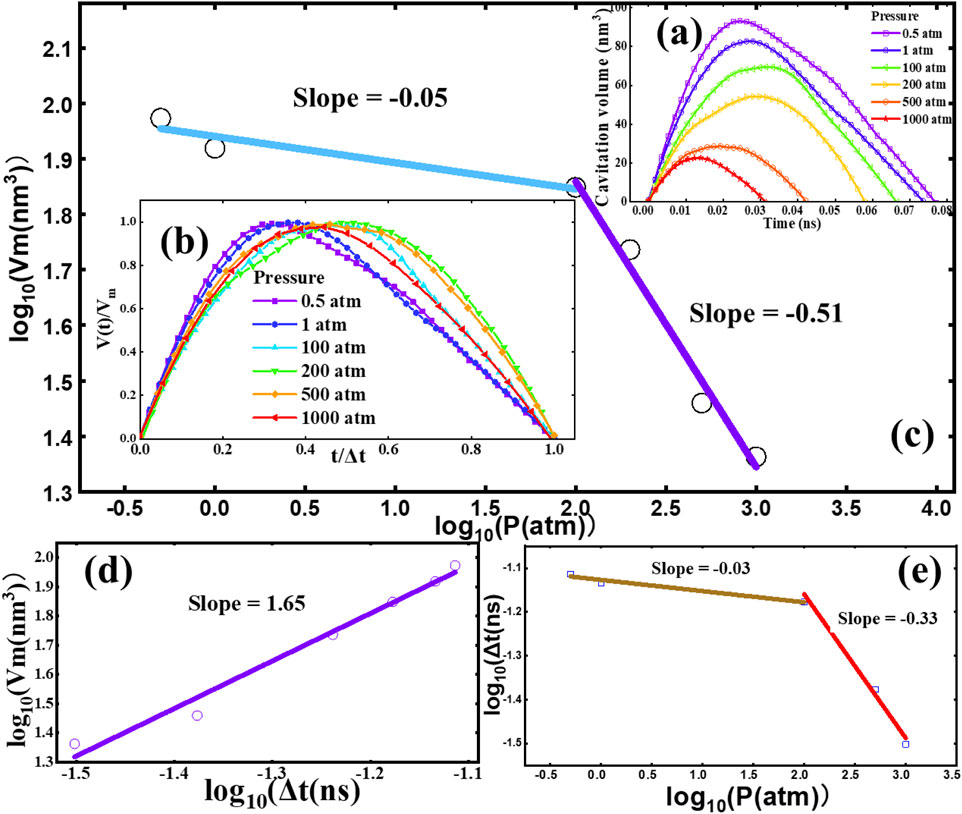
Figure 4. Vm is the maximum volume of cavitation bubble and P is the liquid pressure, at a constant pulling speed of 80 m/s. (a) Bubble volume variation with time, (b) Rescaling of simulated result (dots) for the bubble volume normalized by its maximum value versus time normalized by the bubble lifetime along with a fitted curve (using the Savitzky-Golay method) where the different colors stands for different pressures. (c) Relationship between the cavitation maximum volume and pressure. The hollow squares show original data while the lines are linear fitting result. (d) Relationship between cavitation maximum volume and lifetime under constant pulling speeds of 80 m/s. (e) Corresponding to (d), the relationship between the lifetime and pressure. Here again, hollow symbols show the original data while lines are the fitting results.
After data normalization, Figure 4b shows the results across varying pressures. These curves are also asymmetric, indicating that higher ambient pressures delay the achievement of maximum bubble volume within the bubble’s lifecycle, a departure from behaviors observed in microscale studies 32. Summarized in Figure 4c is the relationship between the ambient pressure and the maximum bubble volume, where the maximum volume Vm scales with pressure, approximately following
In order to explain this behavior, note that at a given pulling speed the system has an intrinsic pressure scale, which is the pressure variation around the ball that is created by its motion. An order of magnitude estimates of this pressure
3.3.3 Phase diagram
Figure 5 presents a parametric study designed to obtain the critical conditions necessary for cavitation, utilizing a range of pulling speeds and ambient pressure to explore the nucleation thresholds. This Figure shows how the pulling speeds ambient pressures controls the conditions for cavitation in addition to the interfacial tension [21]. In Figure 5, the colors and sizes of the depicted circles represent the relative volumes of the cavitation bubbles, providing a visual summary of how these variables combine to influence cavitation dynamics.
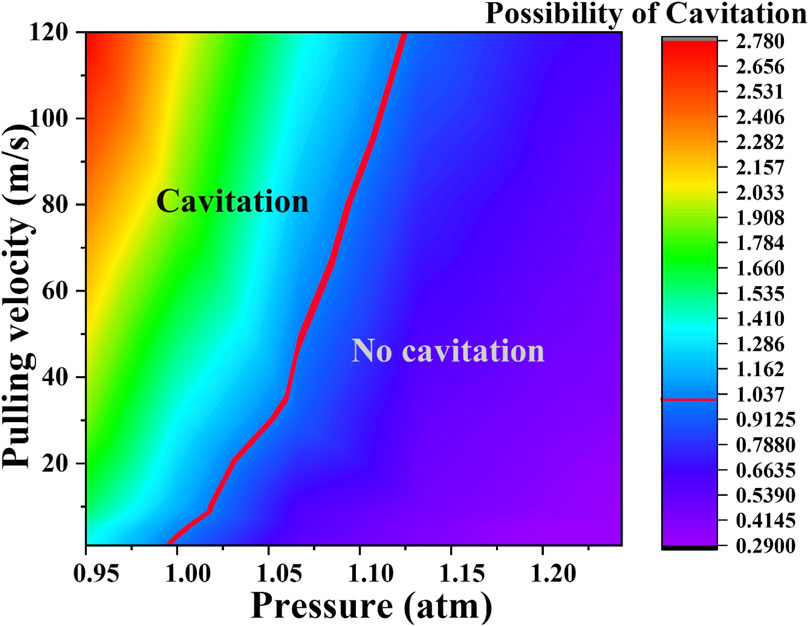
Figure 5. Phase diagram of cavitation under a series of pulling speeds and pressure. The possibility of cavitation is calculated from the maximum volume of void divided by the critical volume of the bubble that can be recognized as a cavitation bubble. The possibility of 1 or bigger means that cavitation can occur. The red line separates the region where this value is smaller/larger than unity, while the colors represent the relative size of the cavitation bubbles.
4 Discussion and conclusions
This study utilizes molecular dynamics (MD) simulations to model the nucleation and development of cavitation bubbles caused by the separation of a silica sphere from a flat silica substrate. The simulations trace the early growth stages of these cavitation bubbles, identifying four distinct evolutionary phases characterized by their morphologies. To systematically explore the effects of mechanical and thermodynamic variables on cavitation dynamics, the simulations vary both the pulling speeds and the ambient pressures. The study particularly focuses on quantifying the maximum volumes attained by the bubbles and their lifespans under different conditions. The findings reveal that nanoscale cavitation dynamics satisfy a Family-Vicsek scaling law for the case where the pressure is kept constant, and the pulling speed varies. Higher pulling speeds lead to larger maximum volumes of cavitation bubbles; however, these increased volumes do not correlate with longer bubble lifespans. Instead, the lifespan of a bubble under high pulling speeds has a faster growth and collapse cycle, and consequently, larger bubbles have shorter lifetimes, contrasting with inertial bubble dynamics.
The data collapse in Figure 3b, which supports the interpretation in terms of a Family-Vicsek scaling law is a key result of this paper. The fact that the collapse is not perfect, is likely to have two reasons: noise and limited pulling speeds. The noise sources include discretization effects in the measurement of the bubble volumes and thermal noise: The exact pressures at which nucleation happens is governed by thermal fluctuations which will cause different bubbles to nucleate at somewhat different times, and so their subsequent hydrodynamic evolution will have slightly different initial conditions. The effect of pulling speeds is studied in detail by Combriat et al. [34], where the Stokes equation is applied to predict a data collapse which is similar to the one shown in Figure 3b (only replacing the maximum volume by the maximum projected horizontal area) under the condition that the pulling speed is large enough. So, in the present context we would expect the collapse to improve within the noise as the speed is increased. This is indeed observed by inspection of the red lines in Figure 3b, which come close to falling on top of each other. There is no detectable crossover behavior at the higher velocities in Figures 3b–e. This indicates that the cavitation process and bubble evolution is not strongly affected by inertial effects.
In contrast to the results shown in Figure 3, the results of Figure 4 where we are varying the ambient pressure, keeping the pulling speed fixed, the lifetime increases as the maximum volume increases.
The data presented in Figures 3, 4, may serve as a foundational reference for further experimental and theoretical studies of cavitation processes, potentially leading to the development of predictive models that can accurately forecast cavitation behavior under a variety of conditions. A potential application being to optimizing the operational parameters for systems susceptible to cavitation damage. Our results are also used to create a phase diagram that delineates the conditions under which cavitation is induced through pulling. Stochastic nucleation events, driven by thermal fluctuations, introduce variability in bubble initiation times. Limited statistical sampling may obscure subtle pressure-dependent thresholds. The idealized sphere-plate geometry neglects real-world complexities, such as surface roughness or asymmetric geometries, which could alter bubble morphology and stability. Recent studies indicate that first order phase transitions, such as the liquid-vapor transition, are significantly affected when they occur in systems that are maintained away from equilibrium [49]. By contrast, our initial states are always in equilibrium, and they have fixed wettability conditions. As the wettability affects the size of the nucleation barriers, systematically changing the water-solid interactions energies would amount to an interesting extension of the present study. This has been done in larger scale simulations on the mesoscopic level using fluctuating hydrodynamics [50, 51]. Future work should integrate multiscale simulations, experimental validation, and explorations of complex geometries to unravel the interplay between interfacial properties, thermal fluctuations, and hydrodynamic forces. Such efforts will deepen insights into nanoscale mechanical stability and guide the design of cavitation-resistant materials.
We finally note that at the nanoscale, establishing a definitive critical point for the transition between cavitation and non-cavitation is challenging due to the formation of small cavitation bubbles, even under conditions of relatively high pressure and low pulling velocity. The reason for this is that the wetting property that is set by the water-silica interaction, makes tiny bubbles at the point of closest contact, energetically favorable even when the system is in equilibrium. This observation separates the current bubbles from those that are commonly reported in studies at other scales [21, 31], suggesting scale-dependent differences in the nucleation process. Our approach provides insight into the mechanical stability of nano-scale systems.
Data availability statement
The original contributions presented in the study are included in the article/Supplementary Material, further inquiries can be directed to the corresponding author.
Author contributions
YF: Investigation, Funding acquisition, Supervision, Resources, Writing – review and editing, Software, Conceptualization, Writing – original draft, Project administration, Formal Analysis, Data curation, Methodology, Visualization, Validation. EF: Validation, Project administration, Visualization, Data curation, Formal Analysis, Methodology, Supervision, Writing – review and editing, Funding acquisition, Writing – original draft, Conceptualization, Software, Investigation, Resources.
Funding
The author(s) declare that financial support was received for the research and/or publication of this article. This work is financially supported by the Research Council of Norway (Grant No. 262644). The supercomputer CPU hours were provided by the Norwegian Metacenter for Computational science (Project ID: NN8108K).
Conflict of interest
The authors declare that the research was conducted in the absence of any commercial or financial relationships that could be construed as a potential conflict of interest.
Generative AI statement
The author(s) declare that no Generative AI was used in the creation of this manuscript.
Publisher’s note
All claims expressed in this article are solely those of the authors and do not necessarily represent those of their affiliated organizations, or those of the publisher, the editors and the reviewers. Any product that may be evaluated in this article, or claim that may be made by its manufacturer, is not guaranteed or endorsed by the publisher.
Supplementary material
The Supplementary Material for this article can be found online at: https://www.frontiersin.org/articles/10.3389/fphy.2025.1614785/full#supplementary-material
References
1. Giove F, Gili T, Lambert SA, Kamimura HAS, Conti A, Toschi N, et al. Ultrasound neuromodulation: mechanisms and the potential of multimodal stimulation for neuronal function assessment ultrasound neuromodulation: mechanisms and the potential of multimodal stimulation for neuronal function assessment. Front Phys (2020) 1:150. doi:10.3389/fphy.2020.00150
2. Bossert M, Trimaille I, Cagnon L, Chabaud B, Gueneau C, Spathis P, et al. Surface tension of cavitation bubbles. Proc Natl Acad Sci U S A (2023) 120:e2300499120. doi:10.1073/pnas.2300499120
3. Doebele V, Benoit-Gonin A, Souris F, Cagnon L, Spathis P, Wolf PE, et al. Direct observation of homogeneous cavitation in nanopores. Phys Rev Lett (2020) 125:255701. doi:10.1103/PHYSREVLETT.125.255701
4. Pouliopoulos AN, Jimenez DA, Frank A, Robertson A, Zhang L, Kline-Schoder AR, et al. Temporal stability of lipid-shelled microbubbles during acoustically-mediated blood-brain barrier opening. Front Phys (2020) 8:137. doi:10.3389/fphy.2020.00137
5. Patek SN, Caldwell RL. Extreme impact and cavitation forces of a biological hammer: strike forces of the peacock mantis shrimp Odontodactylus scyllarus. J Exp Biol (2005) 208:3655–64. doi:10.1242/JEB.01831
6. Yusof NSM, Babgi B, Alghamdi Y, Aksu M, Madhavan J, Ashokkumar M. Physical and chemical effects of acoustic cavitation in selected ultrasonic cleaning applications. Ultrason Sonochem (2016) 29:568–76. doi:10.1016/J.ULTSONCH.2015.06.013
7. Binama M, Muhirwa A, Bisengimana E. Cavitation effects in centrifugal pumps-A review. J Eng Res Appl (2016) 6:52–63.
9. Caupin F, Herbert E. Cavitation in water: a review. C R Phys (2006) 7:1000–17. doi:10.1016/J.CRHY.2006.10.015
10. Riesz P, Berdahl D, Christman CL. Free radical generation by ultrasound in aqueous and nonaqueous solutions. Environ Health Perspect (1985) 64:233–52. doi:10.1289/EHP.8564233
11. Gevari MT, Abbasiasl T, Niazi S, Ghorbani M, Koşar A. Direct and indirect thermal applications of hydrodynamic and acoustic cavitation: a review. Appl Therm Eng (2020) 171:115065. doi:10.1016/J.APPLTHERMALENG.2020.115065
12. Gevari MT, Shafaghi AH, Villanueva LG, Ghorbani M, Koşar A. Engineered lateral roughness element implementation and working fluid alteration to intensify hydrodynamic cavitating flows on a chip for energy harvesting. Micromachines (2020) 11:49. doi:10.3390/MI11010049
14. Shchukin DG, Skorb E, Shchukin DG, Skorb E, Belova V, Möhwald H, et al. Ultrasonic cavitation at solid surfaces. Adv Mater (2011) 23:1922–34. doi:10.1002/ADMA.201004494
15. Du J, Chen F. Cavitation dynamics and flow aggressiveness in ultrasonic cavitation erosion. Int J Mech Sci (2021) 204:106545. doi:10.1016/J.IJMECSCI.2021.106545
16. Block BJ, Das SK, Oettel M, Virnau P, Binder K. Curvature dependence of surface free energy of liquid drops and bubbles: a simulation study. J Chem Phys (2010) 133:154702. doi:10.1063/1.3493464
17. Bai L, Yan J, Zeng Z, Ma Y. Cavitation in thin liquid layer: a review. Ultrason Sonochem (2020) 66:105092. doi:10.1016/J.ULTSONCH.2020.105092
18. Arvengas A, Herbert E, Cersoy S, Davitt K, Caupin F. Cavitation in heavy water and other liquids. J Phys Chem B (2011) 115:14240–5. doi:10.1021/jp2050977
19. Sreedhar BK, Albert SK, Pandit AB. Cavitation damage: theory and measurements – a review. Wear (2017) 372–373:177–96. doi:10.1016/J.WEAR.2016.12.009
21. Brennen CE. Cavitation and bubble dynamics. Cambridge University Press (2014). Available online at: https://books.google.com.hk/books?hl=en&lr=&id=yRhaAQAAQBAJ&oi=fnd&pg=PR11&dq=Brennen+CE.+Cavitation+and+bubble+dynamics.&ots=O9uKCNqejZ&sig=_ptXXt6EpXnif77hTLaYJz_0XbM&redir_esc=y#v=onepage&q=Brennen%20CE.%20Cavitation%20and%20bubble%20dynamics.&f=false
22. Bai J, Shi Z, Jia S, Li Y, Peng P, Xu D, et al. Homogeneous nucleation: theory and experiment. J Phys Condensed Matter (1992) 4:7627–50. doi:10.1088/0953-8984/4/38/001
24. Menzl G, Gonzalez MA, Geiger P, Caupin F, Abascal JLF, Valeriani C, et al. Molecular mechanism for cavitation in water under tension. Proc Natl Acad Sci U S A (2016) 113:13582–7. doi:10.1073/pnas.1608421113
25. Google Books (2023) Introduction à la physique terrestre par les fluides expansibles. Précédée - Jean André de Luc (the Elder.). Available online at: https://books.google.no/books?hl=en&lr=&id=kWuPRkCqzsYC&oi=fnd&pg=PA1&dq=J.-A.+De+Luc,+Introduction+à+la+physique+terrestre+par+les+fluides+expansibles,+Paris,+1803,+p.+93&ots=Eu9gUfftT4&sig=_pAIb7j8Gu3IRwkoesD6inJKYS0&redir_esc=y#v=onepage&q&f=false. [Accessed December 10, 2023].
26. Google Books (2023) Sur l’ébullition des liquides - Louis Dufour. Available online at: https://books.google.no/books?hl=en&lr=&id=joKgTuIkRskC&oi=fnd&ots=w18E_Wb7YF&sig=j_SHsiyrXPDvMBzY2Q2frlkFEWg&redir_esc=y. [Accessed December 10, 2023].
27. Apfel RE. Vapor nucleation at a liquid–liquid interface. J Chem Phys (1971) 54:62–3. doi:10.1063/1.1674639
28. Apfel RE. Water superheated to 279.5°C at atmospheric pressure. Nat Phys Sci (1972) 238(82):63–4. doi:10.1038/physci238063a0
29. Kell GS. Early observations of negative pressures in liquids. Am J Phys (1983) 51:1038–41. doi:10.1119/1.13353
30. Phan TH, Kadivar E, Nguyen VT, El Moctar O, Park WG. Thermodynamic effects on single cavitation bubble dynamics under various ambient temperature conditions. Phys Fluids (2022) 34:23318. doi:10.1063/5.0076913
32. Mancas SC, Rosu HC. Evolution of spherical cavitation bubbles: parametric and closed-form solutions. Phys Fluids (2016) 28:22009. doi:10.1063/1.4942237
33. Choi J, Ceccio SL. Dynamics and noise emission of vortex cavitation bubbles. J Fluid Mech (2007) 575:1–26. doi:10.1017/S0022112006003776
34. Combriat T, Dysthe DK, Flekkoy EG. Cavitation dynamics in creeping flow. J Fluid Mech (2024) 999:A19. doi:10.1017/JFM.2024.937
35. Family F, Vicsek T. Scaling of the active zone in the Eden process on percolation networks and the ballistic deposition model. J Phys A Math Gen (1985) 18:L75–81. doi:10.1088/0305-4470/18/2/005
36. Vicsek T, Family F. Dynamic scaling for aggregation of clusters. Phys Rev Lett (1984) 52:1669–72. doi:10.1103/PhysRevLett.52.1669
37. Stillinger FH, Weber TA. Computer simulation of local order in condensed phases of silicon. Phys Rev B (1985) 31:5262–71. doi:10.1103/PhysRevB.31.5262
38. Fu Y, Xiao S, Liu S, Chang Y, Ma R, Zhang Z, et al. Atomistic insights into the droplet size evolution during self-microemulsification. Langmuir (2022) 38:3129–38. doi:10.1021/acs.langmuir.1c03099
39. Munetoh S, Motooka T, Moriguchi K, Shintani A. Interatomic potential for Si–O systems using Tersoff parameterization. Comput Mater Sci (2007) 39:334–9. doi:10.1016/J.COMMATSCI.2006.06.010
40. Lenhard J, Stephan S, Hasse H. On the history of the Lennard-Jones potential. Ann Phys (2024) 536:2400115. doi:10.1002/ANDP.202400115
41. Plimpton S, Hendrickson B. Parallel molecular dynamics algorithms for simulation of molecular systems (1995).
42. Martyna GJ, Tobias DJ, Klein ML. Constant pressure molecular dynamics algorithms. J Chem Phys (1994) 101:4177–89. doi:10.1063/1.467468
43. Parrinello M, Rahman A. Polymorphic transitions in single crystals: a new molecular dynamics method. J Appl Phys (1981) 52:7182–90. doi:10.1063/1.328693
44. Fu Y, Xiao S, Liu S, Wu J, Wang X, Qiao L, et al. Stability, deformation and rupture of Janus oligomer enabled self-emulsifying water-in-oil microemulsion droplets †. Phys Chem Chem Phys (2020) 22:24907–16. doi:10.1039/d0cp03092a
45. Stukowski A. Computational analysis methods in atomistic modeling of crystals. JOM (2014) 66:399–407. doi:10.1007/s11837-013-0827-5
46. And M, In S. Visualization and analysis of atomistic simulation data with OVITO–the Open Visualization Tool. Model Simul Mat Sci Eng (2009) 18:015012. doi:10.1088/0965-0393/18/1/015012
48. Savitzky A, Golay MJE. Smoothing and differentiation of data by simplified least squares procedures. Anal Chem (1964) 36:1627–39. doi:10.1021/ac60214a047
49. Zakine R, Vanden-Eijnden E. Minimum-action method for nonequilibrium phase transitions. Phys Rev X (2023) 13:041044. doi:10.1103/physrevx.13.041044
50. Gallo M, Casciola CM. Vapor bubble nucleation in flowing liquids. Int J Multiphase Flow (2024) 179:104924. doi:10.1016/J.IJMULTIPHASEFLOW.2024.104924
Keywords: cavitation, nucleation theory, nanobubble, lifetime, molecular dynamics
Citation: Fu Y and Flekkøy EG (2025) Molecular simulations of cavitation bubble dynamics. Front. Phys. 13:1614785. doi: 10.3389/fphy.2025.1614785
Received: 19 April 2025; Accepted: 30 June 2025;
Published: 17 July 2025.
Edited by:
Chengyu Li, Case Western Reserve University, United StatesReviewed by:
Mirko Gallo, Sapienza University of Rome, ItalyZhipeng Lou, Case Western Reserve University, United States
Copyright © 2025 Fu and Flekkøy. This is an open-access article distributed under the terms of the Creative Commons Attribution License (CC BY). The use, distribution or reproduction in other forums is permitted, provided the original author(s) and the copyright owner(s) are credited and that the original publication in this journal is cited, in accordance with accepted academic practice. No use, distribution or reproduction is permitted which does not comply with these terms.
*Correspondence: Eirik Grude Flekkøy, ZS5nLmZsZWtrb3lAZnlzLnVpby5ubw==