 Chunhua Ren
 Changyuan Wang
 Yang Yu2
- 1Yibin University, School of Computer Science and Technology, Yibin, China
- 2Southwest Petroleum University, School of Computer and Software, Chengdu, China
Network security is the core guarantee for the stable operation of Cyber-Physical-Social Systems (CPSS), and intrusion detection technology, as a key link in network security, is crucial to ensuring the security and reliability of CPSS. The application of traditional clustering algorithms in intrusion detection usually relies on a preset number of clusters. However, network intrusion data is highly random and dynamic, and the number and distribution structure of clusters are often difficult to determine in advance, resulting in limited detection accuracy and adaptability. To tackle this issue, this paper introduces a density peak clustering algorithm, RMKNN-FDPC, which integrates relative mutual K-nearest neighbor local density with a fuzzy allocation strategy for network intrusion detection, aiming to enhance the capability of identifying unknown attack patterns. Firstly, in the stage of local density calculation, the relative mutual K-nearest neighbor method is used instead of the traditional truncation distance method to more accurately characterize the local density distribution by considering the mutual neighborhood relationship between data points. Secondly, in the remaining point allocation stage, the fuzzy allocation strategy of the mutual K-nearest neighbor effectively avoids the error propagation problem caused by chain allocation in traditional density peaks clustering algorithm (DPC). Finally, a large number of experiments were conducted, including KDD-CUP-1999 experiments, synthetic dataset experiments, real dataset experiments, face dataset experiments, parameter analysis experiments, and run time analysis experiments. The experimental results show that the proposed method performs exceptionally well in the clustering task and can effectively mine network intrusion information.
1 Introduction
CPSS integrate computing, physical devices, and human interactions, presenting unique challenges for network intrusion detection due to their complex interdependencies and dynamic nature [1]. Traditional intrusion detection methods often struggle to interpret the high-dimensional and sequential data of CPSS, urgently requiring advanced artificial intelligence-driven approaches to detect network anomalies [2].
Clustering algorithms play a pivotal role in network intrusion detection by autonomously identifying hidden attack patterns from unlabeled traffic data, enabling efficient anomaly detection without prior knowledge of attack signatures [3]. Clustering algorithms aim to divide a dataset into clusters with similar features [4], and is widely applied in fields such as data mining [5], fraud detection [6], and image processing [7]. Traditional clustering algorithms (such as K-means and hierarchical clustering) perform well on simple datasets but often struggle to achieve satisfactory results when dealing with complex structures, such as non-spherical clusters, multi-density clusters, or noisy data. While traditional clustering methods face challenges in handling high-dimensional and imbalanced intrusion data, recent advances in density-based and deep clustering techniques offer promising solutions to improve detection accuracy and adaptability in dynamic network environments [8].
In recent years, the density peaks clustering algorithm (DPC) has attracted significant attention due to its ability to automatically identify cluster centers and handle clusters of arbitrary shapes [9]. DPC achieves efficient clustering by calculating the local density and relative distance of data points and selecting points with high density and long distance as cluster centers [10]. The DPC algorithm requires only one parameter and can obtain clusters of any shape. It can also handle noisy data and has great application prospects in network intrusion detection. However, DPC still has some limitations when dealing with high-dimensional data or manifold data. For instance, the calculation of local density relies on the truncation distance parameter, which is sensitive to the parameter selection. Meanwhile, the traditional DPC algorithm may cause a “domino effect” when allocating non-central points, leading to the error propagation.
To address these issues, researchers have proposed various improvement methods, such as optimizing the calculation of local density and enhancing the allocation method for the non-central points [11,12].
In terms of local density calculation, the density peaks clustering based on K-nearest neighbor (DPC-KNN) is an important early achievement [13]. This algorithm redefines a new local density through the K-nearest neighbor method, fully considering the distribution differences among data points, thereby effectively avoiding the difficulty in choosing the truncation distance parameter in the traditional DPC algorithm. Compared with DPC, DPC-KNN has improved clustering performance, but it still struggles to accurately obtain the true cluster centers when dealing with datasets with uneven density distributions. In 2016, Xie proposed the classic fuzzy weighted K-nearest neighbor density peak clustering algorithm (FKNN-DPC) [14], which combines the K-nearest neighbor method with fuzzy set theory to design a new way of calculating local density. In the same year, Liu proposed the shared-nearest-neighbor-based clustering by fast search and find of density peaks (SNN-DPC) [15], which redefines local density based on the concepts of nearest neighbor and shared nearest neighbor and can better adapt to the local environment of sample points. However, both of these algorithms require the use of a fixed K-nearest neighbor parameter during the clustering process, which to some extent limits their adaptability to complex datasets. Additionally, numerous derivative algorithms have also focused on optimizing local density. For instance, the comparative density peaks clustering algorithm (CDP) improves using a comparative density method [16]. Subsequent enhancements to the DPC algorithm framework have incorporated various technical approaches. These include the residual error-based density peak clustering algorithm (REDPC) [17], the density peaks clustering algorithm based on fuzzy and weighted shared neighbor (DPC-FWSN) [18], the standard deviation weighted distance based density peak clustering algorithm (SFKNN-DPC) [19], and the adaptive nearest neighbor density clustering algorithm (ANN-DPC) [20]. These algorithms improve local density through different methods, but all are calculated using absolute density.
In handling the distribution of remaining points, the FKNN-DPC algorithm adopts a two-stage strategy to improve accuracy [14]. However, this strategy adopts a fixed k-value in each distribution, failing to fully consider the local distribution characteristics of sample points. To address the issue of density imbalance in the datasets, the relative density-based clustering algorithm for identifying diverse density clusters (IDDC) was proposed [21]. This algorithm looks for unallocated points from the perspective of clustering and designs a new distribution strategy, but it requires manual specification of two parameters. Based on FKNN-DPC, Xie further proposed the SFKNN-DPC algorithm [19]. This algorithm takes into account the contribution of each feature to the distance between data points and designs a divide-and-conquer distribution strategy, thereby achieving better robustness. To address the problem that DPC cannot find the clustering centers of sparse clusters, ANN-DPC was proposed [20]. This algorithm adopts an adaptive nearest neighbor algorithm and combines breadth-first search and fuzzy weighted adaptive nearest neighbor algorithm to design a new distribution strategy. Although ANN-DPC performs well in terms of performance, it still requires the pre-specification of the number of clusters. In addition, Zhu proposed a density peak clustering algorithm based on shared proximity and probability allocation (SP-DPC) [22], which utilizes the transfer probability allocation strategy and evidence probability allocation strategy to jointly optimize the distribution of remaining data points. However, the parameter k of this algorithm still needs to be specified manually.
To further improve the limitations of the DPC algorithm and enhance the accuracy of intrusion detection. This paper proposes a density peak clustering algorithm integrating relative mutual K-nearest neighbor local density and fuzzy allocation strategy (RMKNN-FDPC). The main contributions of this algorithm are as follows:
This paper presents an original framework aimed at advancing density peak clustering methodologies and lays a theoretical foundation for their promotion in intrusion detection applications. This study is organized as follows: Section 2 provides a comprehensive analysis of the traditional DPC algorithm. Section 3 presents in detail the proposed algorithm. Experimental results and corresponding analyses are discussed in Section 4. The paper concludes with a discussion of its contributions in Section 5, followed by recommendations for further exploration in this research domain.
2 Traditional DPC algorithm and analysis
DPC is an unsupervised clustering algorithm based on local density and relative distance, which was proposed by Rodriguez and Laio in 2014. The core idea of this algorithm is that the cluster centers usually have high local density and are far away from other high-density points. DPC can automatically identify the cluster centers and handle clusters of any shape, while having certain robustness to noise data. This section introduces the DPC algorithm from three aspects: algorithm principle, formula definition, and algorithm analysis.
2.1 The principle of DPC algorithm
The principle of the DPC algorithm is based on two assumptions: (1) The local density of the cluster center (density peak point) should be much higher than that of its neighboring points, this indicates that the cluster center is usually located in the area where the data points are relatively dense, while the density of the surrounding points is relatively low. (2) The relative distance between different cluster centers is large, the distance from one cluster center to other higher-density points is relatively far, which indicates that there is sufficient separation between different cluster centers.
Based on two assumptions, the core process of DPC for clustering are as follows: (1) Measure local density: measure the density around each data point. (2) Calculate relative distance: calculate the minimum distance from each data point to the nearest high-density point. (3) Select cluster centers: choose the cluster centers based on local density and relative distance. (4) Allocate remaining points: allocate the non-center points to the cluster to which the nearest higher-density point belongs.
2.2 The calculation formula of DPC algorithm
2.2.1 Local density measure
The local density
One method is the truncation distance method:
Where,
The second method is the Gaussian kernel function method:
The Gaussian kernel function method calculates the local density more smoothly and is suitable for dealing with noisy data.
2.2.2 Relative distance calculation
Relative distance
For the point with the highest density, its relative distance is defined as the maximum distance to all other points.
2.2.3 Cluster center selection
By drawing a decision graph, that is, a two-dimensional graph of
2.2.4 Remaining points allocation
For non-central points, allocate them to the cluster to which the nearest higher-density point belongs.
2.3 Analysis of DPC algorithm
The DPC algorithm has three major advantages. Firstly, it does not require presetting the number of clusters: the cluster centers can be selected intuitively through the decision graph, avoiding the problem that traditional algorithms (such as K-means) need to preset the number of clusters in advance. Secondly, it can handle clusters of any shape: based on the density characteristic, it can identify non-spherical clusters. Thirdly, it has strong robustness: it has a certain tolerance to noisy data. However, DPC has two fatal flaws. At first, it is highly sensitive to the parameter
3 The proposed RMKNN-FDPC algorithm
This section elaborates in detail on the RMKNN-FDPC that integrates relative mutual K-nearest neighbor local density and fuzzy allocation. The core contributions of this algorithm mainly lie in the following two aspects: Firstly, we have designed a local density calculation method based on relative mutual K-nearest neighbor, which not only can effectively distinguish data points of different density levels but also provides a reliable basis for the accurate selection of cluster centers. Secondly, in response to the error propagation problem caused by the chain-like allocation in the traditional DPC algorithm, we have proposed a fuzzy allocation strategy for remaining points based on mutual K-nearest neighbor, thereby significantly improving the accuracy of clustering results. The following subsections will conduct in-depth discussions around these technical details.
3.1 Relative mutual K-nearest neighbor local density
In DPC, the calculation of local density usually relies on the key parameter
Firstly, the set of K-nearest neighbor for data point
Where,
Subsequently, the inverse K-nearest neighbor set
The inverse K-nearest neighbor method can provide a deep understanding of the relationships and structures among data points.
Secondly, the mutual K-nearest neighbor set
Next, the absolute density
Finally, based on Equations 1, 2, the relative mutual K-nearest neighbor local density
The relative mutual K-nearest neighbor local density
3.2 The fuzzy allocation strategy for the remaining points of mutual K-nearest neighbor
The DPC algorithm has an error propagation problem during the process of the remaining point allocation, that is, the incorrect allocation of a certain data point may trigger a chain reaction, thereby significantly reducing the clustering performance. To address this limitation, this paper proposes a fuzzy remaining point allocation strategy based on mutual K-nearest neighbor. This strategy consists of two stages: Firstly, Strategy 1 (Table 1) adopts a mutual K-nearest neighbor-based approach to determine preferential data point allocation; Secondly, in Strategy 2 (Table 2), the secondary allocation is carried out by calculating the fuzzy membership degree of data points. For the remaining points that have not been allocated after the above two stages, the allocation method of the DPC algorithm is finally adopted for processing. This allocation strategy effectively reduces the risk of error propagation and can improve the accuracy of clustering results.
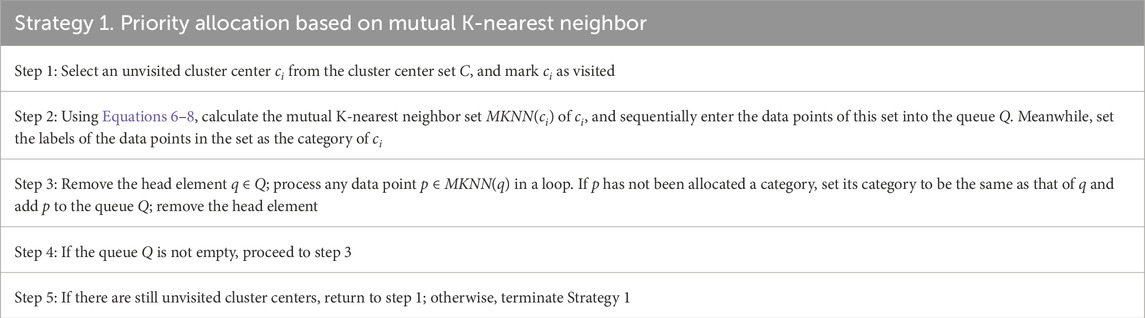
Table 1. Strategy 1.
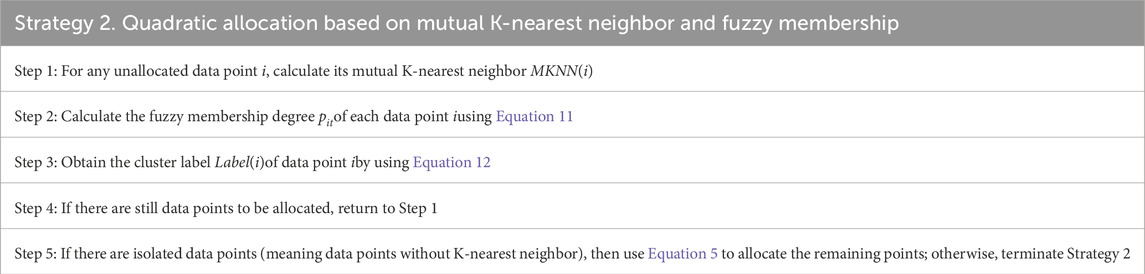
Table 2. Strategy 2.
Strategy 1 mainly utilizes mutual K-nearest neighbor and queues. The detailed procedure is outlined below.
Assuming that the allocation Strategy 1 is completed, after that, for the data points that have been allocated,
The cluster label
Therefore, the specific steps of the secondary allocation based on mutual K-nearest neighbor and fuzzy membership degrees are as follows.
3.3 RMKNN-FDPC algorithm and analysis
Combining the relative mutual K-nearest neighbor local density and the remaining point fuzzy allocation strategies, this section introduces the execution process of the RMKNN-FDPC algorithm, as shown in Figure 1. Meanwhile, Algorithm 1 provides detailed steps for the algorithm.
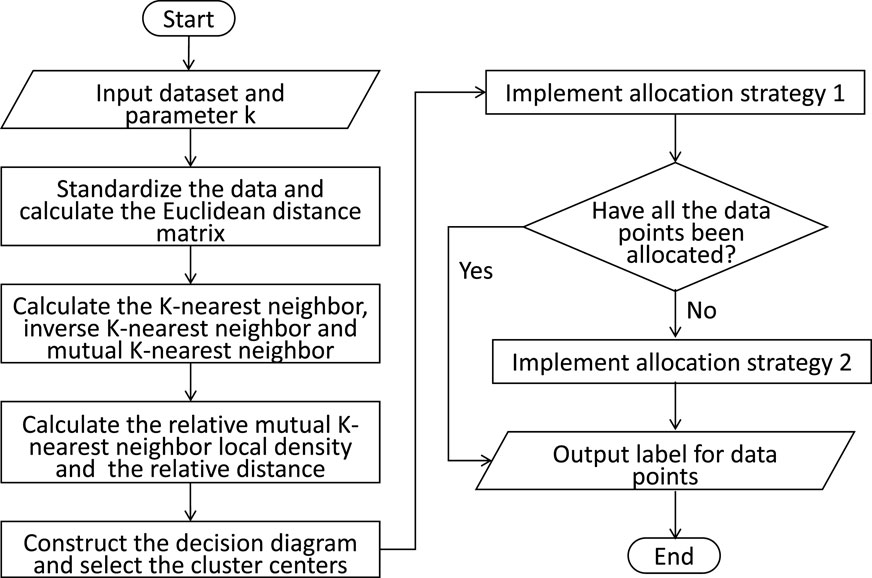
Figure 1. Flowchart of algorithm 1.
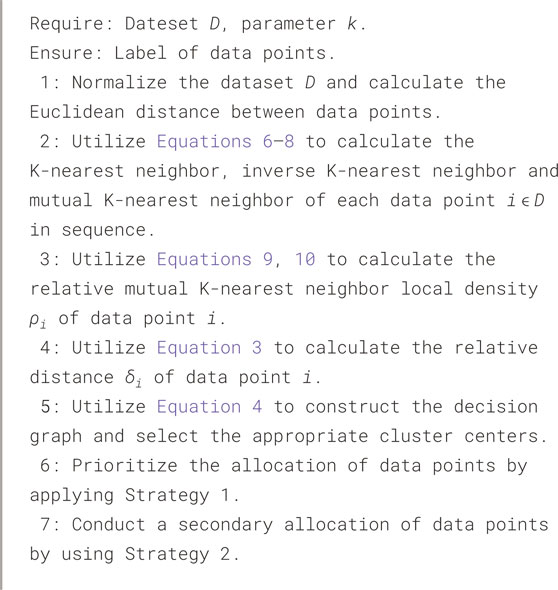
Algorithm 1. Density Peak Clustering Algorithm Integrating Relative Mutual K-Nearest Neighbor Local Density and Fuzzy Allocation Strategy.
Subsequently, a comprehensive analysis will be performed to examine the computational complexity of individual steps as well as the overall time complexity of the RMKNN-FDPC algorithm. Suppose the size of the dataset is
Ultimately, our analysis reveals that RMKNN-FDPC preserves the
4 Experiment and analysis
4.1 Experimental preparation
To evaluate the network intrusion detection effect and clustering ability of the proposed RMKNN-FDPC method, this paper selects the KDD-CUP-1999 dataset for network intrusion detection, six artificially synthesized two-dimensional datasets with varying shapes and uneven densities, and six real datasets from the UCI database for experiments. [23]. The specific information of the datasets is shown in Tables 3–5. Four classic clustering evaluation indicators are selected, namely, Accuracy (ACC) [11], the Adjusted Rand Index (ARI) [24], the Adjusted Mutual Information (AMI) [25], and the Fowlkes Mallows Index (FMI) [26,27]. The maximum value of each evaluation indicator is 1, and the closer the indicator value is to 1, the better the clustering effect. Five algorithms are chosen for comparison, including the original DPC [9], DPC-KNN [13], FKNN-DPC [14], the density peaks clustering based on weighted local density sequence and nearest neighbor assignment (DPCSA) [28], and the density peaks clustering based on local fair density and fuzzy K-nearest neighbor membership allocation strategy (LF-DPC) [29].
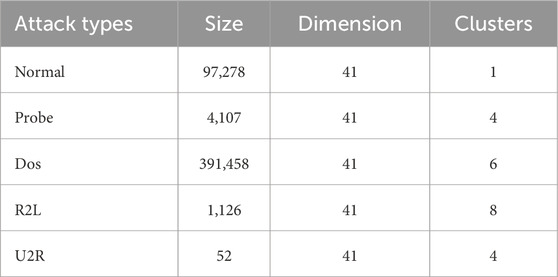
Table 3. KDD-CUP-1999 dataset.
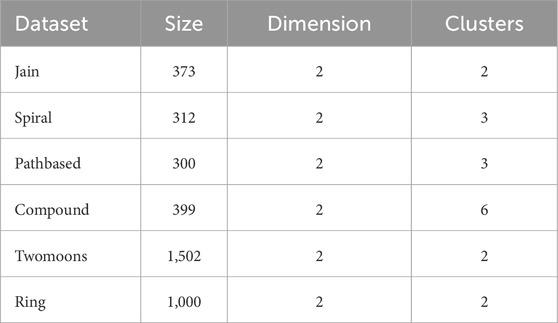
Table 4. Artificially synthesized datasets.
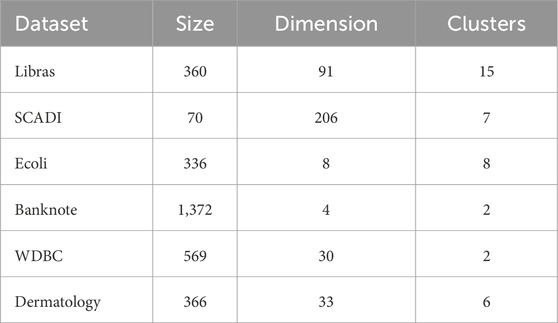
Table 5. Real datasets.
4.2 Experimental and analytical study on KDD-CUP-1999 dataset
For this experiment, the KDD-CUP-1999 dataset was selected. This dataset is mainly used for network intrusion detection and includes four types of attacks: U2R, DOS, R2L and Probe. The KDD-CUP-1999 dataset presents a highly imbalanced density distribution, with normal traffic accounting for only 19.69%, while attack traffic accounts for 80.31%, mainly DoS attacks (79.24%), and the remaining attacks (Probe, R2L, U2R) have a very low proportion. Numerical features mostly exhibit a long tail distribution and are close to zero, while categorical features such as TCP and HTTP dominate. Different attack types show significant differences in protocol and traffic patterns.
Due to the large scale of the dataset, two test sets (U1 and U2) were randomly selected from the dataset, each containing 1,000 and 800 data records respectively. In each group, both normal and abnormal data records are included.
The evaluation indicators for the experiment are ACC and FMI. The experimental results are presented in Table 6 and the optimal clustering value is highlighted in bold. Through the experiment, it can be found that for both U1 and U2, the detection accuracy of the RMKNN-FDPC algorithm is higher than that of other comparison algorithms, and it can effectively deal with network intrusion detection. This is because the advantages brought by the improvement of local density and the optimization of remaining point allocation.
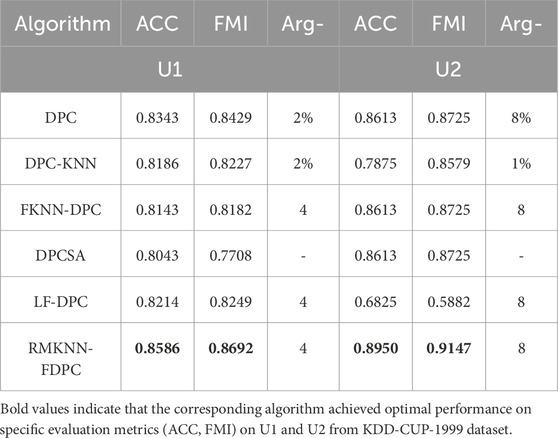
Table 6. Cluster results on U1 and U2 from KDD-CUP-1999 dataset.
4.3 Experimental and analytical study on synthetic datasets
This section presents the visualized clustering effect of the RMKNN-FDPC algorithm and five comparison algorithms on the synthetic datasets, as shown in Figures 2–7 respectively. The cluster centers in each sub-figure are represented by red squares. The specific evaluation values of clustering indicators are shown in Table 7. The bold font indicates the best clustering result for each dataset.
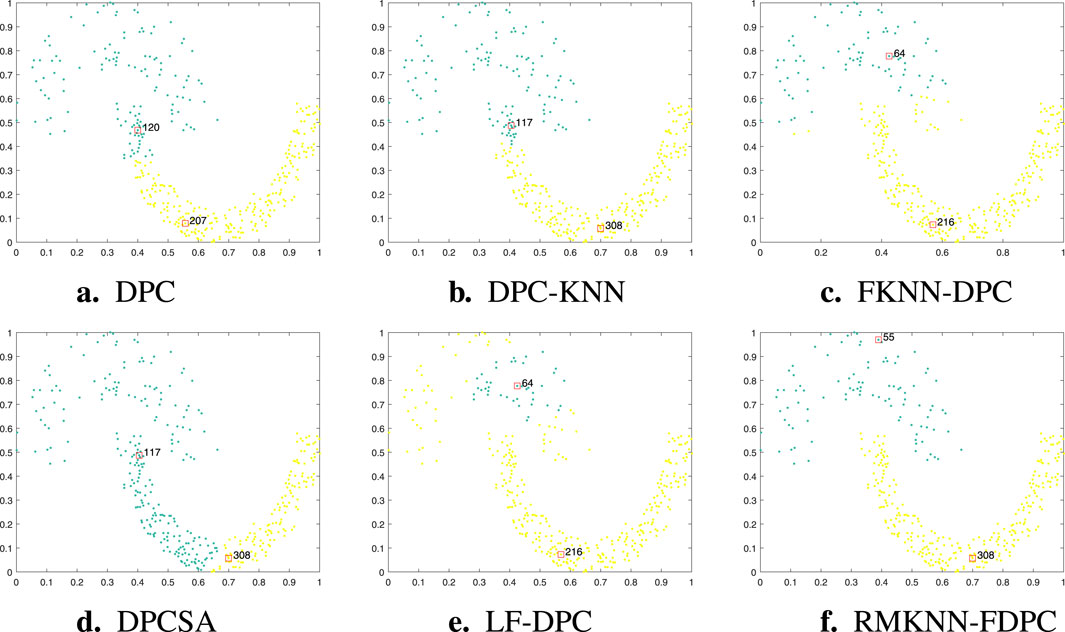
Figure 2. Visualization of clustering results of different algorithms on the Jain dataset. (a) DPC, (b) DPC-KNN, (c) FKNN-DPC, (d) DPCSA, (e) LF-DPC, (f) RMKNN-FDPC.
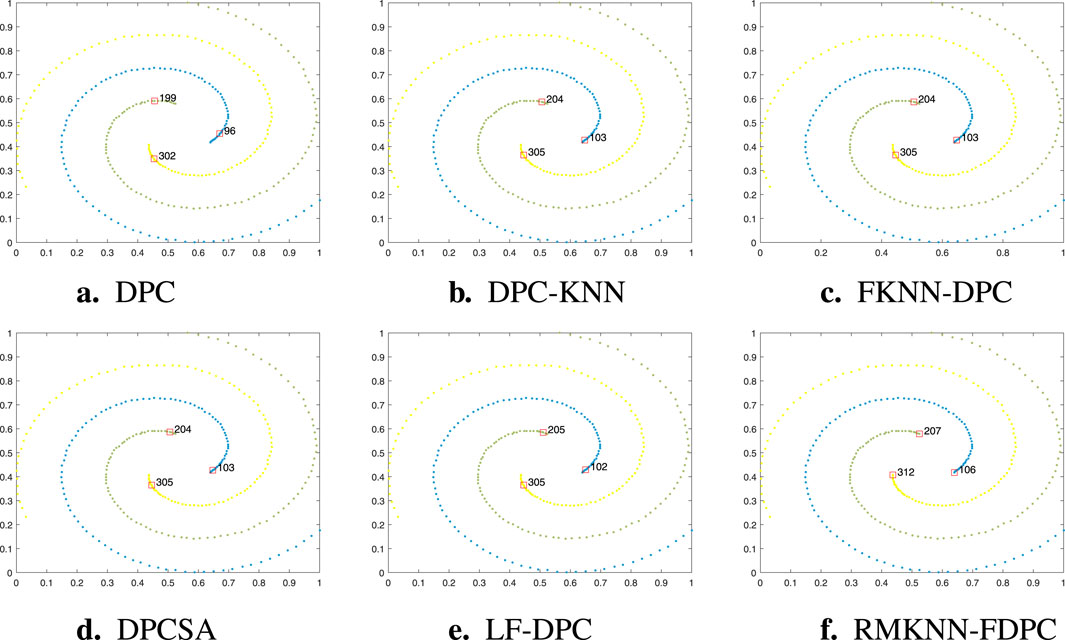
Figure 3. Visualization of clustering results of different algorithms on the Spiral dataset. (a) DPC, (b) DPC-KNN, (c) FKNN-DPC, (d) DPCSA, (e) LF-DPC, (f) RMKNN-FDPC.
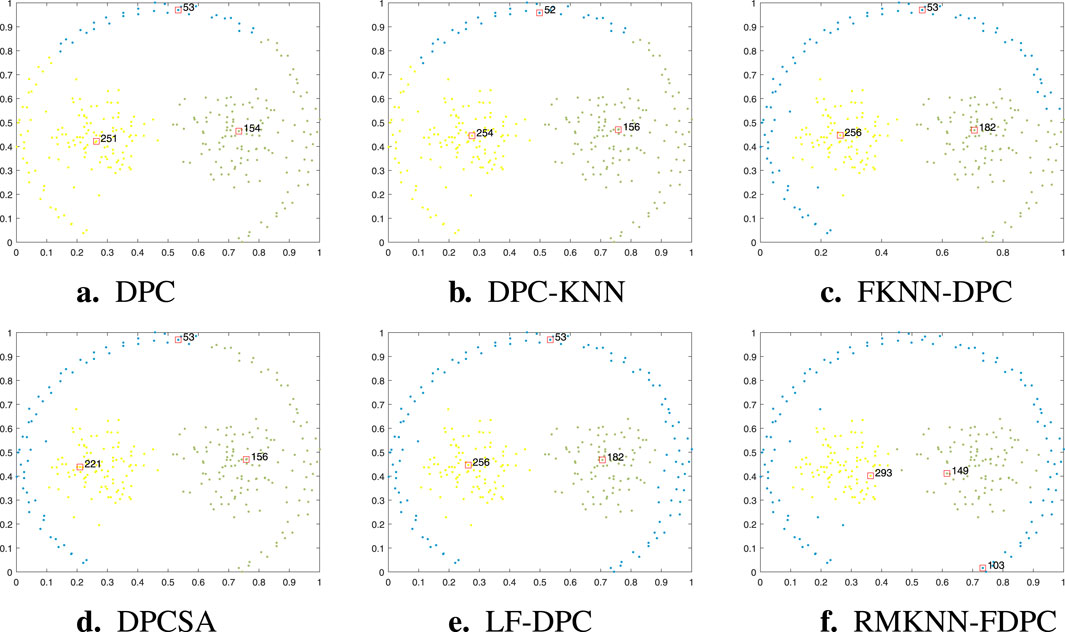
Figure 4. Visualization of clustering results of different algorithms on the Pathbased dataset. (a) DPC, (b) DPC-KNN, (c) FKNN-DPC, (d) DPCSA, (f) RMKNN-FDPC.
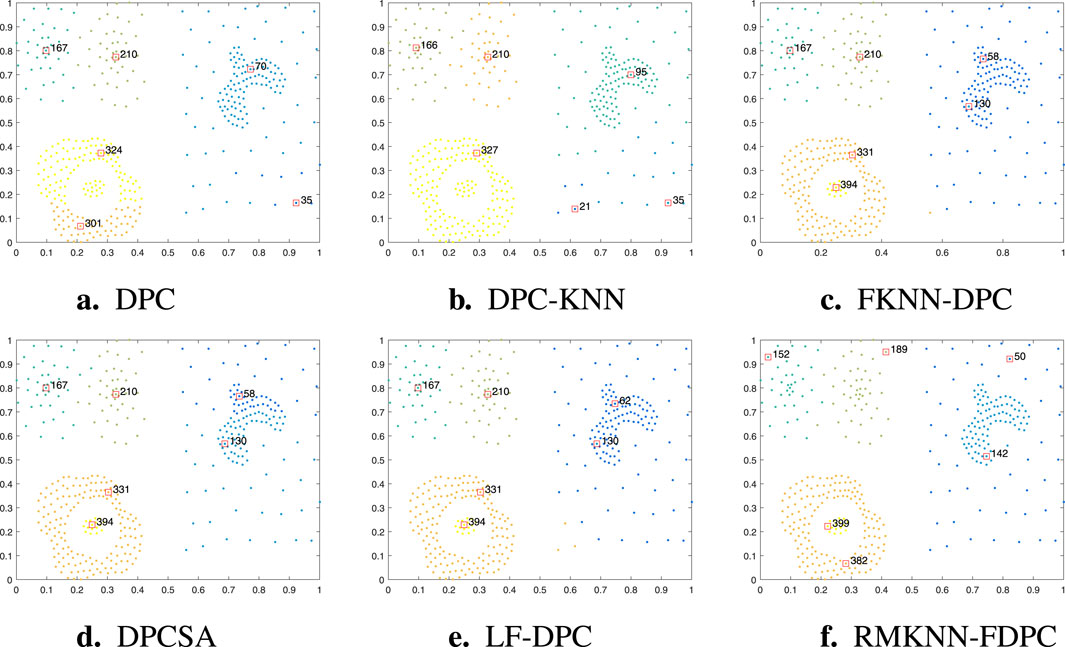
Figure 5. Visualization of clustering results of different algorithms on the Compound dataset. (a) DPC. (b) DPC-KNN. (c) FKNN-DPC. (d) DPCSA. (e) LF-DPC, (f) RMKNN-FDPC.
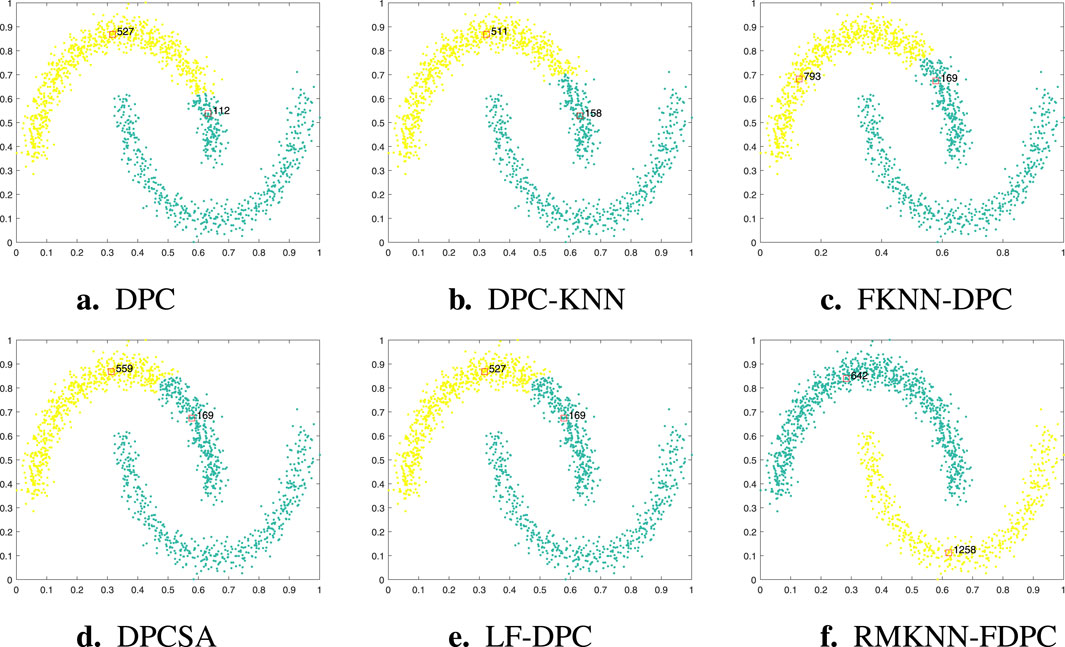
Figure 6. Visualization of clustering results of different algorithms on the Twomoons dataset. (a) DPC, (b) DPC-KNN, (c) FKNN-DPC, (d) DPCSA, (e) LF-DPC, (f) RMKNN-FDPC.
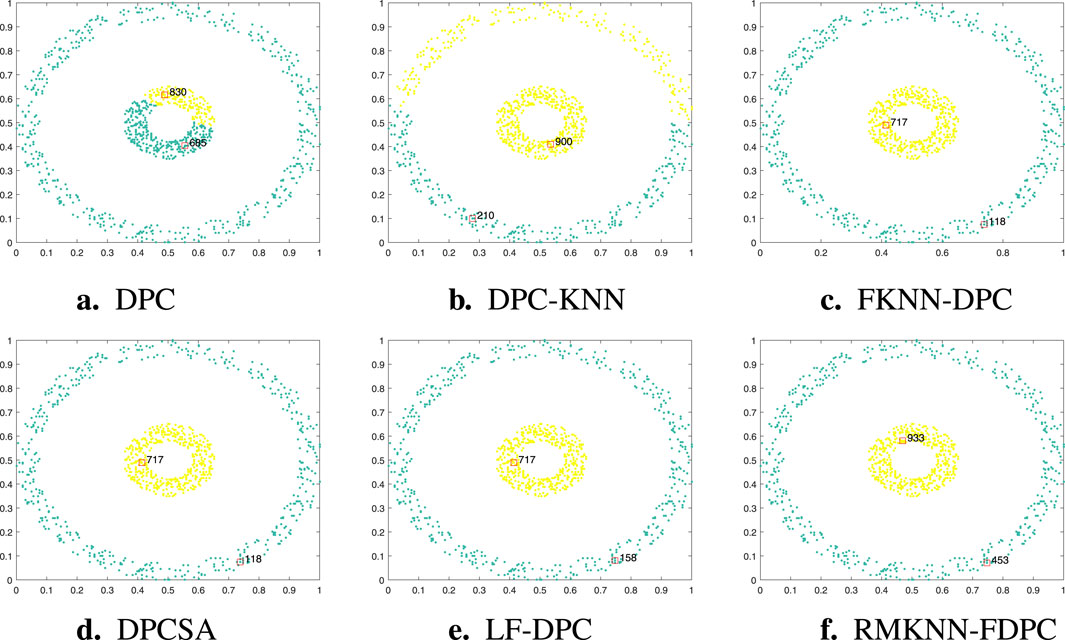
Figure 7. Visualization of clustering results of different algorithms on the Ring dataset. (a) DPC, (b) DPC-KNN, (c) FKNN-DPC, (d) DPCSA, (e) LF-DPC, (f) RMKNN-FDPC.
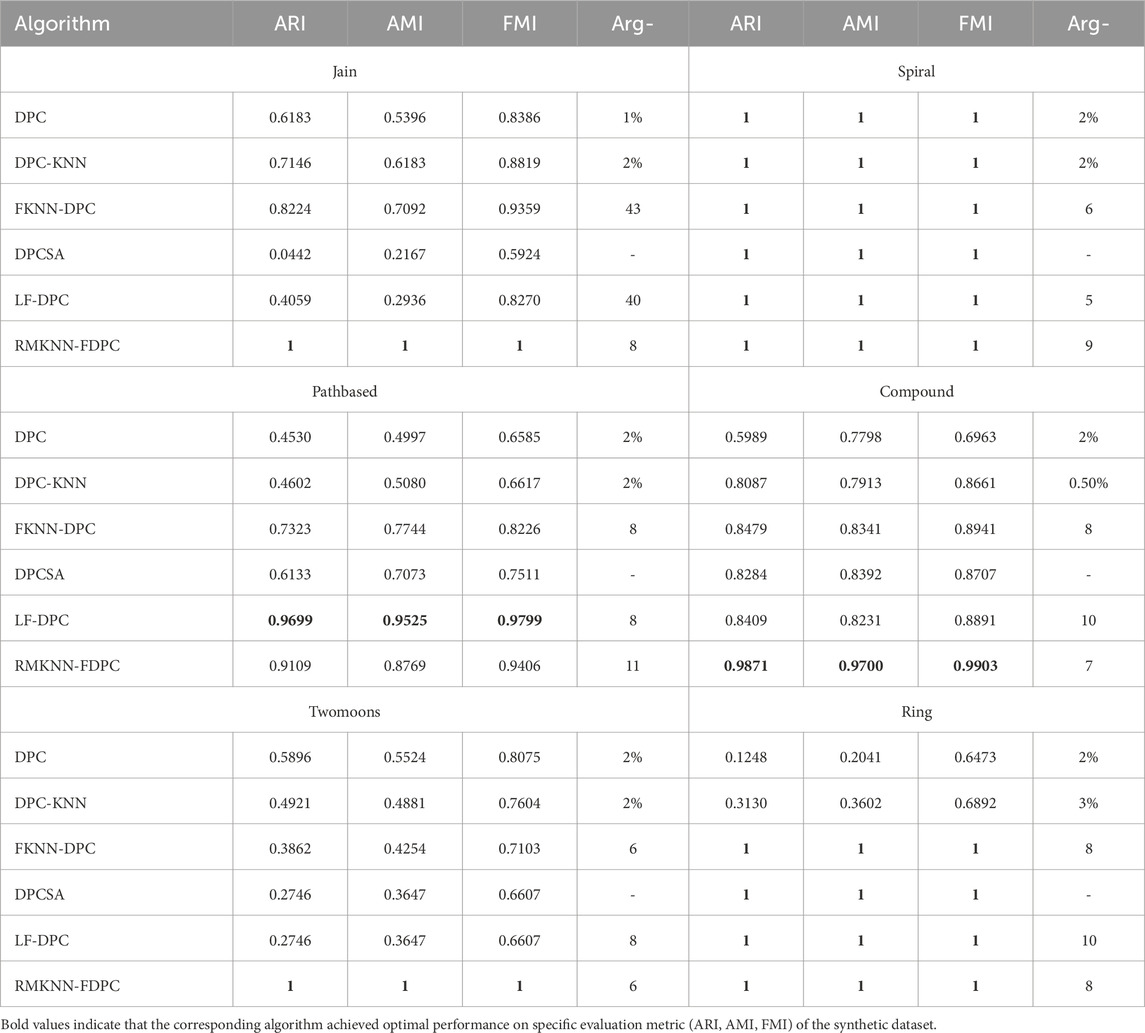
Table 7. Cluster results on Synthetic datasets.
The Jain dataset is a typical manifold dataset with uneven density distribution, consisting of two semi-circular arcs with different densities. Figure 2 shows the clustering results of each algorithm on this dataset. In DPC and its derivative algorithms, DPC, DPC-KNN, and DPCSA failed to correctly identify the cluster centers of the sparse clusters. The main reason is that the local density calculation did not fully consider the local distribution characteristics of the sample points. Although FKNN-DPC and LF-DPC can correctly find the cluster centers of the sparse clusters, in the upper semi-circle, some sample points of the sparse clusters are wrongly allocated to the clusters in the lower semi-circle. This phenomenon is mainly due to the limitations of the allcoation strategy. Comparatively, our proposed method demonstrates enhanced capability in precisely detecting the centroids of both clusters, but also can completely and correctly complete the allcoation of the remaining points. This advantage mainly benefits from the novel local density calculation method proposed in this paper and the fuzzy allcoation strategy of remaining points based on mutual K-nearest neighbor, thereby effectively solving the key problems in the identification and allcoation of sparse clusters.
The Spiral dataset consists of three spiral-shaped clusters and is a typical dataset with non-spherical cluster distribution. As can be seen from Figure 3, all six algorithms can achieve perfect clustering results, with only minor differences in the selection of cluster centers. This result fully demonstrates the advantages of density-based clustering algorithms in dealing with complex manifold structures. At the same time, the experimental results also further verify that the RMKNN-FDPC algorithm proposed in this paper has significant superiority in detecting non-spherical clusters of any shape, and can accurately identify complex cluster structures while maintaining high clustering accuracy.
The Pathbased dataset is a typical manifold dataset, whose structure is composed of a circular cluster enclosing two spherical clusters. Due to the fact that the sample points on the left and right sides of the spherical clusters are closely proximate to the circular cluster, it is prone to cause misallocation, which poses a significant challenge for most clustering algorithms. As can be seen from the experimental results in Figure 4, both DPC and its derivative algorithms can successfully identify three cluster centers. However, in DPC and DPC-KNN, the sample points on both sides of the circular cluster are wrongly allocated to the spherical cluster. This phenomenon mainly stems from the allocation strategy that solely relies on the distance principle. Although FKNN-DPC and DPCSA have improved the allocation strategy for the remaining points and successfully avoided the misallocation of sample points on the left side of the circular cluster, there are still misallocations for the sample points on the right side. In contrast, LF-DPC and RMKNN-FDPC can more accurately allocate the sample points on both sides of the circular cluster to the correct clusters, although there are still a few boundary points that are misallocated due to the adhesion problem. The RMKNN-FDPC algorithm ranks second in performance among all the compared algorithms, second only to LF-DPC, and demonstrates its superiority in handling complex manifold structures.
Figure 5 shows the clustering performance of RMKNN-FDPC compared with other benchmark algorithms on the Compound dataset. Featuring an asymmetric density distribution, the Compound dataset consists of six clusters with varying morphological characteristics. For most clustering algorithms, accurately detecting the clustering structure of this dataset is quite challenging. The DPC algorithm mistakenly identified two cluster centers in the cluster in the lower left corner. The main reason for this is that the local density calculation method failed to effectively handle the uneven density distribution situation. DPC-KNN only identified one cluster center in the two clusters in the lower left corner, but mistakenly found two cluster centers in the sparse clusters on the right side. This highlights the limitations of the local density calculation method in distinguishing datasets with uneven density distribution. FKNN-DPC, DPCSA, and LF-DPC have improved performance, but they still have a common problem: they cannot correctly identify the cluster centers of sparse clusters and mistakenly found two cluster centers in the large goose-shaped cluster in the upper right corner. This may be due to the use of a fixed k-value that cannot adapt to the local distribution of data points. Unlike conventional approaches, the RMKNN-FDPC algorithm performs exceptionally well in handling this dataset. It not only accurately identifies the cluster centers of sparse clusters but also correctly allocates the data points in sparse clusters. From the evaluation indicators, the performance of the RMKNN-FDPC algorithm is significantly superior to that of other benchmark algorithms, further verifying its superiority.
Twomoons is a manifold dataset composed of two semi-circles above and below. The sparsity of the two clusters is the same, but for most density-based clustering algorithms, the multi-peak problem is prone to occur. As can be seen from Figure 6, the clustering effects of different algorithms on the Twomoons dataset are presented. Both DPC and its derived algorithms (except for the algorithm proposed in this paper) have encountered the multi-peak problem. Specifically, in the upper semi-circle cluster, two cluster centers are incorrectly identified, while no cluster center is identified in the lower semi-circle cluster. Through analysis, it can be found that this phenomenon is mainly caused by the local density calculation method failing to fully consider the local distribution characteristics of sample points. In contrast, the RMKNN-FDPC algorithm not only can accurately identify the cluster centers of the dataset, but also can correctly complete the allocation of the remaining points, thereby achieving perfect clustering of this dataset. This result fully demonstrates the superiority and robustness of the RMKNN-FDPC algorithm in processing manifold datasets.
The Ring dataset consists of two circular clusters. As shown in Figure 7, FKNN-DPC, DPCSA, LF-DPC, and the proposed algorithm, by improving the local density calculation method and optimizing the strategy for distributing the remaining points, can all perform clustering perfectly. However, the original DPC algorithm has multiple peaks problem on the central circular cluster, which is mainly attributed to the limitations of its local density calculation method. Although DPC-KNN improves the local density calculation method, due to the fact that its strategy for distributing the remaining points still follows the original method of DPC, some sample points in the outer circular cluster have incorrect category allcoation. This comparative result further highlights the importance of optimizing the local density calculation and the strategy for distributing the remaining points in improving the clustering performance.
4.4 Experimental and analytical studies on real datasets
To test the clustering performance of RMKNN-FDPC, in this section, real datasets with different scales and dimensions were selected for experiments. Compared with artificially synthesized datasets, the real datasets from UCI are more complex and typically exhibits diverse feature patterns in density distribution. The experimental results can be used to evaluate the effectiveness of the algorithm proposed in this paper.
Table 8 presents the clustering results of six algorithms on six real datasets. The best clustering indicators have been marked in bold. As evidenced by the experimental data, the developed algorithm obtains the best clustering results on the four datasets (Libras, SCADI, Ecoli, WDBC), demonstrating its robustness and superiority under different data distributions. In the experiment on the Banknote dataset, the performance of RMKNN-FDPC is second only to DPCSA, but its ARI value still reaches 0.9368, significantly superior to the other four comparison algorithms, reflecting its stability in handling complex datasets. In the experiments conducted on the Dermatology dataset, the clustering indicators ARI, AMI and FMI of RMKNN-FDPC were second only to those of FKNN-DPC. Overall, RMKNN-FDPC performs well on most datasets, demonstrating its strong competitiveness as a clustering algorithm, mainly due to the relative mutual K-nearest neighbor local density and the fuzzy allocation strategy based on the mutual K-nearest neighbor of the remaining points.
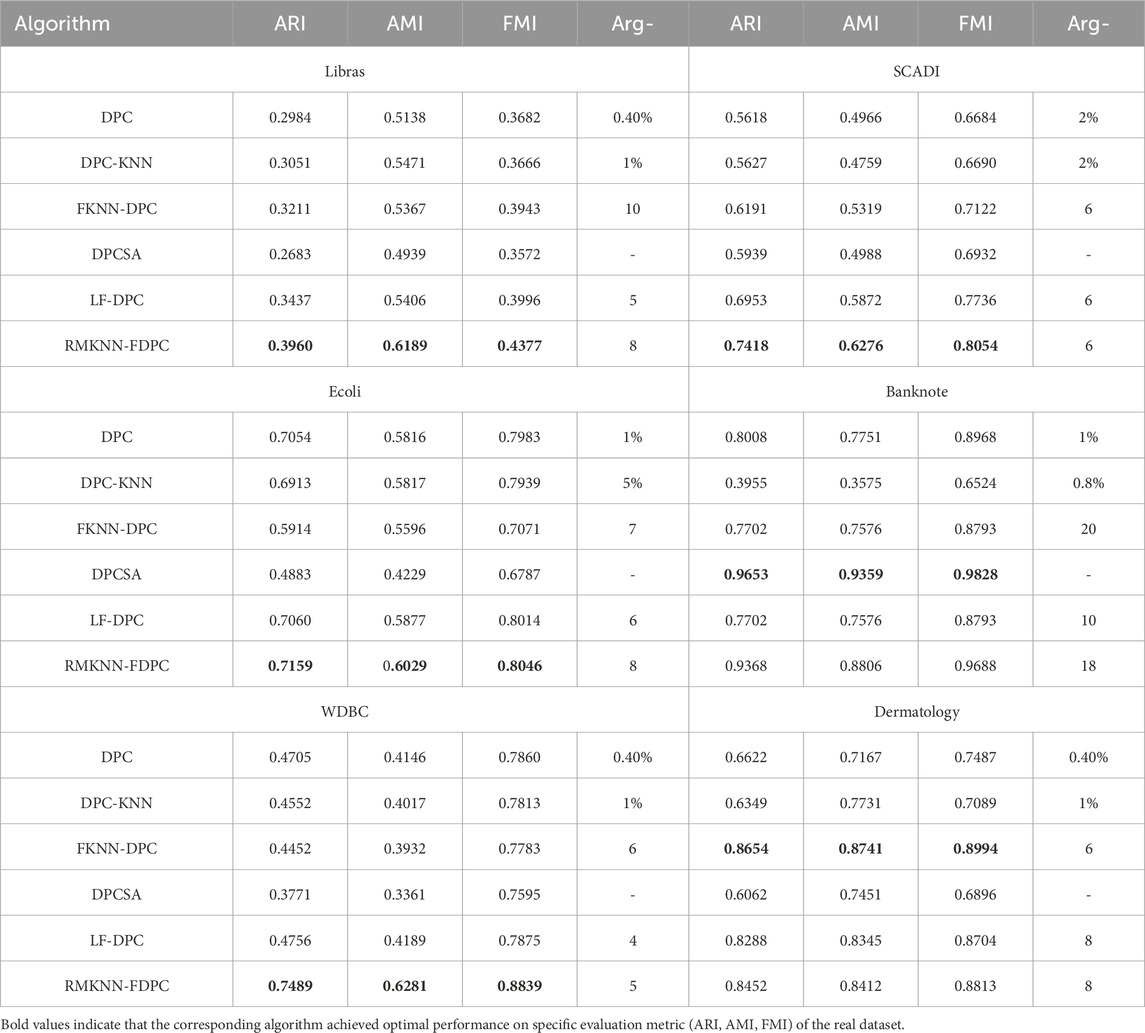
Table 8. Cluster results on Real datasets.
4.5 Experimental and analytical studies on Olivetti Faces Dataset
To further verify the clustering performance of RMKNN-FDPC, two types of comparative experiments were conducted on the Olivetti Faces dataset between RMKNN-FDPC and the original DPC algorithm, as well as DPC-derived algorithms (DPCSA and FKNN-DPC). The reason for choosing the Olivetti Faces dataset is that it is a classic face dataset used for clustering tests and can provide intuitive clustering results. This dataset contains 400 face images, with 10 images in each group, and each group of data records the facial features of the same tester under different lighting, expressions, and facial details. To reduce the test cost, we selected 10 groups of face data for the experiment.
The first type of comparative experiment is the selection of cluster centers. In this group of experiments, there are 10 real cluster centers. The experimental results are shown in Figure 8. We can observe that in the decision graph of the DPC algorithm, the
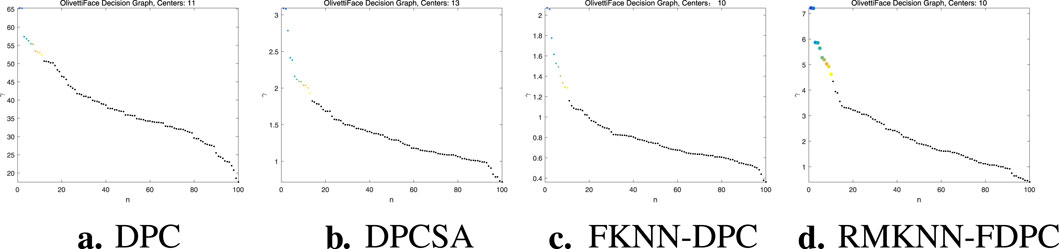
Figure 8. Experiment on selection of clustering centers. (a) DPC, (b) DPCSA, (c) FKNN-DPC, (d) RMKNN-FDPC.
The second type of experiment is the clustering of Olivetti Faces dataset. The experimental results are shown in Figure 9. In this figure, the cluster centers are marked with small red squares at the upper right corner of the image. We can observe that: DPC has two sets of face data that have encountered the problem of multiple peaks, and three sets of faces have not been identified with the cluster centers; DPCSA has five sets of face data that have multiple peaks, and three sets have not identified the real cluster centers; FKNN-DPC has three sets of face data that have encountered the problem of multiple peaks, and three sets have not identified the cluster centers; our algorithm has only one instance of multiple peaks, and only one set of data has not found the cluster center.
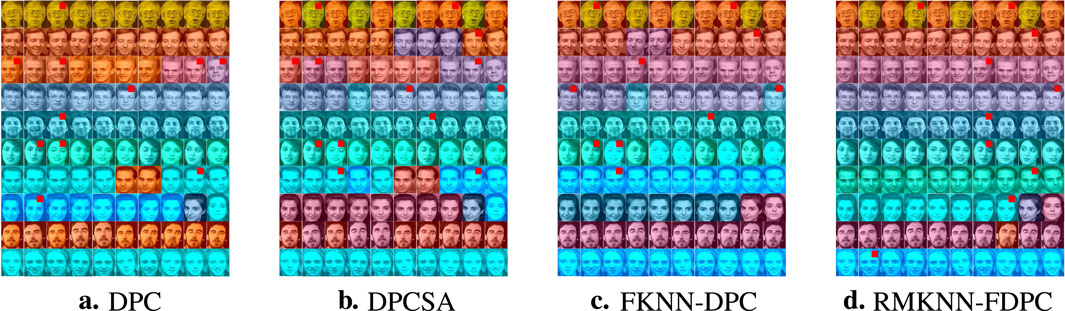
Figure 9. The clustering results of the Olivetti Faces Dataset. (a) DPC, (b) DPCSA, (c) FKNN-DPC, (d) RMKNN-FDPC.
By examining the specific clustering indicator values presented in Table 9, it is evident that RMKNN-FDPC outperforms the other three comparison algorithms in terms of indicator values. This further validates the efficiency of the proposed algorithm. This is because our algorithm not only improves the calculation of local density but also optimizes the method of the remaining point allocation.
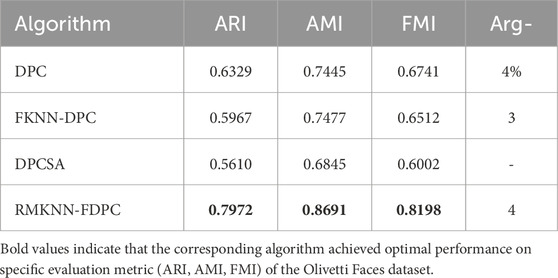
Table 9. Cluster results on Olivetti Faces dataset.
4.6 Parameter analysis
This part focuses on examining how the single parameter k-value in the RMKNN-FDPC algorithm influences the clustering outcomes. Therefore, we selected three datasets each from synthetic and real datasets for parameter analysis. The datasets include Spiral, Compound, Ring, SCADI, Ecoli, and Dermatology. Each dataset was tested ten times with different k-values.
The parameter analysis experiment results of the synthetic datasets are shown in Figure 10. We can observe that for the Spiral and Ring datasets, in experiments with different k-values, all three clustering evaluation indicators are 1, indicating that the RMKNN-FDPC algorithm is completely unaffected by the k-value and the clustering results are very stable. In the Compound dataset, the proposed algorithm is also relatively stable, except when the k-value is 8, 9, or 10. Therefore, in the parameter analysis of the synthetic datasets, RMKNN-FDPC is basically not affected by the k-value, further demonstrating the stability of the proposed algorithm.
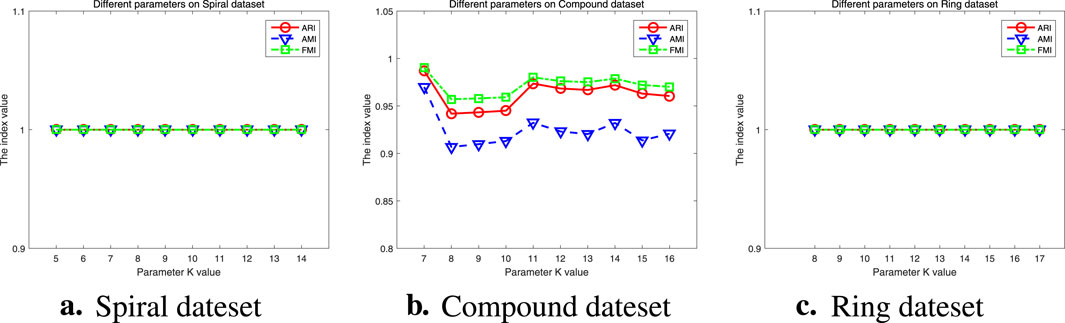
Figure 10. Parameter analysis on Synthetic datasets. (a) Spiral dateset, (b) Compound dateset, (c) Ring dateset.
The parameter analysis experiment results of the real datasets are presented in Figure 11. We can observe that for the SCADI dataset, RMKNN-FDPC is relatively stable when
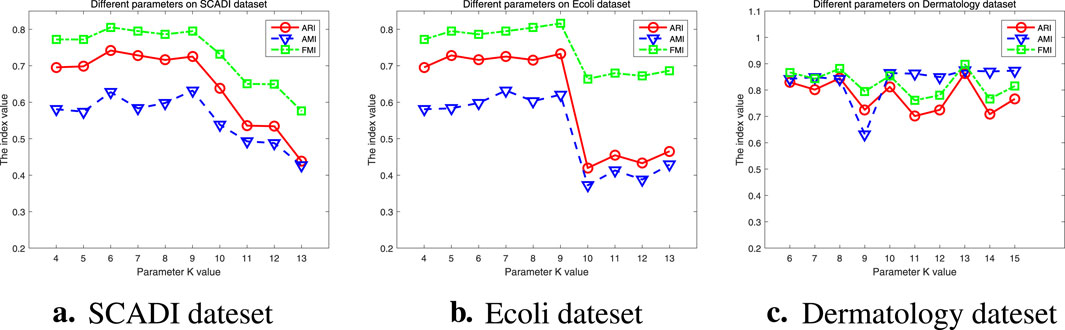
Figure 11. Parameter analysis on Real datasets. (a) SCADI dateset, (b) Ecoli dateset, (c) Dermatology dateset.
4.7 Run time analysis
The main purpose of this section is to compare the running time of the proposed RMKNN-FDPC algorithm with FKNN-DPC, DPCSA, and LF-DPC. The reason for choosing these algorithms is that all three compared algorithms have improved local density and optimized remaining point allocation strategies.
Table 10 presents the comparison results of the running time of four algorithms on different datasets. The running time is the average of each algorithm running four times and rounded to four decimal places, measured in seconds. We can see that the running time of DPCSA is relatively low compared to the other three algorithms, mainly because this algorithm uses a fixed k-value to calculate local density and allocate remaining points. The running time of FKNN-DPC and LF-DPC is generally the same, because the execution principles of the two algorithms are very similar. Although our algorithm has slightly higher running time on most datasets compared to other algorithms, the running time on some datasets is slightly lower than FKNN-DPC and LF-DPC. This is because RMKNN-FDPC needs to calculate mutual K-nearest neighbors, which increases some additional overhead when calculating local density and allocating data points. But overall, the running time of this algorithm is at the same level as FKNN-DPC and LF-DPC.
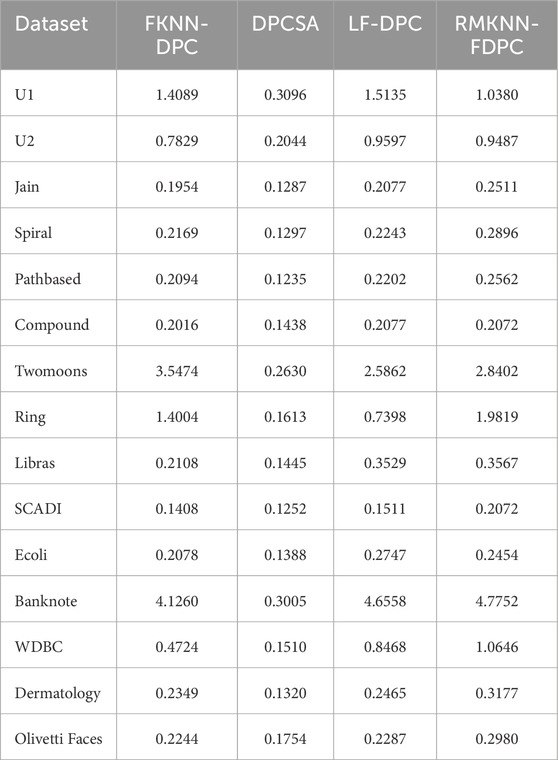
Table 10. Comparison results of running time.
5 Conclusion
This paper presents an improved density peak clustering algorithm named RMKNN-FDPC, which can be applied to network intrusion detection. The aim of this algorithm is to address the limitations of traditional density peak clustering algorithms when dealing with complex datasets. By introducing the concept of relative mutual K-nearest neighbor, RMKNN-FDPC can more accurately depict the local density distribution of data points, thereby effectively identifying data structures with randomness and complexity. Moreover, the algorithm combines mutual K-nearest neighbor to optimize the remaining point allocation strategy, further enhancing the accuracy and robustness of the clustering results. Experimental results show that RMKNN-FDPC performs well on the KDD-CUP-1999 dataset, the synthetic datasets, the real datasets and the Olivetti Faces dataset, especially in handling uneven density distribution, non-spherical clusters, and manifold structures. Its performance is significantly superior to traditional DPC and its derivative algorithms when dealing with these issues. Overall, RMKNN-FDPC not only inherits the simplicity and efficiency of DPC algorithm but also significantly improves the clustering effect through the improvement of local density calculation and allocation strategies, providing an effective solution for clustering problems of complex datasets. In the future, we will optimize the RMKNN-FDPC algorithm. Currently, its performance depends on the unique K-nearest neighbor parameter, so we will explore density peak clustering methods without parameters to reduce the sensitivity of the algorithm to parameter selection. At the same time, we will conduct in-depth research on the potential application of this algorithm in the real-time network intrusion detection scenario of CPSS.
Data availability statement
The original contributions presented in the study are included in the article/supplementary material, further inquiries can be directed to the corresponding author.
Author contributions
CR: Writing – review and editing, Writing – original draft. CW: Writing – review and editing. YY: Writing – review and editing. WY: Writing – review and editing. RG: Writing – review and editing.
Funding
The author(s) declare that financial support was received for the research and/or publication of this article. This work is supported by The High-Level Departure Project of Yibin University (Grant No. 2023QH02 and No. 2020QH08), Science and Technology Project of Sichuan Province (Grant No. 2024YFHZ0022 and No.2024ZYD0089).
Acknowledgments
The authors express their gratitude to the researchers who provided the source codes of the comparative algorithms and the experimental data for this paper.
Conflict of interest
The authors declare that the research was conducted in the absence of any commercial or financial relationships that could be construed as a potential conflict of interest.
Generative AI statement
The author(s) declare that no Generative AI was used in the creation of this manuscript.
Publisher’s note
All claims expressed in this article are solely those of the authors and do not necessarily represent those of their affiliated organizations, or those of the publisher, the editors and the reviewers. Any product that may be evaluated in this article, or claim that may be made by its manufacturer, is not guaranteed or endorsed by the publisher.
References
1. Zhou Y, Yu FR, Chen J, Kuo Y. Cyber-physical-social systems: a state-of-the-art survey, challenges and opportunities. IEEE Commun Surv and Tutorials (2019) 22:389–425. doi:10.1109/COMST.2019.2959013
2. Islam S, Javeed D, Saeed MS, Kumar P, Jolfaei A, Islam AN. Generative ai and cognitive computing-driven intrusion detection system in industrial cps. Cogn Comput (2024) 16:2611–25. doi:10.1007/s12559-024-10309-w
3. Wang G, Hao J, Ma J, Huang L. A new approach to intrusion detection using artificial neural networks and fuzzy clustering. Expert Syst Appl (2010) 37:6225–32. doi:10.1016/j.eswa.2010.02.102
4. Frey BJ, Dueck D. Clustering by passing messages between data points. Science (2007) 315:972–6. doi:10.1126/science.1136800
5. Li Y, Chu X, Tian D, Feng J, Mu W. Customer segmentation using k-means clustering and the adaptive particle swarm optimization algorithm. Appl Soft Comput (2021) 113:107924. doi:10.1016/j.asoc.2021.107924
6. Carcillo F, Le Borgne YA, Caelen O, Kessaci Y, Oble F, Bontempi G. Combining unsupervised and supervised learning in credit card fraud detection. Inf Sci Int J (2021) 557:317–31. doi:10.1016/j.ins.2019.05.042
7. Huang L, Ruan S, Denœux T. Application of belief functions to medical image segmentation: a review. Inf fusion (2023) 91:737–56. doi:10.1016/j.inffus.2022.11.008
8. Yang Y, Zheng K, Wu C, Niu X, Yang Y. Building an effective intrusion detection system using the modified density peak clustering algorithm and deep belief networks. Appl Sci (2019) 9:238. doi:10.3390/app9020238
9. Rodriguez A, Laio A. Clustering by fast search and find of density peaks. Science (2014) 344:1492–6. doi:10.1126/science.1242072
10. Liu Y, Zhao C, Chao H. Density peak clustering based on relative density under progressive allocation strategy. Math Comput Appl (2022) 27:84. doi:10.3390/mca27050084
11. Ren C, Sun L, Yu Y, Wu Q. Effective density peaks clustering algorithm based on the layered k-nearest neighbors and subcluster merging. IEEE Access (2020) 8:123449–68. doi:10.1109/ACCESS.2020.3006069
12. Zhao J, Tang J, Fan T, Li C, Xu L. Density peaks clustering based on circular partition and grid similarity. Concurrency Comput Pract Experience (2019) 32:e5567. doi:10.1002/cpe.5567
13. Du M, Ding S, Jia H. Study on density peaks clustering based on k-nearest neighbors and principal component analysis. Knowledge-Based Syst (2016) 99:135–45. doi:10.1016/j.knosys.2016.02.001
14. Xie J, Gao H, Xie W, Liu X, Grant PW. Robust clustering by detecting density peaks and assigning points based on fuzzy weighted k-nearest neighbors. Inf Sci (2016) 354:19–40. doi:10.1016/j.ins.2016.03.011
15. Liu R, Wang H, Yu X. Shared-nearest-neighbor-based clustering by fast search and find of density peaks. Inf Sci (2018) 450:200–26. doi:10.1016/j.ins.2018.03.031
16. Li Z, Tang Y. Comparative density peaks clustering. Expert Syst Appl (2018) 95:236–47. doi:10.1016/j.eswa.2017.11.020
17. Parmar M, Wang D, Zhang X, Tan A-H, Miao C, Jiang J, et al. Redpc: a residual error-based density peak clustering algorithm. Neurocomputing (2019) 348:82–96. doi:10.1016/j.neucom.2018.06.087
18. Zhao J, Wang G, Pan J-S, Fan T, Lee I. Density peaks clustering algorithm based on fuzzy and weighted shared neighbor for uneven density datasets. Pattern Recognition (2023) 139:109406. doi:10.1016/j.patcog.2023.109406
19. Xie J, Liu X, Wang M. Sfknn-dpc: standard deviation weighted distance based density peak clustering algorithm. Inf Sci (2024) 653:119788. doi:10.1016/j.ins.2023.119788
20. Yan H, Wang M, Xie J. Ann-dpc: density peak clustering by finding the adaptive nearest neighbors. Knowledge-Based Syst (2024) 294:111748. doi:10.1016/j.knosys.2024.111748
21. Wang Y, Yang Y. Relative density-based clustering algorithm for identifying diverse density clusters effectively. Neural Comput Appl (2021) 33:10141–57. doi:10.1007/s00521-021-05777-2
22. Hongxiang Z, Genxiu W, Zhaohui W. Density peaks clustering algorithm based on shared neighbor degree and probability assignment. J Comput Eng and Appl (2024) 60. doi:10.3778/j.issn.1002-83312305-0502
23. Wang Y, Qian J, Hassan M, Zhang X, Zhang T, Yang C, et al. Density peak clustering algorithms: a review on the decade 2014–2023. Expert Syst Appl (2024) 238:121860. doi:10.1016/j.eswa.2023.121860
24. Fränti P, Rezaei M, Zhao Q. Centroid index: cluster level similarity measure. Pattern Recognition (2014) 47:3034–45. doi:10.1016/j.patcog.2014.03.017
25. Vinh NX, Epps J, Bailey J. Information theoretic measures for clusterings comparison: variants, properties, normalization and correction for chance. J Machine Learn Res (2010) 11:2837–54. doi:10.5555/1756006.1953024
26. Boudane F, Berrichi A. Gabriel graph-based connectivity and density for internal validity of clustering. Prog Artif Intelligence (2020) 9:221–38. doi:10.1007/s13748-020-00209-z
27. Li T, Li B-y., Xin X-w., Ma Y-y., Yang Q. A novel tree structure-based multi-prototype clustering algorithm. J King Saud University-Computer Inf Sci (2024) 36:102002. doi:10.1016/j.jksuci.2024.102002
28. Yu D, Liu G, Guo M, Liu X, Yao S. Density peaks clustering based on weighted local density sequence and nearest neighbor assignment. IEEE Access (2019) 7:34301–17. doi:10.1109/ACCESS.2019.2904254
Keywords: CPSS, network intrusion detection, relative mutual k-nearest neighbor, fuzzy allocation strategy, density peak clustering
Citation: Ren C, Wang C, Yu Y, Yang W and Guo R (2025) Network intrusion detection based on relative mutual K-nearest neighbor density peak clustering. Front. Phys. 13:1623161. doi: 10.3389/fphy.2025.1623161
Received: 05 May 2025; Accepted: 09 June 2025;
Published: 09 July 2025.
Edited by:
Jianping Gou, Southwest University, ChinaReviewed by:
Tian Ran, Northwest Normal University, ChinaRui Lyu, Chengdu University of Technology, China
Copyright © 2025 Ren, Wang, Yu, Yang and Guo. This is an open-access article distributed under the terms of the Creative Commons Attribution License (CC BY). The use, distribution or reproduction in other forums is permitted, provided the original author(s) and the copyright owner(s) are credited and that the original publication in this journal is cited, in accordance with accepted academic practice. No use, distribution or reproduction is permitted which does not comply with these terms.
*Correspondence: Changyuan Wang, MTg0NzgwOTQ4QHFxLmNvbQ==