 Xiaosan Tao
 Zhibing Gao
- Jiangsu Earthquake Disaster Risk Mitigation Center (Jiangsu Province Earthquake Engineering Research Institute), Nanjing, China
The multi-suction bucket foundation has the potential to enhance anti-overturning capacity by converting the overturning moment of the entire system into axial push-pull forces of individual buckets. In recent years, offshore wind turbines with multi-bucket suction bucket group foundations have been successively put into production and use in China. However, research addressing the seismic dynamic performance of quad-bucket suction foundations embedded in saturated sandy strata remains scarce. Therefore, studying the seismic dynamic response of suction bucket group foundations is of significant practical importance. Based on the finite-element software OpenSees and focusing on the characteristics of liquefiable sites, this paper establishes a numerical model of a four-bucket suction bucket group foundation in saturated sand using an actual engineering project as the background. Considering the effects of earthquake and sand liquefaction, the seismic dynamic response and displacement variations of the four-bucket foundation in liquefiable sites are investigated. The results show that: under seismic action, the peak horizontal displacement of the suction buckets occurs synchronously with the peak ground acceleration; vertical settlement exhibits nonlinear growth with increasing peak ground acceleration, and differential settlement of the foundation is significantly aggravated in liquefiable sites; the excess pore water pressure ratio
1 Introduction
With the global energy transition and intensifying climate change, the development of renewable energy has attracted significant attention. Offshore wind power, due to its vast development potential and abundant resource capacity, has emerged as a research hotspot both domestically and internationally. The multi-suction bucket group foundation, which enhances anti-overturning capacity by converting the system overturning moment into axial push-pull forces on individual buckets, has been progressively implemented in China’s offshore wind turbine projects in recent years. However, current research on seismic responses of suction bucket foundations primarily focuses on single-bucket structures, with limited studies addressing the dynamic characteristics of multi-bucket group foundations. Therefore, investigating the seismic dynamic response of suction bucket group foundations holds substantial academic and engineering significance.
Considering that some offshore wind turbines are constructed in seismically active regions, the seismic response of offshore wind turbine structures is of paramount importance [1]. Wang et al. [2] validated the seismic response characteristics of suction bucket models with varying geometric parameters in saturated sandy soils, demonstrating the reliability of the experimental methodology. Zhu et al. [3] analyzed centrifuge experimental data to investigate the influence of a clay layer underlying sandy strata on the cyclic response of suction buckets. Latini and Zania [4] identified structural configuration as a critical parameter affecting the dynamic response of suction buckets. Bagheri et al. [5] evaluated the bearing performance of bucket foundations under cyclic and monotonic loading conditions through three-dimensional finite element analysis. Zhang et al. [6] performed lateral cyclic loading tests on a centrifuge, documenting pore water pressure accumulation and soil liquefaction tendencies. Faizi [7] proposed a novel triple-bucket jacket foundation, significantly reducing installation cost. Zhang et al. [8] conducted a seismic response analysis of suction bucket foundations in clay deposits.
Earthquake-induced soil liquefaction may induce severe damage to suction bucket structures [9]. Recent studies have primarily focused on the combined effects of seismic and environmental loads on the seismic dynamic response of suction bucket structures, as well as the influence of liquefaction on the stability of bucket foundations [10]. In experimental investigations, Yu et al. [11] examined the seismic response of gravity-based and monopile foundations under both dry and saturated conditions. Lu et al. [12] identified seismic amplitude as the most influential parameter. Wang et al. [2] compared the seismic responses of suction buckets in dry and saturated conditions. In numerical investigations, Negro et al. [9] emphasized the high liquefaction susceptibility of sandy soils. Zhang et al. [13] employed Abaqus to study the seismic response and liquefaction behavior of prestressed bucket foundations. Ding et al. [14] revealed that the soil inside the bucket exhibits enhanced liquefaction resistance due to lateral confinement from the bucket walls. Barari et al. [15] investigated liquefaction effects on monopile foundations. Nicosia [16] identified liquefaction potential at an OWT site in Taiwan using FLAC. Zhang et al. [17] demonstrated that installation velocity has negligible impact on liquefaction susceptibility. Patra and Haldar [18] analyzed the influence of seismic intensity and liquefaction depth on the dynamic response of wind turbine structures. Kazemi Esfeh and Kaynia [19] studied the combined wind and seismic load responses of suction buckets, monopiles, and anchor piles. Wang et al. [20] proposed methodologies to effectively mitigate soil liquefaction hazards.
Although numerous numerical simulations and experimental analyses have been conducted by domestic and international scholars regarding the dynamic response of suction bucket foundations in liquefiable sites under seismic loading, existing research predominantly focuses on the soil liquefaction behavior of single-bucket structures during earthquakes. Currently, limited attention has been paid to investigating the seismic dynamic response of suction bucket group foundations in liquefiable sites, particularly regarding the coupled dynamic behavior between the group foundation structures and surrounding soil. Therefore, it is essential and practically significant to conduct systematic research on the seismic dynamic response of suction bucket group foundations under various influencing factors in liquefaction-prone sites.
In this study, a numerical simulation model of the suction bucket structural system was established using numerical simulation software. Centrifuge tests were simulated and systematically validated through comparative analyses of soil dynamic responses and structural dynamic responses against experimental results. This process determined appropriate constitutive models for both sand and structural components, confirming the feasibility of numerical simulations. Based on practical engineering requirements, a group foundation model of suction buckets was developed using the same numerical simulation platform. The seismic dynamic response characteristics of suction buckets in liquefiable site conditions were thoroughly investigated, revealing the critical influence of soil liquefaction on suction bucket performance. The findings provide valuable insights into the seismic design optimization of suction bucket foundations in liquefaction-prone areas.
2 Numerical model development and validation
2.1 Development of the numerical model
The numerical simulation based on an actual offshore wind turbine structure engineering project. The foundation of the wind turbine employs a suction bucket jacket structure, comprising four suction buckets and an upper jacket structure. The substructure consists of four identical suction buckets, each with a diameter of 9.5 m, featuring a bottom elevation of −27.47 m and a top elevation of −19.0 m. The center-to-center distance between each suction buckets measures 20 m. The upper jacket structure, with its base rigidly connected to the suction bucket tops, extends to a top elevation of 17 m. A 1-m-high platform was installed atop the jacket structure, with the wind turbine concentrically positioned above this platform. The geometric configuration of the suction buckets was shown in Figure 1a.
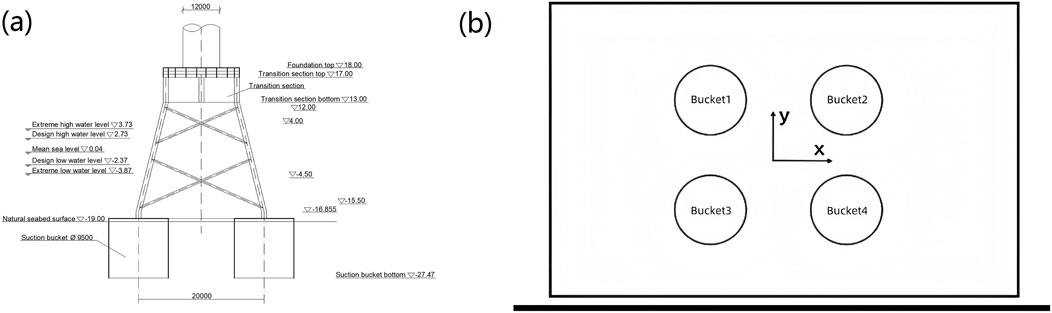
Figure 1. (a) Geometric model of suction bucket, (b) Top view of the numbering of suction buckets.
According to the engineering geological data, the soil layers at this site are primarily composed of the following three strata: Silty Sand A: Grayish-black in color, saturated, medium-dense, with relatively pure sandy composition. The particles are uniform in size and exhibit fair gradation. This layer is interbedded with thin layers of silt, showing relatively homogeneous soil properties, with a thickness of 3.4 m. Silty Sand B: Grayish-yellow in color, saturated, dense, containing relatively pure sandy material. The particles demonstrate uniformity in size and moderate gradation, presenting generally consistent soil characteristics. The layer thickness measures 6 m. Silty Sand C: Gray/yellow in color, saturated, characterized as medium compressibility soil with favorable engineering properties. This stratum has a thickness of 8.8 m. The physical and mechanical parameters of each soil type were summarized in Table 1.
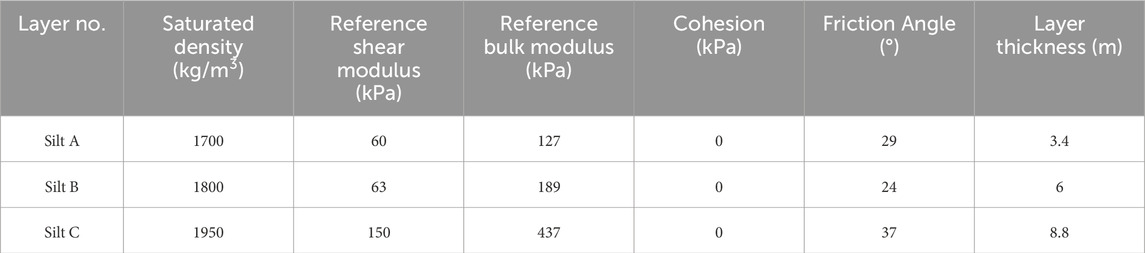
Table 1. Geological data.
The soil model has a width of 60 m and a length of 100 m. The four suction buckets were sequentially numbered in a clockwise manner according to the plan view, designated as Bucket1, Bucket2, Bucket3, and Bucket4 respectively. Subsequent analyses in this paper will consistently refer to these numerical designations. The spatial arrangement of the numbered suction buckets in the plan view was shown in Figure 1b.
Based on practical engineering parameters of suction bucket foundation structures, the connection between suction buckets and jacket structures was established through a rigid coupling. The inter-tier bracing connections within the jacket structure were modeled using the two NodeLinkMaterial constitutive model from OpenSees. The superstructure platform and wind turbine components were constructed using concrete materials. In numerical simulations, the upper wind turbine structure was simplified as a cylindrical thick pile with equivalent height characteristics. This simplified model incorporates the turbine’s self-weight and specified environmental loads to realistically simulate the combined effects of operational loading and seismic actions transmitted to the substructure under actual service conditions.
This study focuses on the seismic sensitivity analysis of suction bucket group foundations under earthquake conditions. The structural models of the suction bucket foundation and group foundation configuration are shown in Figure 2. To better simulate the actual superstructure conditions of wind turbines, a wind turbine tower of defined height was incorporated into the platform model. The turbine assembly was simplified as a spherical mass element, with the total mass of the wind turbine system set at 200 metric tons.
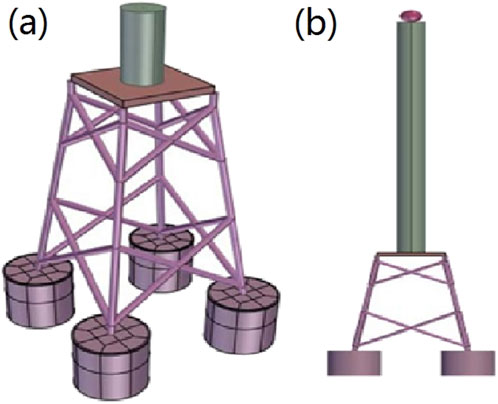
Figure 2. Offshore wind power foundation computational model (a) structural model of suction bucket, (b) front view of numerical model.
To numerically simulate the dynamic response of saturated sand under seismic loading, this study employs OpenSees [21], a renowned analysis platform in earthquake engineering research. The soil constitutive model adopts the PressureDependMultiYield material, an elasto-plastic formulation that incorporates confining pressure effects and effectively captures the nonlinear stress-strain behavior of soils. The material parameters for numerical analysis were determined through comprehensive consideration of: fundamental physical properties including relative density and shear wave velocity documented in seismic centrifuge test reports for offshore wind turbine suction bucket foundations; recommended values from the constitutive model developers Yang et al. [22]; and similarity theory principles. This integrated approach ensures the accurate characterization of soil behavior while maintaining consistency with experimental observations and theoretical frameworks.
2.2 Validation of numerical model
Currently, few studies have investigated the seismic dynamic response of suction bucket group foundations in liquefiable sites, with particularly limited research on the coupled seismic behavior of both foundation structures and surrounding soil. To validate the reliability of the numerical simulation model developed in this study, we first established a computational model based on the seismic centrifuge test parameters of offshore wind turbine suction bucket foundations reported by Xuefei Wang et al. [2], including structural configuration and soil properties. Comparative analysis between numerical simulations and experimental observations reveals that the simulated pore water pressure buildup closely matches the experimental data obtained from the centrifuge tests. The numerical simulation results exhibited slightly higher initial vertical settlement of the superstructure compared to experimental measurements, which can be attributed to the idealized soil modeling approach. In reality, soil densification during bucket installation might reduce initial settlement, though the final settlement magnitudes under seismic loading showed good agreement with experimental results. Both numerical simulations and experimental measurements demonstrated comparable structural rotations that were substantially below the critical thresholds specified in relevant design codes. These comparisons confirm the reliability of the suction bucket foundation modeling methodology presented in this study. The quantitative comparisons between numerical and experimental results are graphically shown in Figures 3a–c.
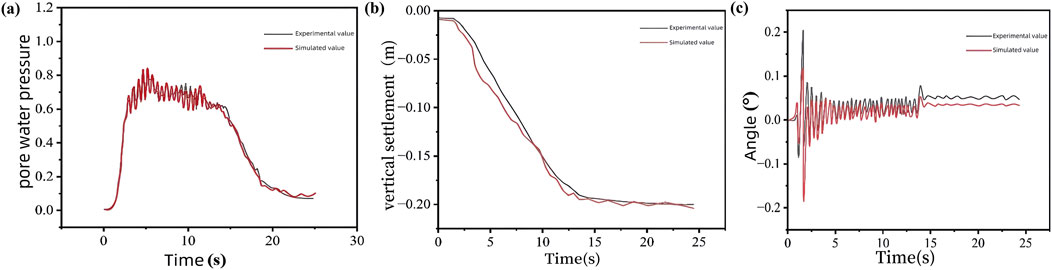
Figure 3. (a) Experimental and simulated values of (a) pore water pressure, (b) vertical settlement, and (c) angle.
3 Study on seismic response characteristics of the suction bucket group foundation in liquefiable sites
3.1 Liquefaction identification
In engineering, soil liquefaction refers to the phenomenon where originally solid soil transforms into a liquid state or exhibits viscous, fluid-like behavior under seismic action. This geotechnical failure mechanism predominantly occurs in saturated, loose, fine-grained sands or silty sands.
The excess pore water pressure ratio
where
Based on the soil layer information provided in Table 1, the average effective stress
where
where
Prior to conducting numerical calculations, a static analysis of the suction bucket foundation within the target soil stratum was performed to obtain the initial stress field of the soil mass.
The selected seismic event was the Parkfield-02. CA earthquake. In accordance with the seismic fortification intensity requirements of the project, the seismic wave was scaled to a peak ground acceleration (PGA) of 0.1 g and applied to the numerical model. The input seismic wave comprise horizontal seismic components exclusively along the west-east (x) direction. The directional relationship between seismic wave propagation and suction bucket foundation orientation is schematically illustrated in Figure 1b. All subsequent seismic inputs maintain this consistent orientation throughout the study. The scaled Parkfield-02. CA seismic wave with 0.1 g PGA and its corresponding fourier amplitude spectrum are shown in Figures 4a,b, respectively.
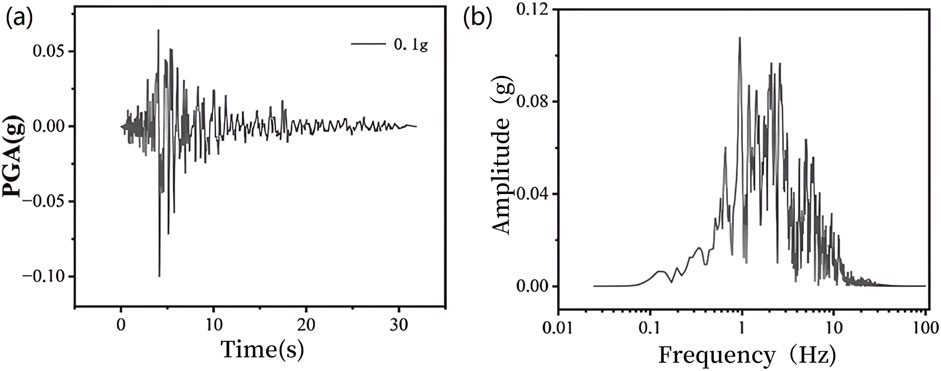
Figure 4. (a) Seismic wave, (b) seismic spectrum.
3.2 Dynamic response of foundation and soil
Figure 5a shows the time-history curves of acceleration responses across different soil layers. As shown in figure, with increasing depth of the soil layer in the model, the saturated density of the soil gradually rises. This enhanced density results in a reduced acceleration amplification coefficient, consequently leading to progressive attenuation of soil acceleration. Although the peak acceleration values of various soil layers occur at similar time instances, they exhibit distinct magnitudes in their peak amplitudes.
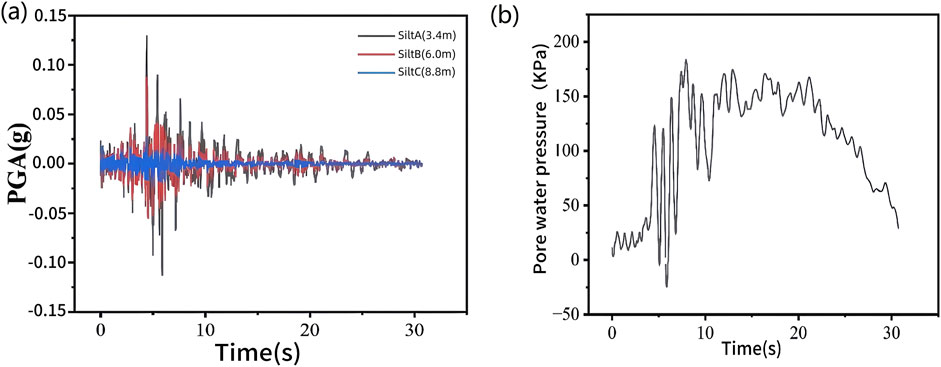
Figure 5. (a) Acceleration time history of soil mass, (b) pore water pressure.
A soil layer point with a thickness of 0.5 m inside the suction bucket was selected to analyze the post-seismic pore water pressure. As shown in Figure 5b, the pore water pressure within each suction bucket progressively increases during seismic loading and gradually returns to its initial state following earthquake termination. During the initial phase of seismic excitation, negative pore water pressure emerges in the internal soil of the suction bucket. This phenomenon occurs due to the structural constraints of the suction bucket that prevent immediate drainage of the sheared sand within the bucket, thereby restricting volumetric expansion. As shear deformation continues, water expulsion becomes feasible through the lower section of the suction bucket, leading to subsequent pore water pressure accumulation and the generation of positive pore water pressure. Under the 0.1 g horizontal Parkfield-02. CA ground motion, the maximum pore water pressure recorded at the 0.5 m depth within the suction bucket reaches approximately 180 kPa, which remains insufficient to induce complete liquefaction. Figure 6 shows contour plots comparing the pore water pressure distributions before and during the seismic event.
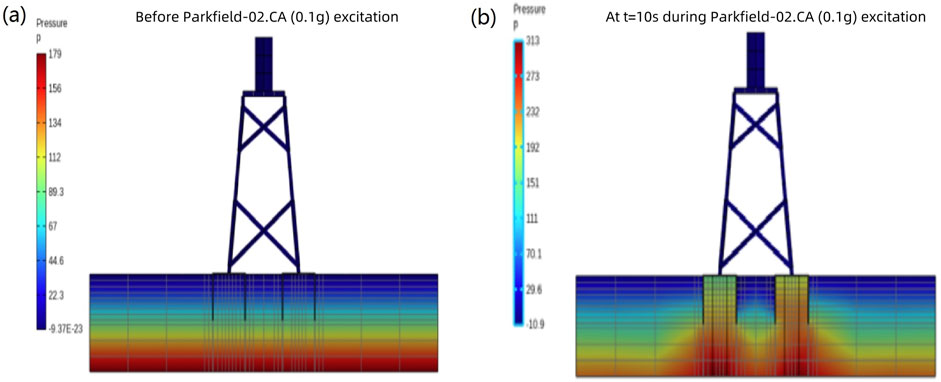
Figure 6. Pore water pressure cloud map (a) before the earthquake, (b) during the earthquake.
To investigate the seismic response characteristics of suction bucket foundations, this section focuses on analyzing the horizontal displacement and vertical settlement of suction buckets. A comparative analysis was conducted on the time-history variations of horizontal displacement and vertical settlement for each suction bucket under seismic excitation. Figure 7a shows the time-history variation of horizontal displacement for each suction bucket under the 0.1 g Parkfield-02. CA seismic wave input. As shown in figure, Buckets 1 and 2 exhibit nearly identical horizontal displacement trends, while similar consistency is observed between Buckets 3 and 4. The substantial relative displacements between suction buckets in liquefiable sites may potentially induce damage to connections in the upper truss structure. The horizontal displacement patterns of all suction buckets demonstrate synchronized variations with the seismic wave, reaching peak values concurrently with maximum seismic acceleration rather than attaining maximum displacement at seismic termination. Therefore, subsequent studies on suction bucket safety under seismic conditions should prioritize the maximum displacement during seismic events rather than relying solely on residual displacement at motion cessation.
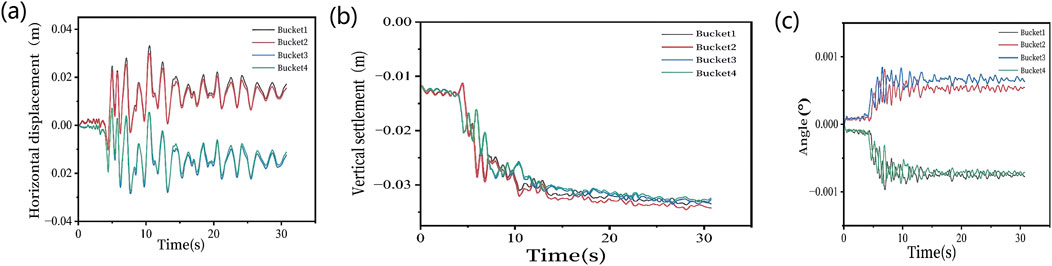
Figure 7. (a) Horizontal displacement of each suction bucket, (b) vertical settlement of each suction bucket, and (c) suction bucket angle.
Figure 7b shows the time history of vertical settlements for each suction bucket under the Parkfield-02. CA seismic wave (PGA = 0.1 g). As shown in figure, the vertical settlements of all suction buckets initially exhibit rapid growth during seismic vibration, followed by gradual stabilization after reaching specific thresholds, ultimately maintaining relatively constant values until the earthquake termination. The significantly larger vertical settlements observed across all suction buckets can be attributed to varying degrees of soil liquefaction occurring in the underlying liquefiable site during seismic action. The maximum total settlement of the suction bucket foundation manifests at the conclusion of seismic loading, whereas the peak differential settlement emerges during the earthquake propagation process.
Figure 7c shows the time histories of rotation angles for each suction bucket under the Parkfield-02. CA seismic wave excitation (PGA = 0.1 g). As shown in figure, the rotational variations of all buckets exhibit negligible magnitudes, with peak rotation angles reaching approximately 0.001°, which remains substantially below the code-specified limit value. Consequently, the rotational behavior of suction buckets will not be incorporated into subsequent investigations concerning liquefiable site conditions.
4 Analysis of influencing factors
4.1 Effect of peak ground acceleration
In the study of the influence of peak ground acceleration (PGA) on suction bucket group foundations, the Parkfield-02. CA ground motion was selected and scaled to 0.1, 0.15, 0.2, 0.25, 0.3, and 0.4 g. To evaluate the liquefaction extent and distribution within the bucket soil, the maximum pore water pressure was measured at 1-m intervals inside the bucket. The excess pore water pressure ratio
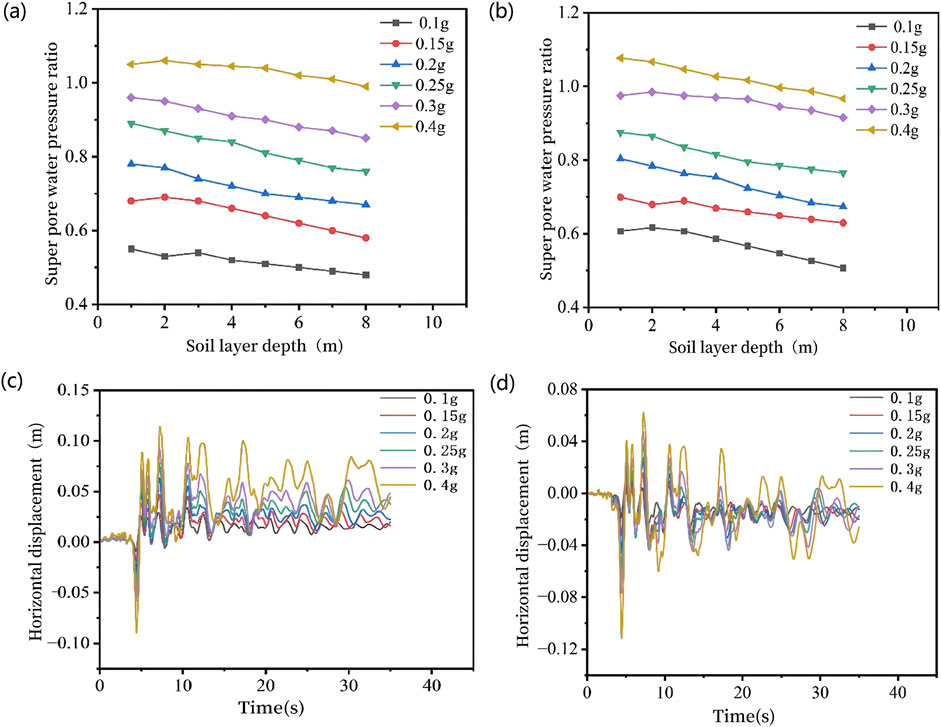
Figure 8. Excess pore water pressure ratio envelope diagram (a) Bucket 2, (b) Bucket 3 and horizontal displacement (c) Bucket 2, (d) Bucket 3.
Figures 8c,d and Figures 9d,e respectively show the simulated horizontal displacements and vertical settlements of Buckets 2 and 3 under Parkfield-02. CA ground motion inputs with different peak accelerations. As illustrated, both horizontal displacements and vertical settlements of suction buckets in liquefiable sites progressively amplify with increasing ground motion acceleration amplitude. The maximum horizontal displacements consistently coincide with peak ground acceleration occurrences during seismic events, while vertical settlements exhibit rapid escalation when seismic acceleration attains peak values. As peak acceleration intensifies, varying degrees of liquefaction gradually develop and continuously expand in both internal and external soils surrounding the suction buckets. This liquefaction phenomenon induces partial loss of soil bearing capacity and expansion of interparticle pore spaces (ultimately amplifying horizontal displacements), coupled with progressive reduction of soil foundation stress (driving continual settlement of foundations). Notably, settlement magnitudes display no stabilization tendency upon cessation of ground motion excitation but rather manifest a persistent trend toward continued subsidence.
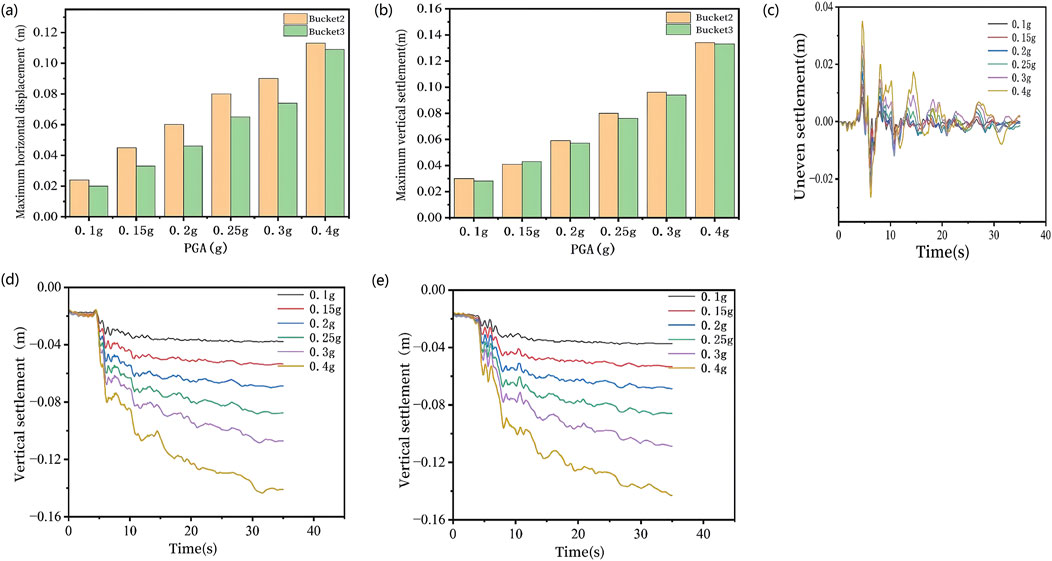
Figure 9. (a) Histogram of maximum horizontal displacement, (b) histogram of maximum vertical settlement, (c) inhomogeneous settlement, and vertical settlement (d) Bucket 2, (e) Bucket 3.
Based on the bar charts shown in Figures 9a,b illustrating the maximum horizontal displacements and maximum vertical settlements of Buckets 2 and 3 under different peak ground acceleration (PGA) levels, the growth of maximum horizontal displacements and maximum vertical settlements for all suction buckets exhibits a direct proportionality to the PGA. Under liquefiable site conditions where soil liquefaction may occur, notable differences in maximum horizontal displacements between Buckets 2 and 3 emerge under varying seismic amplitudes: the maximum horizontal displacements of Bucket 2 exhibit progressive escalation from 0.026 m at 0.1 g PGA to 0.111 m at 0.4 g PGA, while Bucket 3 displays an increase from 0.020 m to 0.108 m under equivalent excitations, with the maximum differential displacement reaching 0.003 m at 0.4 g PGA. Under progressive PGA amplification, the degree and extent of soil liquefaction inside and around the suction bucket progressively intensify, resulting in a corresponding reduction in the bearing capacity of the surrounding soil; this mechanism induces differential amplification of peak horizontal displacements between Buckets 2 and 3, thereby generating relative horizontal displacements that necessitate special attention to the connection integrity of upper truss structures and require structural reinforcement measures to enhance stability. Furthermore, since the vertical settlements of the buckets under different PGA levels follow similar variation trends with ground motion duration, assessing the differential settlement characteristics across the entire suction bucket foundation becomes essential when investigating structural stability.
The differential settlement under various working conditions was calculated by determining the displacement differences between individual buckets at different peak accelerations. As shown in Figure 9c, the differential settlement of the suction bucket foundation demonstrates a progressive increase with higher peak ground acceleration (PGA) of seismic motions. Notably, the maximum differential settlement occurred during the seismic event rather than at its conclusion. When the seismic acceleration reached its peak value, the differential settlement between buckets simultaneously attained maximum values. The results indicate a positive correlation between PGA magnitude and the induced differential settlement, where greater seismic accelerations produce more pronounced uneven settlement. This phenomenon may pose significant adverse effects on structural stability, particularly under high-intensity seismic conditions.
4.2 Effects of ground motion spectral characteristics
When investigating the influence of seismic ground motion spectral characteristics on the seismic performance of suction bucket foundations, four earthquake records with distinct spectral differences were selected: Parkfield-02. CA, Irpinia, Whittier, and ChiChi. As established in the previous section, the soil within each bucket of the suction bucket foundation undergoes complete liquefaction when the peak ground acceleration (PGA) reaches 0.4 g. This section employs ground motions with different response spectra but identical amplitude (PGA = 0.4 g) to better observe the effects of soil liquefaction in individual buckets on foundation behavior under varying seismic spectral characteristics. Figures 10a,b show the scaled peak ground accelerations and fourier amplitude spectra of the four amplitude-adjusted seismic waves.
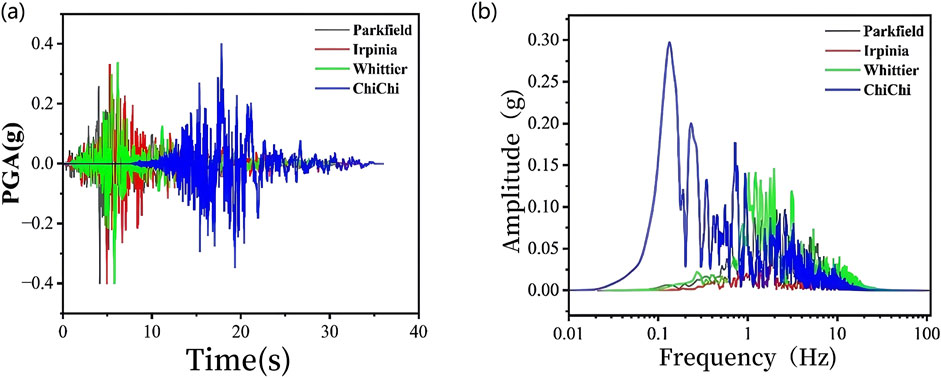
Figure 10. (a) Seismic acceleration, (b) Fourier amplitude spectrum.
To evaluate the liquefaction degree and distribution range of soil within suction buckets, the maximum pore water pressure was measured at 1-m intervals. The excess pore water pressure ratio
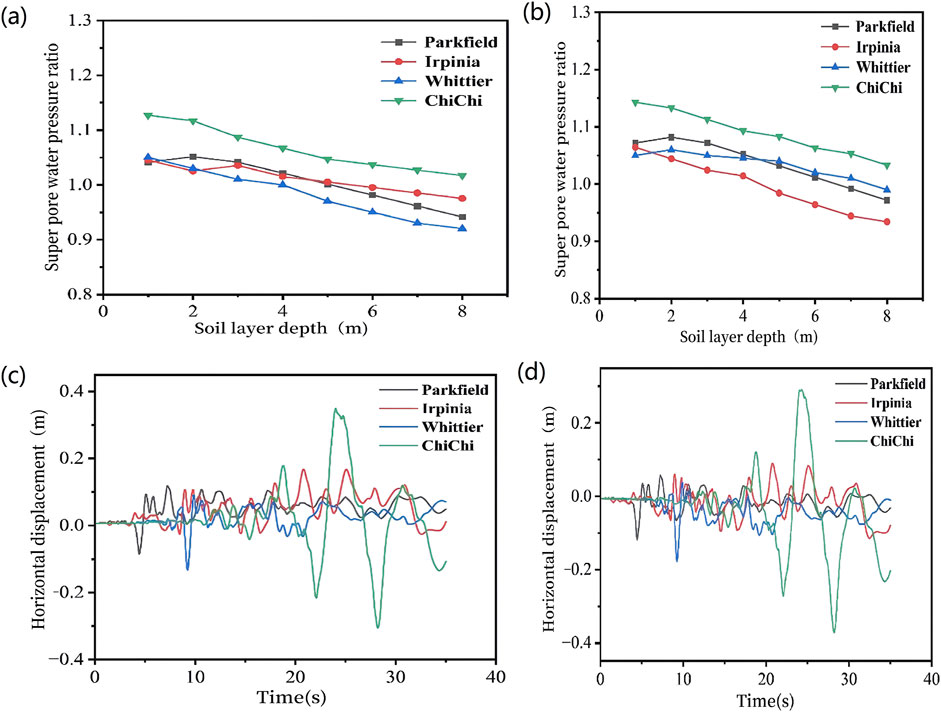
Figure 11. Excess pore water pressure ratio envelope diagram (a) Bucket 2, (b) Bucket 3, and horizontal displacement (c) Bucket 2, (d) Bucket 3.
Figures 11c,d show the horizontal displacements of suction Buckets 2 and 3 under different ground motion inputs, while Figures 12d,e show the vertical settlement time histories of suction Buckets 2 and 3 under four ground motions with distinct spectral characteristics. As shown in these figures, significant variations in both horizontal displacements and vertical settlements are observed among the suction buckets when subjected to ground motions with distinct spectral characteristics. The acceleration time histories and Fourier amplitude spectra differ among the four seismic waves, with the ChiChi ground motion deviating significantly from the other three. It exhibits lower energy and smoother waveforms in the initial phase, but higher energy and denser waveforms in the middle-to-late phases. Consequently, both the degree and spatial extent of soil liquefaction within the suction bucket are more extensive. Specifically, the horizontal displacements and vertical settlements of Buckets 2 and 3 under the ChiChi ground motion exhibit substantially smaller values compared to those induced by the other three seismic waves during the initial phase of shaking, while significantly exceeding them during the middle and later stages. This phenomenon can be attributed to the concentrated energy distribution and higher energy intensity inherent in the ChiChi ground motion, which consequently generates the largest maximum horizontal displacement. As the ground motion progresses, all buckets demonstrate continuously increasing vertical settlement. This observation indicates that ground motions with higher seismic spectral energy and greater energy density induce larger displacements in suction bucket group foundations. Given that all input ground motions maintain identical peak accelerations of 0.4 g, resulting in complete liquefaction of the soil within each bucket, the settlement demonstrates a persistent post-seismic continuation trend after ground motion cessation.
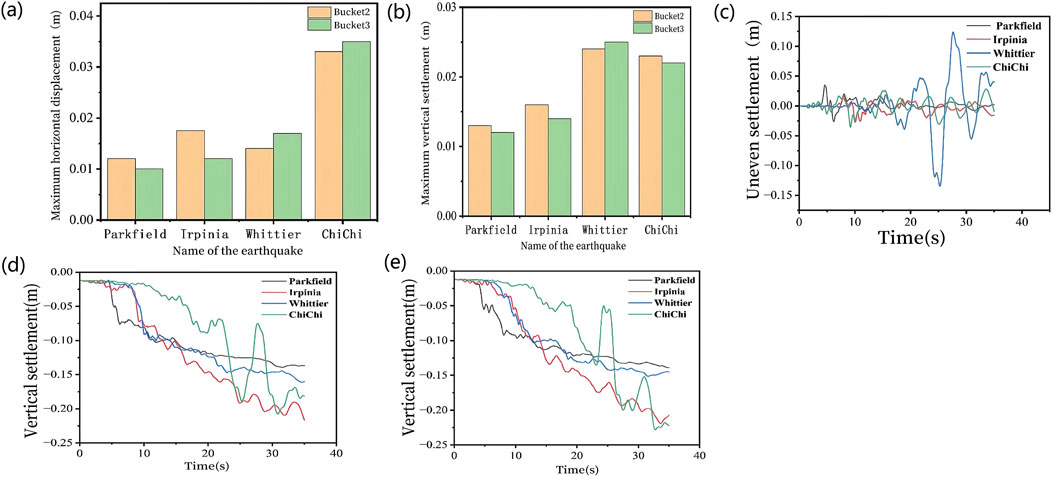
Figure 12. (a) Histogram of maximum horizontal displacement, (b) histogram of maximum vertical settlement, (c) inhomogeneous settlement, and vertical settlement (d) Bucket 2, (e) Bucket 3.
The bar charts illustrating the maximum horizontal displacements of Buckets 2 and 3 under seismic motions with different spectral characteristics and the maximum vertical settlements are shown in Figures 12a,b, respectively. Analysis reveals that the maximum horizontal displacements and maximum vertical settlements of the buckets vary significantly with the spectral characteristics of input ground motions. Notably, ground motions characterized by higher energy content and densely concentrated waveforms tend to generate substantially greater maximum horizontal displacements. Although ground motions with varying spectral properties induce distinct maximum displacements in individual buckets, Buckets 2 and 3 exhibit minimal differences in their maximum horizontal displacements and vertical settlements. This observed similarity is attributed to the symmetric load configuration and the exclusive application of ground motions along the horizontal X-direction, resulting in comparable displacement magnitudes between these two buckets.
Figures 12c shows the differential settlement values under various working conditions obtained through difference calculations of settlement displacement data for suction buckets under ground motions with different spectral characteristics. As shown in figure, the input ground motions with distinct seismic spectral characteristics yield different differential settlement curves for the suction bucket foundation. The ChiChi ground motion exhibits lower energy and gentler waveform characteristics during the initial seismic phase, while demonstrating higher energy and closely spaced waveform patterns during the mid-to-late seismic phase. Consequently, under the ChiChi seismic spectrum characteristics, the differential settlement between Buckets 2 and 3 during the initial earthquake phase was significantly smaller compared to the other three seismic waves. However, during the mid-to-late seismic phase, the oscillation amplitude of differential settlement substantially exceeded that observed under the other three seismic wave conditions.
4.3 Effects of site soil layer liquefaction on foundation displacement
As analyzed in the preceding two sections, the influence of peak ground acceleration (PGA) on soil liquefaction in liquefiable strata significantly outweighs that of ground motion spectral characteristics. This section comparatively examines the displacement patterns of suction bucket foundations in both liquefiable and non-liquefiable sites under Parkfield-02. CA seismic motions with PGAs of 0.1, 0.2, and 0.4 g. For computational simplification, bucket No.1 has been selected as the representative subject for this comparative investigation.
Figures 13a–c shows the time-history curves of horizontal displacement for suction bucket foundations in both liquefiable and non-liquefiable sites under Parkfield-02. CA ground motions with varying peak accelerations. As shown in figure, the horizontal displacements of suction buckets in liquefiable and non-liquefiable sites demonstrate negligible differences under 0.1 g peak ground acceleration (PGA). During the initial phase of ground motion, the horizontal displacements in both site conditions remain nearly identical, with minor discrepancies emerging in the later stages of shaking. When the PGA increases from 0.1 g to 0.2 g, a noticeable disparity in horizontal displacements between the two site conditions becomes evident. As the PGA further escalates to 0.4 g, extensive soil liquefaction occurs within the suction bucket embedded in the liquefiable site. This progressive liquefaction directly results in substantial differential horizontal displacements between the two foundation conditions. Specifically, the complete liquefaction of a significant soil portion inside the suction bucket under liquefiable site conditions critically amplifies displacement contrasts compared to its non-liquefiable counterpart.
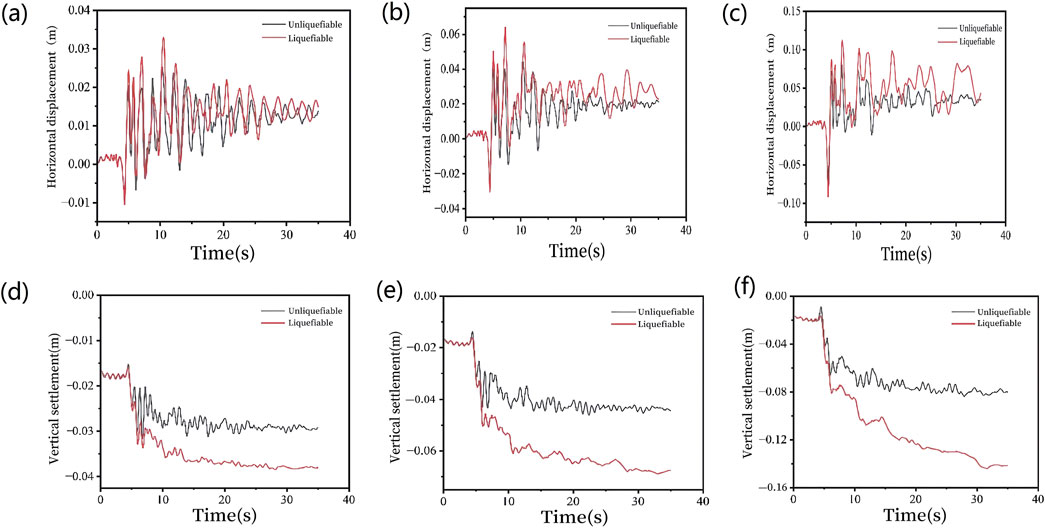
Figure 13. Horizontal displacement under both sites (a) 0.1 g, (b) 0.2 g, (c) 0.4 g, and Vertical displacement under two kinds of sites (d) 0.1 g, (e) 0.2 g, (f) 0.4 g.
Figures 13d–f shows the time-history curves of vertical settlement for the suction bucket foundation in both liquefiable and non-liquefiable sites under Parkfield-02. CA ground motions with different peak ground accelerations (PGA). As shown in figure, when subjected to a PGA of 0.1 g, the maximum vertical settlements of the suction bucket foundation show negligible differences between liquefiable and non-liquefiable sites. As the PGA increases to 0.2 g, the discrepancy in vertical settlement displacements between the two site conditions becomes more pronounced. When the PGA reaches 0.4 g, extensive soil liquefaction occurs within the suction bucket foundation in the liquefiable site, resulting in the maximum difference in vertical settlement displacements between the two site conditions. Soil liquefaction significantly impacts structural settlement behavior, generating notable vertical settlement differences between the two site conditions. The maximum vertical settlement displacement difference is observed at the conclusion of the seismic event.
The maximum horizontal displacements and vertical settlements of suction buckets in both liquefiable and non-liquefiable sites under varying peak ground accelerations (PGA) are systematically shown in Figure 14. As the PGA increases, the differential values of horizontal displacement and vertical settlement between suction buckets embedded in liquefiable and non-liquefiable sites exhibit a progressive enlargement. This phenomenon can be attributed to the intensified liquefaction severity and expanded liquefaction zones within the soil surrounding suction buckets in liquefiable sites under elevated PGA, which substantially compromise the horizontal and vertical stability of the suction bucket foundations.
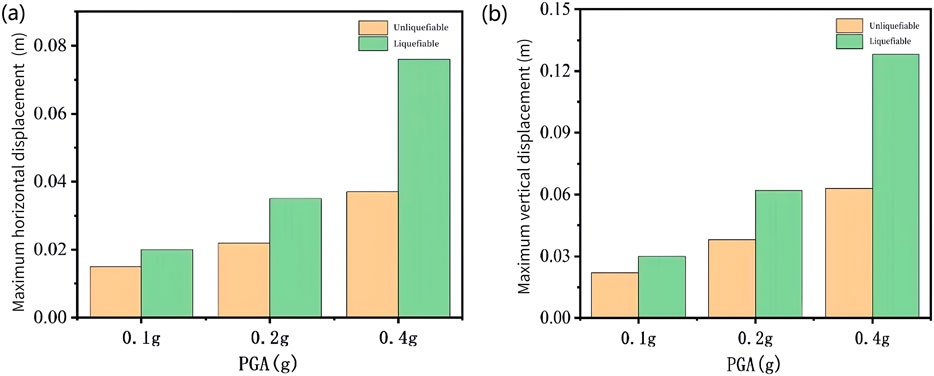
Figure 14. Maximum displacement under both sites (a) Horizontal displacement, (b) Vertical settlement.
5 Conclusion
This study investigates the seismic response characteristics of suction bucket group foundations in the liquefiable sites. Through the development of numerical models and multi-parametric analysis, the research systematically examines the influence of ground motion parameters on the dynamic response of foundations. The principal research findings are summarized as follows:
(1) Under seismic loading, the pore water pressure within the soil inside the suction bucket initially exhibits transient negative values due to shear-induced contraction effects, subsequently shifting to positive pore water pressure as drainage conditions improve. The excess pore water pressure ratio (
(2) The horizontal displacement and vertical settlement of the suction bucket group foundation exhibit distinct patterns under seismic loading, accompanied by the presence of differential settlement. Each suction bucket demonstrates similar variation trends in horizontal displacement corresponding to seismic wave fluctuations, with peak displacements coinciding temporally with maximum seismic accelerations. The maximum overall settlement of the suction bucket group foundation occurs at the earthquake termination phase, while the most severe differential settlement manifests during the seismic excitation process.
(3) The peak ground acceleration (PGA) exhibits a proportional relationship with the horizontal displacement, vertical settlement, and differential settlement of suction bucket foundations. As the PGA increases, these deformation parameters demonstrate corresponding growth. As PGA increases from 0.1 g to 0.4 g, the suction bucket group foundation system exhibits linear amplification of horizontal displacements: Bucket 2 displacement escalates from 0.026 m to 0.111 m, while Bucket 3 increases from 0.02 m to 0.108 m. Concurrently, vertical settlements demonstrate synchronized growth with mean values rising from 0.03 m to 0.14 m. Differential settlement between the two buckets progressively increases from 0.008 m to 0.036 m. Furthermore, under seismic waves with varying spectral characteristics, structural displacements of the suction bucket group foundation intensify with enhanced seismic spectral energy and increased energy density in the input ground motion. Specifically, seismic waves containing higher spectral energy concentrations induce more pronounced foundation displacements. The Parkfield-02. CA ground motion exhibits the lowest spectral energy among the considered excitations, inducing displacements of 0.10 m (horizontal), 0.12 m (vertical settlement), and 0.037 m (differential settlement) in the suction bucket group foundation. Conversely, the ChiChi ground motion demonstrates the highest spectral energy concentration, generating substantially amplified displacements of 0.35 m (horizontal), 0.22 m (vertical settlement), and 0.14 m (differential settlement).
(4) When the seismic amplitude increases, the degree and extent of soil liquefaction inside and around the suction bucket progressively intensify, resulting in a corresponding reduction in the bearing capacity of the surrounding soil. Under various seismic loadings, the displacement variations of the suction bucket embedded in liquefiable sites exhibit significantly greater magnitudes compared to those observed in non-liquefiable sites under identical conditions.
Data availability statement
The original contributions presented in the study are included in the article/supplementary material, further inquiries can be directed to the corresponding author.
Author contributions
XT: Conceptualization, Software, Supervision, Writing – original draft, Writing – review and editing. ZG: Investigation, Validation, Visualization, Writing – review and editing.
Funding
The author(s) declare that no financial support was received for the research and/or publication of this article.
Conflict of interest
The authors declare that the research was conducted in the absence of any commercial or financial relationships that could be construed as a potential conflict of interest.
Generative AI statement
The author(s) declare that no Generative AI was used in the creation of this manuscript.
Publisher’s note
All claims expressed in this article are solely those of the authors and do not necessarily represent those of their affiliated organizations, or those of the publisher, the editors and the reviewers. Any product that may be evaluated in this article, or claim that may be made by its manufacturer, is not guaranteed or endorsed by the publisher.
References
1. Kim HD, Lee GS, Lee KI. Seismic fragility analysis of 5 MW offshore wind turbine. Renew Energy (2014) 65:65250–6. doi:10.1016/j.renene.2013.09.023
2. Wang X, Yang X, Zeng X. Seismic centrifuge modelling of suction bucket foundation for offshore wind turbine. Renew Energy (2017) 114:1013–22. doi:10.1016/j.renene.2017.07.103
3. Zhu F, Bienen B, O'Loughlin C. Suction caisson foundations for offshore wind energy: cyclic response in sand and sand over clay. Géotechnique (2018) 69(10):1–25. doi:10.1680/jgeot.17.p.273
4. Latini C, Zania V. Dynamic lateral response of suction caissons. Soil Dyn Earthquake Eng (2017) 100:10059–71. doi:10.1016/j.soildyn.2017.05.020
5. Bagheri P, Yoon JC, Park D. Numerical analysis of suction bucket foundations used for offshore wind turbines: energy and geotechnics. (2019).
6. Zhang J, Zhang L, Lu X. Centrifuge modeling of suction bucket foundations for platforms under ice-sheet-induced cyclic lateral loadings. Ocean Eng (2006) 34(8):1069–79. doi:10.1016/j.oceaneng.2006.08.009
7. Faizi K, Faramarzi A, Dirar S, Chapman D. Investigating the monotonic behaviour of hybrid tripod suction bucket foundations for offshore wind towers in sand. Appl Ocean Res (2019) 89:89176–87. doi:10.1016/j.apor.2019.05.018
8. Jianxin Z, Wenlong C, Xinglei C. Seismic responses analysis of suction bucket foundation for offshore wind turbine in clays. Ocean Eng (2021) 232. doi:10.1016/j.oceaneng.2021.109159
9. Negro V, Lopez-Gutierrez J, Esteban DM, Matutano C. Uncertainties in the design of support structures and foundations for offshore wind turbines. Renew Energy (2014) 63:125–32. doi:10.1016/j.renene.2013.08.041
10. Kaynia MA. Seismic considerations in design of offshore wind turbines. Soil Dyn Earthquake Eng (2019) 124:124399–407. doi:10.1016/j.soildyn.2018.04.038
11. Yu H, Zeng X, Li B, Lian J. Centrifuge modeling of offshore wind foundations under earthquake loading. Soil Dyn Earthquake Eng (2015) 77:402–15. doi:10.1016/j.soildyn.2015.06.014
12. Xiaobing L. Centrifugal experimental study of suction bucket foundations under dynamic loading. Acta Mechanica Sinica (2007) 06(23):97–106. doi:10.1007/s10409-007-0100-7
13. Zhang P, Ding H, Le C. Seismic response of large-scale prestressed concrete bucket foundation for offshore wind turbines. J Renew Sustainable Energy (2014) 6(1):013127. doi:10.1063/1.4863986
14. Ding H, Xiong K, Zhang P. Seismic response of offshore wind structure supported by bucket foundation. Trans Tianjin Univ (2016) 22(4):294–301. doi:10.1007/s12209-016-2630-1
15. Ibsen L. Bo. Transient analysis of monopile foundations partially embedded in liquefied soil. Geomechanics Eng (2015). doi:10.12989/gae.2015.8.2.257
16. Nicosia GLD. Seismic design of monopile supported offshore wind turbines in presence of extensive liquefaction. (2016).
17. Zhang JF, Yu C, Su DS. Wave-induced seabed liquefaction around the composite bucket foundation of offshore wind turbines. In: International Ocean and polar engineering conference. Kona, Hawaii: International Society of Offshore and Polar Engineers (2015).
18. Patra S, Haldar S. Seismic response of monopile supported offshore wind turbine in liquefiable soil. Structures (2021) 31:248–65. doi:10.1016/j.istruc.2021.01.095
19. Esfeh PK, Kaynia AM. Numerical modeling of liquefaction and its impact on anchor piles for floating offshore structures. Soil Dyn Earthquake Eng (2019) 127:105839. doi:10.1016/j.soildyn.2019.105839
20. Xuefei W, Chengliang M, Jiale L. Seismic response of suction bucket foundation for offshore wind turbines: a parametric study. Ocean Eng (2022) 257. doi:10.1016/j.oceaneng.2022.111570
21. Papanikolaou VK, Kartalis-Kaounis T, Protopapadakis E. A new graphical user interface for OpenSees. In: 1st European conference on OpenSees (2017).
Keywords: suction bucket group foundation, seismic dynamic response, liquefaction site, influencing factors, OpenSees
Citation: Tao X and Gao Z (2025) Study on seismic response characteristics of the suction bucket group foundation in liquefiable sites. Front. Phys. 13:1627649. doi: 10.3389/fphy.2025.1627649
Received: 13 May 2025; Accepted: 02 July 2025;
Published: 15 July 2025.
Edited by:
Yifei Sun, Taiyuan University of Technology, ChinaReviewed by:
Xiaodong Ni, Hohai University, ChinaZhigao Dong, Nanjing Vocational Institute of Railway Technology, China
Copyright © 2025 Tao and Gao. This is an open-access article distributed under the terms of the Creative Commons Attribution License (CC BY). The use, distribution or reproduction in other forums is permitted, provided the original author(s) and the copyright owner(s) are credited and that the original publication in this journal is cited, in accordance with accepted academic practice. No use, distribution or reproduction is permitted which does not comply with these terms.
*Correspondence: Xiaosan Tao, dHhzMzg4MEAxMjYuY29t