- 1School of Economics and Management, Xidian University, Xi’an, China
- 2Desautel Faculty of Management, McGill University, Montréal, QC, Canada
With the deep application of Internet of Things (IoT) technology in the financial field, the transmission, storage and processing of massive financial data face complex and diverse security threats. This paper proposes a threat detection scheme, CNN - BiLSTM - GAM, which is based on the vulnerabilities of IoT devices in financial big data scenarios and deep learning algorithms. By analyzing the traffic data and behavioral patterns generated by IoT devices during data collection and other processes, it extracts key features and identifies security threats such as malicious attacks. CNN-BiLSTM-GAM includes Convolutional Neural Network (CNN), Bidirectional long short-term memory (BiLSTM) and global attention module (GAM), which accurately extract spatial features of input financial data through one-dimensional convolutional neural network (1D-CNN). At the same time, BiLSTM layer captures the context dependency relationship in time series data through forward and backward networks. It optimizes the extraction of temporal features, finally assigns weights to input features through the global attention obtained by concatenating channel attention and spatial attention. The experimental results show that CNN-BiLSTM-GAM performs well with 96.81% of ACC and 96.79% of F1 on NSL-KDD, 96.98% of ACC and 96.46% of F1 on CICIDS2017, demonstrating better spatiotemporal feature extraction capabilities and providing technical support for ensuring the security of financial big data.
1 Introduction
Driven by the wave of digitization, the financial industry is undergoing unprecedented changes. The IoT technology, with its powerful device interconnection and data collection capabilities, deeply integrates with financial big data. It injects new vitality into financial service model innovation, risk management optimization and customer experience improvement [1]. However, with the widespread deployment of IoT devices in the financial sector, massive financial data is facing increasingly severe security threats during transmission, storage and processing. IoT threat detection technology has become a key factor in ensuring the stable operation and data security of the financial industry, conducting in-depth research on it thus has important practical significance.
In recent years, the global financial industry has accelerated its transformation towards digitization and intelligence, with IoT technology playing an indispensable role. However, the widespread use of IoT devices has also brought many security risks. IoT devices typically have limited resources, storage capacity and network bandwidth, making it difficult to deploy complex security measures. In addition, IoT devices often have security vulnerabilities and configuration flaws during production, deployment and use, making them easy targets for attackers [2, 3].
Financial big data has the characteristics of large data volume, diverse types, high value density and strong timeliness. In the context of the integration of the IoT and finance, the sources of financial big data are more extensive, including not only traditional transaction data and customer information, but also various perceptual data collected by IoT devices. These data contain a large amount of sensitive information, such as user identity information, account passwords, transaction records, etc. Once leaked or tampered with, it causes huge losses to financial institutions and users [4, 5].
In the integration of financial big data and IoT, traditional threat detection technologies are facing new challenges. On the one hand, the diversity and complexity of financial big data require threat detection technologies to be able to handle various types of data. On the other hand, the real-time nature of financial services requires threat detection systems to be able to quickly and accurately detect threats and respond promptly. In addition, the financial industry has extremely high requirements for data security and privacy protection, threat detection technology needs to effectively detect security threats without leaking user privacy.
The IoT threat detection technology mainly includes rule-based detection methods [6], machine learning based detection methods [7] and deep learning based detection methods. The rule-based detection method uses pre-defined security rules to determine whether the behavior of IoT devices is abnormal. But the formulation of rules relies on expert experience, making it difficult to adapt to constantly changing attack methods and has a high false positive and false negative rate. However, machine learning methods require manual feature extraction, have high requirements for feature engineering, perform poorly when dealing with high-dimensional and complex data.
Among the existing IoT threat detection technologies, deep learning has demonstrated unique advantages and enormous potential, which is highly compatible with the needs of financial big data and IoT threat detection. The data generated in the financial IoT environment includes various forms such as device logs, transaction records, sensor perception data, etc. It includes structured transaction amounts, timestamps and other information, as well as unstructured text logs and image video data. The powerful feature extraction ability of deep learning can effectively mine the potential patterns and correlations in these data, providing rich and accurate feature information for threat detection.
In practical applications, different deep learning algorithms play their respective roles in financial IoT threat detection scenarios. CNNs perform excellently in processing spatially structured data such as images, videos, vectorized network traffic data due to their local connections and weight sharing characteristics [8]. In the financial IoT, CNN can be used to analyze traffic images generated during device communication, identify abnormal traffic patterns, such as detecting malicious traffic attack features through two-dimensional image processing of network traffic. Recurrent Neural Networks (RNNs), their variants Long short-term memory networks (LSTMs) and Gated Recurrent Units (GRUs) are adept at handling data with temporal dependencies [9, 10]. Financial transaction data and status data of IoT devices both have obvious time series characteristics. RNNs and their variants can capture the changing patterns of data in the time dimension, learn the temporal patterns of normal transactions and device operation. It can detect abnormal behavior that deviates from the normal pattern, such as identifying sudden abnormal changes in transaction frequency or abnormal fluctuations in device status and timely discovering potential threats.
Although existing deep learning methods have some progress in IoT threat detection, there are still three key limitations. One reason is that spatiotemporal feature fusion is mostly shallow concatenation, without considering the dynamic evolution of spatial features over time. Secondly, attention mechanisms often adopt a single channel or parallel fusion mode, making it difficult to guide local feature learning through global dependencies. The third issue is the insufficient ability to detect a few high-risk threats in financial scenarios. The aim of this paper is to conduct a comprehensive analysis of security threats in the integration of financial big data and the IoT. By leveraging the advantages of deep learning, efficient and accurate IoT threat detection techniques can be developed to provide reliable technical support for the security of financial big data and promote the safe development of the financial industry. Our main contributions are summarized as follows.
1. This paper proposes a threat detection method that integrates BiLSTM and provides a detailed description of the data preprocessing process, including one-hot encoding and data normalization. CNN-BiLSTM-GAM achieves interactive learning of spatial local features and temporal dynamic trends through deep coupling of 1D-CNN and BiLSTM.
2. The structure of CNN-BiLSTM-GAM includes 1D-CNN, BiLSTM and GAM. The 1D-CNN is responsible for extracting spatial features of input financial big data, while BiLSTM focuses on capturing dynamic features of time series data.
3. In the experiment, it is verified that CNN-BiLSTM-GAM has better spatiotemporal feature extraction capabilities and can effectively improve the detection of IoT threats in financial big data.
The rest of this paper consists of four parts. Section Ⅱ is related literature. Section Ⅲ provides a detailed introduction to the IoT threat detection model based on CNN-BiLSTM-GAM. Section Ⅳ designs comparative experiments for analysis based on multiple baselines. Finally, Section Ⅴ is the summary.
2 Literature review
With the surge of IoT data and the emergence of unknown attacks, IoT threat detection technology has been widely studied. Mahapatra et al. [11] proposed an adaptive threat detection technique by introducing data mining concepts and techniques. Applied in wireless ad hoc networks, this technology utilized data mining algorithms to extract features from network traffic data and used machine learning models for threat detection. Baig et al. [12] proposed a multi class neural network model based on a cascaded structure. This model converted the input network traffic data into feature vectors and used multiple cascaded neural networks for classification. Each cascaded neural network focused on different types of network attacks and made classification decisions based on their unique features. Al-Sarayrah et al. [13] proposed the Healthcare Analytics and Insight Framework (HAIF), in which the Apriori algorithm can find meaningful connections and trends in healthcare data. Polat et al. [14] proposed a multi-stage learning model using a 1-dimensional convolutional neural network (1D-CNN) and decision tree-based classification and validated its effectiveness and advantages. Ilhan et al. [15] introduced a switch port anomaly-based intrusion detection system (SPA-IDS) and proposed a new automated threat classification model. The method provided an effective and fast IDS approach to prevent attacks from the network by analyzing data packets received at the second layer. Jmila et al. [16] evaluated seven shallow classifiers and found that different attacks have varying impacts on different classifiers. The robustness of classifiers depended on the type of attack, a balance between performance and robustness needed to be considered in network threat detection scenarios. Martins et al. [17] presented a review and unresolved issues regarding the anomaly detection of host-based threat detection systems in IoT. It explored methods and techniques for threat detection using host information in IoT environment. Huang et al. [18] introduced an incremental lifecycle learning-based intrusion detection system (ILL-IDS) for VANETs. The system used incremental lifecycle learning to improve the effectiveness of threat detection. The system constructed a threat detection model by learning the characteristics and behavioral patterns of the samples. By utilizing incremental learning techniques to continuously update models to address new forms of threats, the effectiveness of threat detection had been improved.
As an emerging technology in the area of machine learning, deep learning had demonstrated outstanding capabilities in network threat detection. Zhang et al. [19] proposed a method that combines multi-scale CNNs with LSTMs to automatically extract temporal and spatial features of network traffic data. By expanding the network width, the ability to represent spatial features had been enhanced, making feature extraction more efficient and accurate. This method effectively utilized the spatial perception advantage of CNN and the time series processing capability of LSTMs, providing a powerful technical means for complex network traffic analysis. Yao et al. [20] proposed a network threat detection method that combines CNN and LSTM to achieve cross layer feature fusion. CNN was used to capture global features, while LSTM processed periodic features of time series. The fusion of the two enhanced the model’s ability to identify network threats, not only improving feature processing efficiency but also optimizing the model’s adaptability to complex threat patterns, significantly improving recognition accuracy. Lan et al. [21] proposed a multi task learning based model that combines a memory enhanced autoencoder and a prototype network. The introduction of these two structures into CNN not only enhanced the discriminative ability of data features, but also improved the robustness of the model, making it more effective and accurate in detecting network threats. This method of integrating mixed deep features demonstrated its powerful ability to handle and identify threat behaviors in complex network environments. Hacılar et al. [22] combined a Deep Autoencoder (DAE)-based, vectorized and parallelized ABC algorithm for training feed-forward artificial neural networks, which was tested on the UNSW-NB15 and NF-UNSW-NB15-v2 datasets, achieving good classification performance for malicious behavior. Wu et al. [23] found that deep neural networks perform better in data learning and generalization ability compared to shallow neural networks. It integrated CNNs and GRUs into a sub residual network framework, utilizing stacked residual modules to deeply explore the deep features of the data. The design enabled the model to effectively capture spatiotemporal features in network traffic data, improving the efficiency of network threat detection. This method demonstrated the powerful potential of deep learning in complex pattern recognition scenarios, especially when dealing with network security issues with time series dependencies. Zha et al. [24] combined CNNs and LSTMs to classify using spatiotemporal features and extracted features using multiple convolution kernels of different sizes, effectively improving the accuracy of classification. Su et al. [25] proposed an image segmentation algorithm based on deep learning. This algorithm combined convolutional neural networks with conditional random fields and had been tested on multiple public datasets, achieving better segmentation accuracy than traditional methods.
IoT security, cryptographic methods, 0 day attack detection and data imbalance challenges were directly related to IoT threat detection. Gabr et al. [26] proposed a memristive coupled neural network for secure data management, offering insights into advanced cryptographic methods that strengthened the security narrative of IoT-based financial data. Alexan et al. [27] demonstrated the use of hyperchaotic maps for data protection, highlighting novel encryption mechanisms relevant to safeguarding sensitive IoT-financial datasets. Dai et al. [28] presented a framework for detecting 0-day attacks in unseen datasets, reinforcing the need to evaluate model robustness against emerging and previously unobserved IoT threats. Yee et al. [29] provided a comprehensive review of AI methods for 0-day detection, supporting the manuscript’s emphasis on AI-driven security models and helping contextualize existing limitations. Okmi et al. [30]offered a taxonomy of large-scale mobile data analysis techniques, providing valuable parallels to IoT-financial data handling and threat detection. Ainan et al. [31]discussed handling class imbalance in financial prediction tasks, directly relevant to the imbalance challenges noted in NSL-KDD and CICIDS2017 datasets.
3 Research on threat detection technology for financial big data
3.1 Financial big data preprocessing based on IoT
In actual financial big data sets, data quality issues such as missing information, redundant data and inconsistent data types are often encountered. The purpose of data preprocessing is to convert these raw data into a format that algorithms can effectively process, in order to improve the efficiency of model training and the accuracy of predictions. The key steps of data preprocessing include but are not limited to one-hot encoding and data normalization techniques.
The one-hot encoding is a commonly used method for handling discrete features, which converts categorical variables into sparse binary matrices that are easier for the algorithm to handle, helping the model to more effectively parse categorical information. Data normalization is the process of adjusting the data scale to unify the range of values for all features into a fixed interval, such as [0,1] or [-1,1]. This step can reduce the bias caused by scale differences between different IoT data features, while accelerating model convergence and improving generalization ability.
3.1.1 One-hot encoding
In financial big datasets, it is common to encounter situations that contain non numerical features, while most models can only handle numerical features. Therefore, converting non numerical features into numerical features is an important step in data preprocessing.
In this conversion process, one-hot encoding is a commonly used method. Compared to label encoding, one-hot encoding has its obvious advantages. One-hot encoding transforms category features by creating a new binary column for each category, ensuring that the model does not misinterpret the numerical order or distance between categories. The model can clearly distinguish each category without mistakenly confusing numerical values with a certain order or level. On the contrary, label encoding maps each category to an integer value, where all categories are represented as different numbers in the same column. Although this method is highly efficient in handling certain category features with a clear order, when dealing with category features without a fixed order, the model may mistakenly believe that the size of the numbers represents a certain order between categories, thereby affecting the model’s understanding of the data and the final classification accuracy. Therefore, for ensuring the accuracy and effectiveness of the model, choosing one-hot encoding instead of label encoding is a more suitable method when dealing with nominal category features. This not only avoids misunderstandings of data by the model, but also improves the accuracy of the model when processing complex financial big data.
3.1.2 Normalization
In the preprocessing stage of financial big data in IoT, the scale difference in processing feature data is crucial because it directly affects the training speed and accuracy of the model. Features from different dimensions often have significant differences in magnitude. And if not properly processed, it may lead to low training efficiency and limited improvement in model accuracy. Therefore, data normalization has become an effective means to solve the problem of scale differences. By adjusting the scale of feature data, normalization can significantly improve the convergence speed of the algorithm and the overall performance of the model. Adopting maximum and minimum normalization is one of the commonly used methods for handling scale differences in data. This method adjusts the eigenvalues to a standard range between 0 and 1, in order to standardize the data scale. The specific calculation is shown in Equation 1.
Among them,
This normalization process not only standardizes the scale of financial big data, but also maintains the relative relationships in the data. By applying maximum and minimum normalization, it is possible to effectively avoid model training instability caused by significant differences in feature scales, making the model easier to train and accelerating its convergence speed, thus achieving better performance in practical IoT threat detection applications.
3.2 IoT threat detection model based on CNN-BiLSTM-GAM
3.2.1 Overview of CNN-BiLSTM-GAM
Existing deep learning research still has significant limitations. Firstly, spatiotemporal feature fusion often stays at the shallow level of concatenation, where the spatial features extracted by convolutional neural networks are directly connected to the temporal features captured by recurrent neural networks. The lack of consideration for the dynamic changes in spatial features over time has resulted in the disconnection of the intrinsic correlation between device traffic characteristics and trading periods in financial data. Secondly, there are shortcomings in the application of attention mechanisms, as some studies only use single channel attention and can only focus on the importance of channel dimensions. Although some studies attempt to combine channel and spatial attention, a parallel fusion mode is adopted, which cannot achieve guidance of local details through global dependencies. At the same time, the lack of effective response strategies for rare but highly harmful threat samples in financial scenarios results in poor detection performance for such threats.
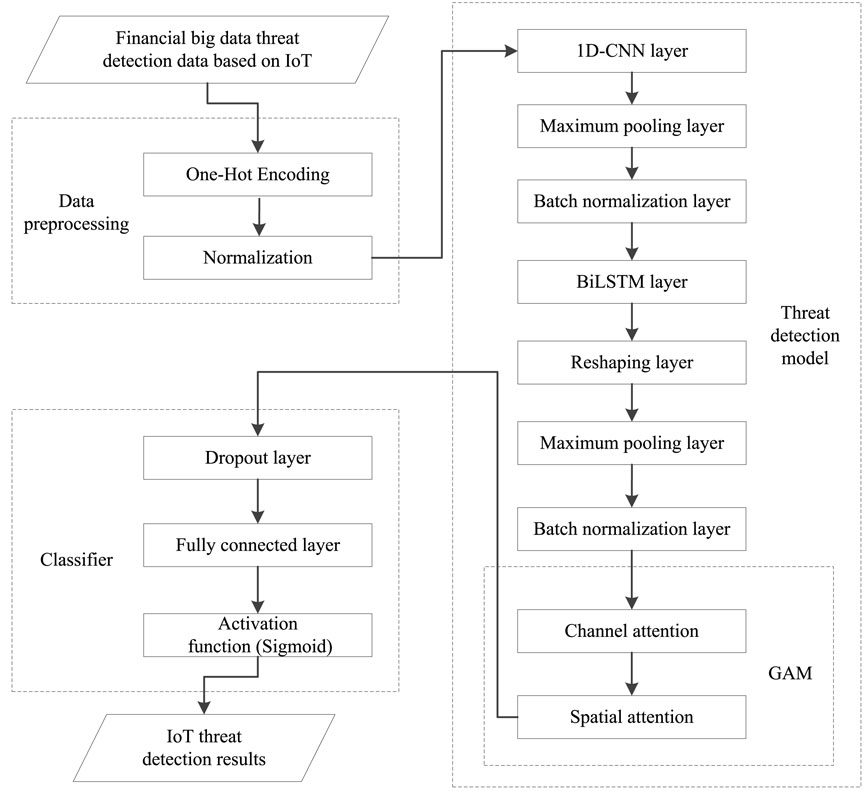
CNN-BiLSTM-GAM combines 1D-CNN and BiLSTM for processing and analyzing complex IoT data. Its overall architecture is shown in Figure 1. This multi-level and multi technology architecture enables the model to not only effectively handle the multidimensional characteristics of financial big data, but also capture complex relationships in IoT data, thereby improving the accuracy of classification and detection. Figure 1 shows the process of the threat detection model, which includes the proposed 1D-CNN, BiLSTM and GAM.
CNN-BiLSTM-GAM extracts spatial features of financial data using 1D-CNN and captures local features through two-layer convolution combined with batch normalization and max pooling. The two-layer convolution consists of 32 1 × 3 kernels and 64 1 × 3 kernels, respectively. Qazi et al. [32] pointed out in network intrusion detection that 1 × 3 convolutional kernel can effectively extract local correlations between adjacent three features, which is superior to 1 × 1 (insufficient feature interaction) and 1 × 5 (introduction of redundant noise). The hidden dimension of the BiLSTM layer is 128, capturing the before and after dependencies of the time series. Orthogonal initialization and forget gate bias optimization enhance training stability. Nazir et al. [33] used BiLSTM hidden layer dimension 128 in IoT threat detection, believing that this dimension can fully learn the temporal correlation between device states and attack patterns without significantly increasing computational complexity. The channel attention of GAM generates weights through MLP, combines spatial attention with grouped convolution and channel shuffling to solve the problem of separating global and local features in traditional attention. Finally, the classification results are output through a fully connected layer and Softmax, supplemented by L2 regularization and dropout to suppress overfitting.
1. Data preprocessing layer. The main tasks of the preprocessing layer include data cleaning and standardization to ensure the consistency of the input financial big data. At this stage, the classification data is first converted into numerical binary variables using the one-hot encoding method, so that the algorithm can more effectively handle non numerical category data. Next, all feature values are scaled to a range of 0 to 1 through data normalization to eliminate the impact of different data levels, promote algorithm convergence speed and improve model performance.
2. Model threat detection layer. This layer constitutes the core of CNN-BiLSTM-GAM, combining 1D-CNN, BiLSTM and attention mechanisms to balance spatial and temporal data analysis. The 1D-CNN effectively extracts spatial features through its specialized structure, while BiLSTM optimizes the processing of time series data, enabling the model to comprehensively learn the spatial and temporal information of IoT data.
CNN-BiLSTM-GAM forms unique value through multidimensional innovation based on the classic architecture. Its core innovation is reflected in the design of GAM, which is different from existing single dimensional or parallel fusion attention patterns. GAM adopts a channel to space sequential enhancement logic, first incorporating spatial dimension information into channel weight learning. By using grouped convolution to enhance spatial local focus, the problem of separating global and local features in traditional attention is solved. At the same time, max pooling is removed and a large convolution kernel is used to cope with high-frequency noise in financial data. Based on the characteristics of financial IoT scenarios, CNN-BiLSTM-GAM integrates multimodal features such as device identity, transaction behavior and network traffic, dynamically adjusts the weighted loss function and attention weight to enhance the detection capability of rare but high-risk minority threats. This makes the model more in line with the threat detection requirements of the alloy fusion IoT, breaking through the limitations of existing general models in global and local collaboration, spatiotemporal fusion depth and scene adaptability.
3.2.2 Threat detection module
This module integrates 1D-CNN and BiLSTM, aiming to improve the accuracy of sequence data processing for finance. It mainly consists of a feature extraction module and a classification module. Furthermore, the feature extraction module is refined into three key sub modules, namely, the spatial feature extraction module, the temporal feature extraction module and GAM.
In the feature extraction stage, the spatial feature extraction module first effectively captures spatial correlations in financial oriented sequence data through 1-DCNN. This network structure utilizes the local connections and weight sharing mechanism of convolutional layers, which not only significantly reduces the parameters of CNN-BiLSTM-GAM, but also accurately extracts key spatial features. Subsequently, the temporal feature extraction module conducts in-depth analysis of the time dimension characteristics of financial oriented sequence data through the BiLSTM layer. The design of BiLSTM enables the model to simultaneously learn the forward and backward information of the sequence, comprehensively capturing the time series dynamics in IoT data. To further enhance the feature extraction capability of CNN-BiLSTM-GAM, the attention mechanism is used to ensure computational overhead. After feature extraction is completed, the classification module is responsible for converting the extracted features into specific threat security classification results. The design of this module fully considers the characteristics of financial oriented sequential data, as well as the impact of features extracted from the two dimensions of space and time on the final classification task.
3.2.2.1 Spatial feature extraction submodule
The design of this module adopts 1D-CNN and max pooling layers to achieve the characteristics of parameter sharing, spatial arrangement and local perception, thereby efficiently extracting key features from time series data. This submodule effectively reduces the computational costs of CNN-BiLSTM-GAM by utilizing the structural characteristics of 1D-CNN layer. The parameter sharing mechanism enables multiple neurons in the network to share the same weights, which not only significantly reduces the number of parameters in CNN-BiLSTM-GAM, but also simplifies the complexity of the model, thereby reducing the computational burden during model training and inference. The 1D-CNN layer captures and combines local spatial patterns on the input feature map by moving along the window and performing convolution operations to form a sparse feature matrix. Each matrix element represents the degree of correlation between different features, enabling CNN-BiLSTM-GAM to extract more effective and representative features from the IoT for financial big data.
In addition, the 1D-CNN layer uses ReLU activation function, which helps to introduce non-linear processing capability [32], enabling CNN-BiLSTM-GAM to learn more complex and deep level data representations. The max pooling layer following the 1D-CNN layer further reduces the computational complexity of CNN-BiLSTM-GAM by reducing the dimensionality and number of parameters of the feature map. At the same time, it retains the most significant feature information, effectively preventing overfitting and providing the possibility for accelerating the training of CNN-BiLSTM-GAM. The calculation formula is shown in Equation 2.
The
3.2.2.2 Temporal feature extraction submodule
In LSTM, there are three state stages, namely, forget stage, select memory stage and output stage. This stage selectively outputs [33] and the calculation process is in Equations 3–8.
In this context,
However, for most text related tasks, LSTM requires neural networks to rely on contextual information and a key discrimination may be determined by multiple inputs before and after. Therefore, BiLSTM is proposed. The BiLSTM plays a crucial role in the CNN architecture, with the max pooling layer playing a crucial role. Its main function is to simplify network computation by reducing the spatial dimension of feature maps, effectively capture core information in the IoT for financial big data by selecting the most significant features. This operation not only significantly reduces the computational load of CNN-BiLSTM-GAM, but also helps alleviate overfitting problems, thereby enhancing the generalization ability of CNN-BiLSTM-GAM.
To further optimize network performance, the introduction of batch normalization layers become a routine part of the CNN intermediate layer. This technology normalizes the input of each batch of data and the standardized IoT data is conducive to gradient flow in the network, thereby enabling the model to maintain stable response to subtle changes in the input of financial big data oriented IoT. This accelerates the speed of the entire training process, significantly improving the stability of the model. When processing financial oriented sequential data, the BiLSTM layer, as a component of CNN-BiLSTM-GAM, typically requires the introduction of a reshaping layer to adjust the data format to meet the input requirements of subsequent BiLSTM layers. The design of this reshaping layer ensures seamless transition of data from one layer to another, allowing CNN-BiLSTM-GAM to further explore and learn long-term dependencies of IoT data, optimizing the efficiency of data flow transmission in the network. The BiLSTM layer is used to simultaneously learn the features of forward and backward time series data, consisting of two units. One unit processes forward time series, while the other unit processes backward time series. This design allows the network to obtain information about past and future data at each time step, improving its modeling ability and prediction accuracy for long-term time series data. Each unit has the same input and is connected to the same output. This arrangement allows the network to consider both past and future data at each time step, thereby better learning features to improve training performance.
3.2.2.3 GAM
Hu et al. [34] designed a Squeeze and Excitation (SE) module, which could be easily incorporated into CNNs to capture more critical feature information in the channel direction. In addition, Zhu et al. [35] studied that the Convolution Block Attention Module (CBAM) could find the most important parts of the network for processing. In addition to focusing only on spatial domain information, the Convolution Block Attention Module (CBAM) proposed by Woo et al. [36] could simultaneously focus on spatial domain features and channel domain features. By concatenating, the learned weights were assigned to the feature maps in both channel and space, effectively improving the network’s ability to extract attention region features. CNN-BiLSTM-GAM designs GAM based on the CBAM module for use in the network.
The core differences between GAM and CBAM are reflected in the fusion mechanism, feature processing methods and computational efficiency. GAM adopts a sequential fusion strategy of “channel to space”, gradually focusing on features from global to local, while CBAM adopts a parallel fusion mode where channels and spaces are independently processed and added element by element. In terms of channel attention, GAM captures cross dimensional global dependencies through three-dimensional arrangement and two-layer MLP, while CBAM only relies on global pooling and single-layer MLP to model channel relationships. In terms of spatial attention, GAM introduces grouped convolution and channel shuffling to avoid information loss caused by pooling. While CBAM relies on average or maximum pooling plus standard convolution, which poses a risk of detail loss. In terms of computational efficiency, GAM reduces the parameter size through grouped convolution, which is significantly better than the standard convolution structure of CBAM. In addition, GAM’s feature focusing mode emphasizes global consistency and preserves spatial structural information through three-dimensional arrangement, while CBAM focuses on local details and is prone to losing temporal features due to pooling compression.
4 Experiment and result analysis
4.1 Experimental setup
This paper uses the Intel (R) Core (TM) i7 - 8550U CPU @ 1.80 GHz. The experiment is carried out on a PC with 16.00 GB of memory, which is installed with the Windows 11 operating system. It uses Python 3 as the main programming language and develops on the Anaconda platform.
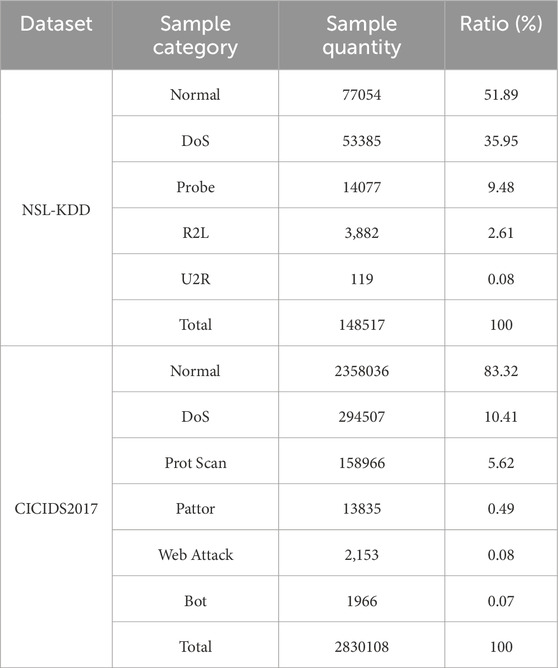
This paper uses the NSL-KDD dataset [37] and CICIDS2017 dataset [38] as experimental data. NSL-KDD is designed to solve the problems in the KDD Cup 99 dataset and is one of the widely used datasets in the area of network security research, especially suitable for research on network threat detection. CICIDS2017 is jointly developed by the Canadian communications security agency and the Canadian institute for cybersecurity, providing a testing platform that includes real network traffic data. This dataset not only covers normal background traffic, but also records various signs of malicious activity in detail. The quantity and proportion of each category of NSL-KDD and CICIDS2017 are shown as in Table 1.
The performance of models is comprehensively evaluated using multidimensional evaluation indicators, including accuracy (ACC), recall (REC), F1 score (F1) and precision (PRE) [39]. The calculation of indicators is based on four core parameters, they are true positive (TP), true negative (TN), false positive (FP) and false negative (FN).
ACC is defined as the proportion of correctly classified samples to the total number of samples and is a fundamental indicator for evaluating the overall performance, as shown in Equation 9.
REC, also known as True Positive Rate (TPR), refers to the proportion of abnormal samples correctly identified by the model to the total number of actual abnormal samples. This indicator reflects the sensitivity and effectiveness of the model in identifying threat situations, as shown in Equation 10.
F1 is a performance indicator that comprehensively reflects the ACC and REC. By balancing these two factors, it provides a comprehensive evaluation, as shown in Equation 11. PRE is shown in Equation 12.
However, there is a serious class imbalance problem in datasets, such as the U2R class accounting for only 0.08% in NSL-KDD and the Normal class accounting for 83.32% in CICIDS2017. To avoid misleading results caused by majority class dominance in high ACC and REC, a mixed sampling mechanism is adopted during the training phase. For minority classes such as U2R in NSL-KDD and Web Attack in CICIDS2017, SMOTE oversampling is used. SMOTE randomly selects samples from the k-nearest neighbors of each minority class sample and generates synthetic samples, which not only avoids overfitting caused by simply copying samples, but also preserves the distribution characteristics of minority classes. By synthesizing new samples to avoid overfitting caused by simple replication, the number of neighbors is set to 5. For most classes, such as Normal, random undersampling is used to preserve the core distribution features. After sampling, the ratio of majority classes to minority classes is controlled at 3:1 to balance the training sample size of each classification. By randomly removing some samples to reduce the amount of data, while ensuring the preservation of the core distribution pattern of the majority of classes, the weights of each class in training are effectively balanced.
Both datasets are divided using random stratified sampling, with the core principle being to maintain the same proportion of categories in each subset as the original dataset, in order to avoid missing minority classes in a subset due to sampling bias. The specific division ratio is 70% for the training set, 10% for the validation set and 20% for the testing set. The complete dataset is layered by category, where each category is treated as a separate subset. Then, within each subset, random sampling is used to allocate samples in a ratio of 7:1:2 to the training, validation and testing sets. Finally, all sub samples of each category are merged to form three sets. The reason for choosing random stratified sampling instead of time partitioning is that the core difference between NSL-KDD and CICIDS2017 lies in the type of attack rather than time distribution. Threat detection models need to have generalization ability for various types of attacks, rather than only adapting to patterns within specific time windows. At the same time, stratified sampling can avoid the problem of excessive sparsity of minority samples in the test set that may be caused by random sampling, ensuring that the evaluation indicators can truly reflect the model’s ability to recognize all categories.
In terms of input data dimensions, each sample of NSL-KDD contains 41 dimensional features after preprocessing. Among them, 34 dimensions are numerical features, seven dimensions are categorical features and they are expanded to 122 dimensions through one-hot encoding. The length of the time series is set to 30, which means that every 30 consecutive samples form an input sequence, suitable for sliding window processing in 1D-CNN. Zhang et al. [19] validated in network traffic time-series modeling that a window length of 30 can balance short-term burst patterns and computational costs, outperforming 10 (incomplete information) and 50 (increased redundancy).
The original feature of CICIDS2017 is 78 dimensions, including traffic packet size, protocol type, etc. After hot encoding and normalization, it is extended to 186 dimensions and the time series length is also set to 30. Cross validation adopts a 5-fold hierarchical cross validation method, which further divides subsets within the training set. Each validation maintains the same category ratio as the original data and the final model performance is taken as the average of five validations to reduce sampling bias.
4.2 Ablation experiment
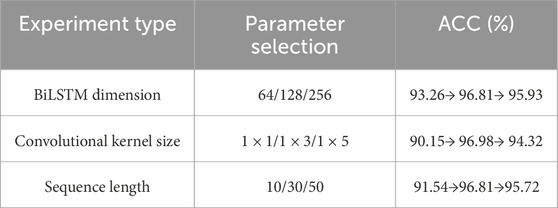
The empirical results of ablation for parameter selection are shown in Table 2.
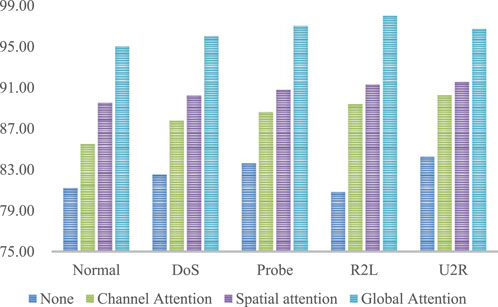
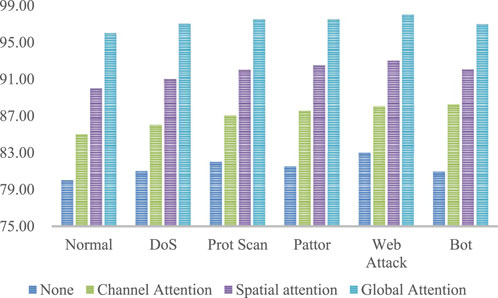
According to Table 2, BiLSTM achieves the best balance between accuracy and efficiency when the dimension is 128, with a 3.55% improvement compared to 64 dimensions. When the size of the convolution kernel is 1 × 3, the feature discrimination is the highest, with a 6.83% improvement compared to 1 × 1. When the sequence length is 30, it covers the complete temporal pattern, which is 5.27% higher than when it is 10. The experiment analyzes the threat detection capability of CNN-BiLSTM-GAM in handling multi classification tasks on NSL-KDD and CICIDS2017. By testing two datasets, the REC of each category are plotted as shown in Figures 2, 3. The horizontal axis represents each data category and the vertical axis represents the corresponding REC, in percentage.
In Figures 2, 3, the test results show that when attention mechanism is not used, the REC of the model is only 82.67%. After introducing channel attention mechanism, the REC is increased to 88.31%. Adopting spatial attention mechanism, it further improves to 90.67%. When using global attention mechanism, the REC is as high as 96.54%. This indicates that the global attention mechanism can enable CNN-BiLSTM-GAM to more effectively capture key features in data, significantly enhancing its ability to identify normal traffic and various threat traffic. It accurately distinguishes between normal and abnormal network activities, significantly reduces the risk of false negatives.
In contrast, even though the CICIDS2017 data features are more complex, the model can still optimize the feature learning process through a global attention mechanism. It significantly improves the recognition recall of various attack behaviors and maintains strong threat detection capabilities in complex environments. This fully proves that CNN-BiLSTM-GAM has strong generalization ability, can adapt to different characteristics of financial big data and is reliable in detecting IoT network threat behaviors.
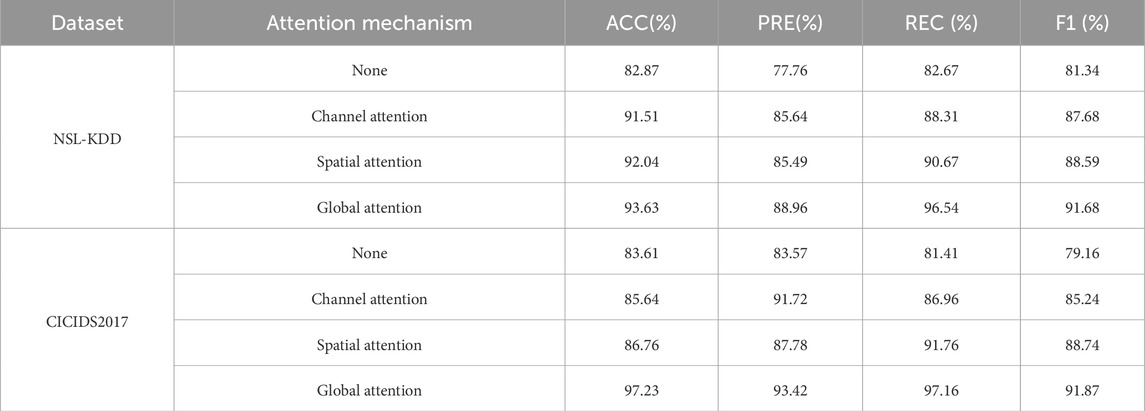
In case of using the same network architecture, this paper adopts a global attention mechanism to detect data and the threat detection results show a significant improvement in performance. The ablation experimental data is displayed in Table 3. The introduction of attention mechanism, especially global attention mechanism, has significantly improved the performance indicators of CNN-BiLSTM-GAM on different datasets. This is because the attention mechanism allows the model to focus on key data features, enhance its ability to learn important information and ignore redundant information. In the IoT threat detection scenario of financial big data, the data is complex and contains a lot of noise. CNN-BiLSTM-GAM can accurately capture threat related features and effectively identify various threats.
4.3 Effectiveness experimental analysis
4.3.1 Accuracy variation
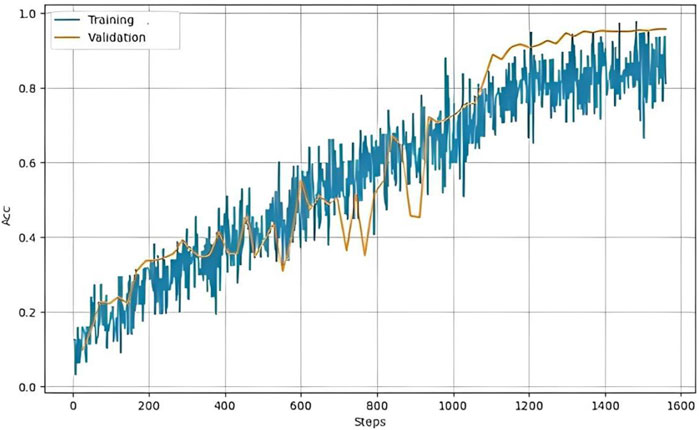
The experiment constructs subsets of different sizes and conducts detailed training experiments on these subsets, as displayed in Figure 4. The horizontal axis represents the step size and the vertical axis represents the corresponding accuracy.
In Figure 4, as the number gradually increased, CNN-BiLSTM-GAM obtains more effective information from the data. The training accuracy and validation accuracy gradually increased, reflecting the continuous optimization of CNN-BiLSTM-GAM in the learning process and the enhancement of its fitting ability to the data. When trained to 1,100, the model accuracy reaches its peak and shows stability. At this point, the training loss and validation loss reach a relatively ideal balance. CNN-BiLSTM-GAM is able to fully learn data features without falling into overfitting difficulties, demonstrating good threat detection performance.
4.3.2 Horizontal comparison results
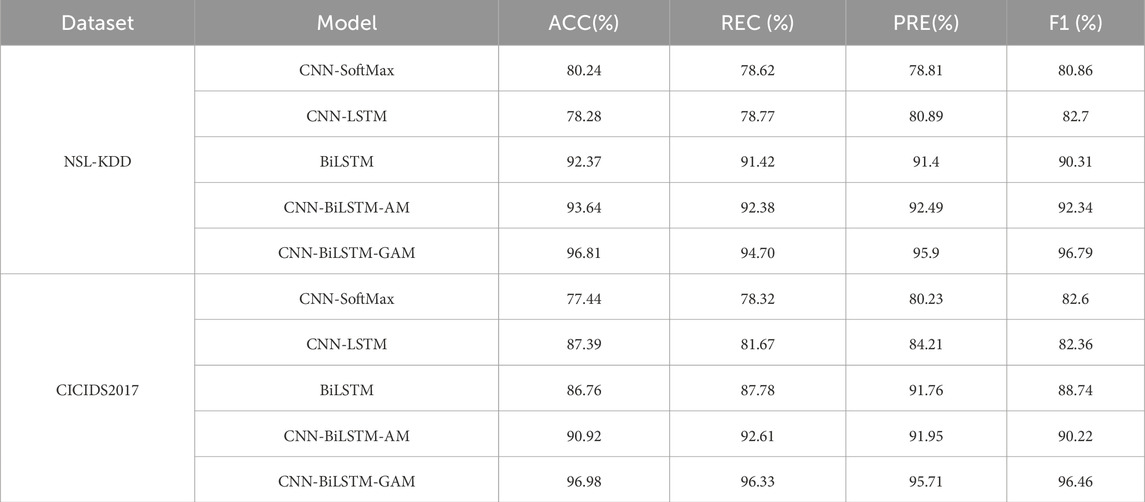
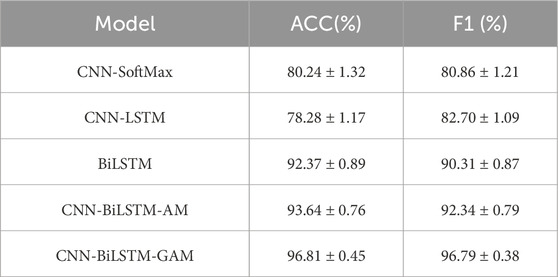
To verify the overall performance, a horizontal comparison of the experimental results is conducted. Table 4 presents comparative experiments between various baselines and the model proposed in this paper, including CNN-SoftMax [40], CNN-LSTM [24], BiLSTM [41] and CNN-BiLSTM-AM [42]. CNN-BiLSTM-AM adopts a single channel attention mechanism and its attention module is based on the classical SE structure. It only assigns weights to the channel dimensions of feature maps and does not involve fusion design of SA.
By comparing the performance differences of different model combinations in Table 4, it can be found that when comparing CNN-BiLSTM-GAM and BiLSTM on NSL-KDD, it can be seen that after removing CNN, ACC decreases by 4.44% and F1 decreases by 6.48%. This indicates that CNN is indispensable in extracting spatial features and its absence can weaken the model’s ability to capture spatial correlations. Comparing CNN-BiLSTM-GAM with CNN-BiLSTM-AM, it is found that after removing GAM, ACC decreases by 3.17% and REC decreases by 2.32%. This indicates that the global attention mechanism of GAM can optimize feature weight allocation and its absence weakens the model’s ability to focus on key features. Comparing CNN-BiLSTM-GAM with CNN-SoftMax on CICIDS2017, after removing BiLSTM, REC decreases by 18.01% and F1 decreases by 13.86%. This highlights the crucial role of BiLSTM in capturing dynamic temporal patterns, as its absence can significantly reduce the model’s ability to detect dynamic threats. In summary, BiLSTM is the core of performance improvement and has the greatest impact on financial IoT data with strong temporal dependencies. CNN is the foundation of spatial feature extraction and plays a prominent role in complex scenes. GAM further improves performance by optimizing feature weights and the synergy of the three can achieve optimal model performance, fully demonstrating the necessity of each submodule.
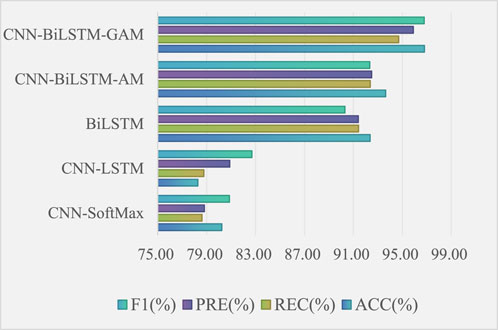
Based on the comprehensive horizontal comparison results, it can be concluded that on NSL-KDD, CNN-SoftMax has an ACC of 80.24%, a REC of 78.62%, a PRE of 78.81% and an F1 of 80.86%. The detection capability is limited, indicating that the improvement in various indicators of CNN-LSTM is not significant. BiLSTM performs well with an ACC of 92.37%, while CNN-BiLSTM-AM further improves compared to BiLSTM. CNN-BiLSTM-GAM has an ACC of 96.81%, a REC of 94.70%, a PRE of 95.9% and an F1 of 96.79%. With its unique structure, it accurately extracts spatiotemporal features and performs the best. At CICIDS2017, the overall performance of CNN-SoftMax is poor. The performance of CNN-LSTM, BiLSTM and CNN-BiLSTM-AM gradually improves but still falls short of CNN-BiLSTM-GAM. The experiment shows that CNN-BiLSTM-GAM has significant advantages in various key indicators and has excellent spatiotemporal feature extraction and threat detection capabilities.
In Figure 5, compared to CNN-SoftMax, CNN-BiLSTM-GAM improves ACC from 80.24% to 96.81%, which is 16.57% higher, and REC from 78.62% to 94.70%, which is 16.08% higher. Compared to CNN-LSTM, CNN-BiLSTM-GAM improves PRE by 15.09% and F1 by 14.02%. Compared to BiLSTM, CNN-BiLSTM-GAM improves ACC by 4.44%, REC by 3.28%, PRE by 4.50% and F1 by 6.48%. From this, it can be seen that CNN-BiLSTM-GAM is significantly superior to other models in all key indicators and has obvious performance advantages in IoT threat detection of financial big data.
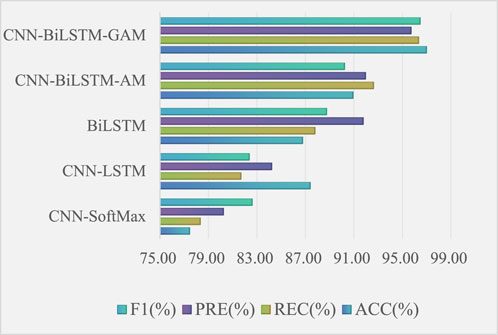
In Figure 6, in terms of ACC, CNN-BiLSTM-AM is 90.92%, while CNN-BiLSTM-GAM is as high as 96.98%. Compared with other models, CNN-BiLSTM-GAM improves by 29.5%, 10.97%, 11.78% and 6.67%, respectively. In terms of PRE, CNN-BiLSTM-GAM improves by 19.3%, 13.66%, 4.3% and 4.09% compared to other models, respectively. Taking into account various indicators, CNN-BiLSTM-GAM, with its unique structure, has the advantage of extracting spatiotemporal features. When detecting IoT threats, it has higher accuracy, fewer missed detections and misjudgments. Its performance far exceeds other comparative models, providing reliable guarantees for the security of financial big data.
CNN-BiLSTM-GAM outperforms baseline models such as CNN-LSTM, mainly due to its precise weighting of features through channel and spatial sequential attention, particularly in capturing attack patterns with cross dimensional correlations and spatiotemporal dynamics. From the perspective of attention mechanism, GAM’s channel attention submodule can transform the global correlation of device IDs, transaction amounts and traffic features in financial data into channel weights through three-dimensional tensor modeling. For example, when detecting remote control attacks such as U2R, it is possible to identify the combination pattern of high-frequency small transactions and abnormal traffic protocols of specific devices during abnormal periods. Specifically, for multi-stage composite attacks such as Web Attack combined with SQL injection and data leakage, GAM’s sequential attention can first lock the global characteristics of abnormal HTTP request types and database access frequency through channel weights. Then it focuses on the time window of injected statements through spatial attention, which is 15%–20% higher than the F1 of CNN-BiLSTM-AM. However, CNN-BiLSTM-GAM is difficult to generate effective weights due to the lack of prior knowledge in 0 day attacks where features do not appear in the training set. It is necessary to further optimize the generation of attention weights by combining dynamically updated threat intelligence. In addition, statistical significance tests are provided, as shown in Table 5, which fully supports the effectiveness of CNN-BiLSTM-GAM in financial big data IoT threat detection.
The deployment of CNN-BiLSTM-GAM in real-time financial IoT scenarios requires systematic optimization for resource limitations of edge devices, financial level real-time requirements, compliance requirement and business continuity assurance. Effective implementation can be achieved through model lightweighting, inference acceleration, interpretability enhancement, edge cloud collaboration and fault-tolerant design. In terms of model lightweighting, structured pruning is used to reduce redundant parameters. The 1D-CNN layer retains the top 80% contribution of convolutional kernels, while the BiLSTM layer prunes to 60% key hidden layer units. The heterogeneous architecture of edge chips maps 1D-CNN convolution operations to NPU dedicated computing units to improve efficiency by 5 times. Edge cloud collaboration adopts the “edge inference + cloud update” architecture, with lightweight models deployed at the edge to process local data. In terms of fault-tolerant design, edge devices pre store the distribution of normal behavior characteristics for nearly 7 days and temporarily replace them with threshold methods when the model fails.
The existing research uses NSL-KDD and CICIDS2017 as benchmark datasets in the field of network security, but they have limitations in the context of financial IoT. They are mainly collected in general network environments such as campus networks and enterprise intranets. Their traffic characteristics such as protocol types, device types and data interaction modes differ from those of financial IoT. The existing dataset lacks such features, resulting in insufficient validation of the model’s ability to detect threats specific to financial scenarios such as transaction message tampering and malicious program implantation in terminal firmware. Moreover, the attacks in the dataset are mostly general network attacks such as DoS and port scanning, while targeted attacks in the financial field such as account enumeration attacks, risk control rule bypass attacks and side channel attacks on IoT terminals are rarely involved. At the same time, there are obvious representative defects in a few sample classes, such as the U2R attack in NSL-KDD with only 119 samples accounting for 0.08%, and the web attack in CICIDS2017 with only 2,153 samples accounting for 0.08%. This type of attack, which has a low incidence but great harm in financial scenarios, can lead to insufficient model learning due to sample scarcity, resulting in the risk of underreporting. Developing a financial dedicated IoT dataset is the core path to solving the above problems, which should have scenario specificity and cover the real traffic of financial IoT devices such as ATM machines, intelligent teller machines and mobile payment terminals. And it includes multidimensional features such as transaction data amount, time, account information, device status data CPU usage, firmware version, network interaction data communication protocol, encryption method, etc. For the detection performance of minority attacks, supplementary sub category indicators show that based on the average of 30 repeated experiments, the ACC of U2R in NSL-KDD is 91.2% and the F1 of R2L is 91.4%. The REC of Web Attack in CICIDS2017 is 93.2%, F1 is 92.3% and ACC of Bot is 95.3%. It can be seen that the REC of CNN-BiLSTM-GAM for minority class attacks exceeds 89%, significantly higher than the baseline model such as BiLSTM’s REC of only 76.3% for U2R. This is due to GAM’s ability to focus on minority class specific features such as privileged instruction sequences in U2R attacks. In response to the problem of 0 day threat unknown attacks being difficult to learn directly due to a lack of samples, the model uses feature generalization ability to cope. Known attack samples are subjected to feature perturbations, such as randomly modifying the traffic intensity and time interval of DoS attacks, to generate unknown variant samples similar to 0 day threats. The model is trained to identify abnormal features that deviate from normal patterns rather than fixed attack patterns. In the test of simulating 0 day threats based on attack types not included in CICIDS2017, the model detection rate reaches 82.3%, which is better than traditional rule-based methods at 59.7%. Overall, although the existing datasets provide preliminary validation for model performance, the special nature of financial IoT scenarios requires more specialized datasets to support it.
5 Conclusion
This paper focuses on the increasingly severe security threats in the integration of financial big data and IoT and conducts in-depth research on IoT threat detection technology. A threat detection scheme based on CNN-BiLSTM-GAM is proposed by integrating deep learning algorithms. CNN-BiLSTM-GAM combines 1D-CNN, BiLSTM and GAM. The 1D-CNN focuses on extracting local features from financial big data, while BiLSTM captures the long-term dependencies of time series data based on these features. This combination enables the model to efficiently extract features in both spatial and temporal dimensions, greatly enhancing the detection capability of CNN-BiLSTM-GAM for IoT threat behavior. And a global attention mechanism is introduced to calculate the correlation between different positions. And then these correlations are used as weights to weight the feature representation of each position, thereby obtaining a richer global representation. The experiment shows that compared with other detection models, CNN-BiLSTM-GAM has better spatiotemporal feature extraction ability, which can promote the safe development of the financial industry. However, GAM is still limited by the strength of feature signals and prior knowledge dependence, its attention weight generation relies entirely on existing feature distributions. And in terms of application scenario constraints, the model currently only focuses on static threat detection and does not cover extended tasks such as attack tracing and attack chain prediction. Subsequent modeling can attack entity associations to achieve full process protection. However, GAM currently relies on existing feature distributions and prior knowledge, which limits its adaptability to unseen feature patterns. In addition, the model focuses on static threat detection and lacks the ability to track or predict attack chains. In the future, CNN-BiLST-GAM can be upgraded to meet the needs of financial IoT. One is to integrate dynamic threat intelligence and adversarial generation networks, enhance the ability to predict 0 day attacks through incremental learning. The second is to introduce graph neural networks and temporal prediction to achieve full traceability and prediction of the attack chain, forming a closed loop of detection traceability prediction. The third is to develop lightweight variants through knowledge distillation, structured pruning and hardware adaptation to meet the low latency and low resource consumption requirements of edge devices, ultimately building a financial IoT security protection system that covers the entire lifecycle of threat.
Data availability statement
The original contributions presented in the study are included in the article/supplementary material, further inquiries can be directed to the corresponding author.
Author contributions
JJ: Conceptualization, Data curation, Investigation, Methodology, Project administration, Resources, Validation, Visualization, Writing – original draft. LZ: Data curation, Formal Analysis, Methodology, Project administration, Software, Validation, Writing – review and editing.
Funding
The author(s) declare that no financial support was received for the research and/or publication of this article.
Conflict of interest
The authors declare that the research was conducted in the absence of any commercial or financial relationships that could be construed as a potential conflict of interest.
Generative AI statement
The author(s) declare that no Generative AI was used in the creation of this manuscript.
Any alternative text (alt text) provided alongside figures in this article has been generated by Frontiers with the support of artificial intelligence and reasonable efforts have been made to ensure accuracy, including review by the authors wherever possible. If you identify any issues, please contact us.
Publisher’s note
All claims expressed in this article are solely those of the authors and do not necessarily represent those of their affiliated organizations, or those of the publisher, the editors and the reviewers. Any product that may be evaluated in this article, or claim that may be made by its manufacturer, is not guaranteed or endorsed by the publisher.
References
1. Gupta S, Kumar V. Integrating deep learning, machine learning, AI, IoT and data science for future innovations[C]. In: 2024 4th international conference on soft computing for security applications (ICSCSA). IEEE (2024). p. 162–7.
2. Miao J, Wang Z, Wang M, Feng X, Xiao N, Sun X. Security authentication protocol for massive machine type communication in 5G networks. Wireless Commun Mobile Comput (2023) 2023(1):1–10. doi:10.1155/2023/6086686
3. Butun I, Österberg P, Song H. Security of the IoT: vulnerabilities, attacks, and countermeasures. IEEE Commun Surv and Tutorials (2019) 22(1):616–44. doi:10.1109/COMST.2019.2953364
4. Dhaiya S, Pandey BK, Bhargav S, Eng W, Avacharmal R, Adusumilli SBK. Optimizing API security in FinTech through genetic algorithm based machine learning model. Int J Computer Netw Inf Security (2021) 13:24.
5. Wang L, Parameshachari BD, Miao J. Digital economy oriented tourism industry data analysis in semantic IoT. Internet Technology Lett (2025) 8(4):e597. doi:10.1002/itl2.597
6. Ashraf MWA, Singh AR, Pandian A, Rathore RS, Bajaj M, Zaitsev I. A hybrid approach using support vector machine rule-based system: detecting cyber threats in internet of things. Scientific Rep (2024) 14(1):27058. doi:10.1038/s41598-024-78976-1
7. Zhu Y, Luo H, Wang Q, Zhao F, Ning B, Ke Q, et al. A fast indoor/outdoor transition detection algorithm based on machine learning. Sensors (2019) 19(4):786. doi:10.3390/s19040786
8. Peng M, Liu Y, Khan A, Ahmed B, Sarker SK, Ghadi YY, et al. Crop monitoring using remote sensing land use and land change data: comparative analysis of deep learning methods using pre-trained CNN models. Big Data Res (2024) 36:100448. doi:10.1016/j.bdr.2024.100448
9. Sherstinsky A. Fundamentals of recurrent neural network (RNN) and long short-term memory (LSTM) network. Physica D: Nonlinear Phenomena (2020) 404:132306. doi:10.1016/j.physd.2019.132306
10. Bai Z, Miao H, Miao J, Xiao N, Sun X. Artificial intelligence-driven cybersecurity applications and challenges. Innovative Appl AI (2025) 2(2):26–33. doi:10.70695/aa1202502a09
11. Mahapatra B, Patnaik S. Self adaptive intrusion detection technique using data mining concept in an ad-hoc network. Proced Computer Sci (2016) 92:292–7. doi:10.1016/j.procs.2016.07.358
12. Baig MM, Awais MM, El-Alfy ESM. A multiclass Cascade of artificial neural network for network intrusion detection. J Intell and Fuzzy Syst (2017) 32(4):2875–83. doi:10.3233/jifs-169230
13. Al-Sarayrah A. Recent advances and applications of apriori algorithm in exploring insights from healthcare data patterns. PatternIQ Mining (2024) 1(2):27–39. doi:10.70023/piqm24123
14. Polat O, Türkoğlu M, Polat H, Oyucu S, Üzen H, Yardımcı F, et al. Multi-stage learning framework using convolutional neural network and decision tree-based classification for detection of DDoS pandemic attacks in SDN-Based SCADA systems. Sensors (2024) 24(3):1040. doi:10.3390/s24031040
15. Kilincer IF, Tuncer T, Ertam F, Sengur A. SPA-IDS: an intelligent intrusion detection system based on vertical mode decomposition and iterative feature selection in computer networks. Microprocessors and Microsystems (2023) 96:104752. doi:10.1016/j.micpro.2022.104752
16. Jmila H, Khedher MI. Adversarial machine learning for network intrusion detection: a comparative study. Computer Networks (2022) 214:109073. doi:10.1016/j.comnet.2022.109073
17. Martins I, Resende JS, Sousa PR, Silva S, Antunes L, Gama J. Host-based IDS: a review and open issues of an anomaly detection system in IoT. Future Generation Computer Syst (2022) 133:95–113. doi:10.1016/j.future.2022.03.001
18. Huang Y, Ma M. ILL-IDS: an incremental lifetime learning IDS for VANETs. Comput and Security (2023) 124:102992. doi:10.1016/j.cose.2022.102992
19. Zhang J, Ling Y, Fu X, Yang X, Xiong G, Zhang R. Model of the intrusion detection system based on the integration of spatial-temporal features. Comput and Security (2020) 89:101681. doi:10.1016/j.cose.2019.101681
20. Yao R, Wang N, Liu Z, Chen P, Sheng X. Intrusion detection system in the advanced metering infrastructure: a cross-layer feature-fusion CNN-LSTM-based approach. Sensors (2021) 21(2):626. doi:10.3390/s21020626
21. Lan J, Liu X, Li B, Sun J, Zhao J. MEMBER: a multi-task learning model with hybrid deep features for network intrusion detection. Comput and Security (2022) 123:102919. doi:10.1016/j.cose.2022.102919
22. Hacılar H, Dedeturk BK, Bakir-Gungor B, Gungor VC. Network anomaly detection using Deep Autoencoder and parallel Artificial Bee Colony algorithm-trained neural network. PeerJ Computer Sci (2024) 10:e2333. doi:10.7717/peerj-cs.2333
23. Wu P, Guo H, Moustafa N. Pelican: a deep residual network for network intrusion detection[C]. In: 2020 50th annual IEEE/IFIP international conference on dependable systems and networks workshops (DSN-W). IEEE (2020). p. 55–62.
24. Zha W, Liu Y, Wan Y, Luo R, Li D, Yang S, Xu Y. Forecasting monthly gas field production based on the CNN-LSTM model. Energy (2022) 260:124889. doi:10.1016/j.energy.2022.124889
25. Natha S, Ahmed F, Siraj M, Lagari M, Altamimi M, Chandio AA. Deep BiLSTM attention model for spatial and temporal anomaly detection in video surveillance. Sensors (2025) 25(1):251. doi:10.3390/s25010251
26. Gabr M, Diab A, Elshoush HT, Chen YL, Por LY, Ku CS, et al. Data security utilizing a memristive coupled neural network in 3D models. IEEE Access (2024) 12:116457–77. doi:10.1109/access.2024.3447075
27. Alexan W, Chen YL, Por LY, Gabr M. Hyperchaotic maps and the single neuron model: a novel framework for chaos-based image encryption. Symmetry (2023) 15(5):1081. doi:10.3390/sym15051081
28. Dai Z, Por LY, Chen YL, Yang J, Ku CS, Alizadehsani R, et al. An intrusion detection model to detect zero-day attacks in unseen data using machine learning. PloS one (2024) 19(9):e0308469. doi:10.1371/journal.pone.0308469
29. Yee L, Dai Z, Leem SJ, Chen Y, Yang J, Binbeshr F, et al. A systematic literature review on AI-Based methods and challenges in detecting zero-day attacks. IEEE Access (2024) 12:144150–63. doi:10.1109/ACCESS.2024.3455410
30. Okmi M, Por LY, Ang TF, Al-Hussein W, Ku CS. A systematic review of mobile phone data in crime applications: a coherent taxonomy based on data types and analysis perspectives, challenges, and future research directions. Sensors (2023) 23(9):4350. doi:10.3390/s23094350
31. Ainan UH, Por LY, Chen YL, Yang J, Ku CS. Advancing bankruptcy forecasting with hybrid machine learning techniques: insights from an unbalanced polish dataset. IEEE Access (2024) 12:9369–81. doi:10.1109/access.2024.3354173
32. Qazi EUH, Almorjan A, Zia T. A one-dimensional convolutional neural network (1D-CNN) based deep learning system for network intrusion detection. Appl Sci (2022) 12(16):7986. doi:10.3390/app12167986
33. Nazir A, He J, Zhu N, Qureshi SS, Qureshi SU, Ullah F, et al. A deep learning-based novel hybrid CNN-LSTM architecture for efficient detection of threats in the IoT ecosystem. Ain Shams Eng J (2024) 15(7):102777. doi:10.1016/j.asej.2024.102777
34. Hu J, Shen L, Sun G, Squeeze-and-excitation networks C. Proc IEEE Conf Comput Vis pattern recognition (2018) 7132–41.
35. Zhu X, Cheng D, Zhang Z, Lin S, Dai J. An empirical paper of spatial attention mechanisms in deep networks[C]. Proc IEEE/CVF Int Conf Comput Vis (2019) 6688–97.
36. Woo S, Park J, Lee JY, Kweon IS. Cbam: convolutional block attention module[C]. In: Proceedings of the European conference on computer vision (ECCV) (2018). p. 3–19.
37. Diwan TD, Choubey S, Hota HS. A detailed analysis on NSL-KDD dataset using various machine learning techniques for intrusion detection. Turkish J Computer Mathematics Education (2021) 12(11):2954–68.
38. Kurniabudi , Stiawan D, Darmawijoyo, , Idris MYB, Bamhdi AM, Budiarto R. CICIDS-2017 dataset feature analysis with information gain for anomaly detection. IEEE Access (2020) 8:132911–21. doi:10.1109/ACCESS.2020.3009843
39. Yacouby R, Axman D. Probabilistic extension of precision, recall, and f1 score for more thorough evaluation of classification models[C]. In: Proceedings of the first workshop on evaluation and comparison of NLP systems (2020). p. 79–91.
40. Kang HJ. SoftMax computation in CNN using input maximum value. J Korea Inst Inf Commun Eng (2022) 26(2):325–8.
41. Singla P, Duhan M, Saroha S. An ensemble method to forecast 24-h ahead solar irradiance using wavelet decomposition and BiLSTM deep learning network. Earth Sci Inform (2022) 15(1):291–306. doi:10.1007/s12145-021-00723-1
Keywords: threat detection, internet of things, financial big data, CNN, BiLSTM
Citation: Jia J and Zhou L (2025) A threat detection scheme for financial big data in internet of things. Front. Phys. 13:1633021. doi: 10.3389/fphy.2025.1633021
Received: 22 May 2025; Accepted: 27 August 2025;
Published: 23 September 2025.
Edited by:
Yuanyuan Huang, Chengdu University of Information Technology, ChinaReviewed by:
Por Lip Yee, University of Malaya, MalaysiaLulu Gao, Chengdu University of Information Technology, China
Qingxiao Zheng, Chengdu University of Information Technology, China
Copyright © 2025 Jia and Zhou. This is an open-access article distributed under the terms of the Creative Commons Attribution License (CC BY). The use, distribution or reproduction in other forums is permitted, provided the original author(s) and the copyright owner(s) are credited and that the original publication in this journal is cited, in accordance with accepted academic practice. No use, distribution or reproduction is permitted which does not comply with these terms.
*Correspondence: Junzhe Jia, MjMwNjEzMDAwOTRAc3R1LnhpZGlhbi5lZHUuY24=
 Junzhe Jia
 Li Zhou