 Mouna Garai1
 Maha Sliti1*
 Noureddine Boudriga2
 Manel Mrabet3Sarra Ayouni4Abdelrahman Elfikky5
 Ayman Boghdady5
 Syed Agha Hassnain Mohsan6Lassaad Ben Ammar3
- 1Communication Networks and Security Research Lab. & LR11TIC02, Green and Smart Communication Systems Research Lab, Higher School of Communication of Tunis (SUP’COM), University of Carthage, Carthage, Tunisia
- 2Higher School of Communication of Tunis (SUP’COM), University of Carthage, Carthage, Tunisia
- 3Department of Computer Sciences, College of Computer Engineering and Sciences, Prince Sattam bin Abdulaziz University, Al-Kharj, Saudi Arabia
- 4Department of Information Systems, College of Computer and Information Sciences, Princess Nourah bint Abdulrahman University, P.O. Box 84428, Riyadh 11671, Saudi Arabia
- 5Port Training Institute, Arab Academy for Science, Technology and Maritime Transport, Alexandria, Egypt
- 6Shenzhen Graduate School, Peking University, Shenzhen, China
Effective communication solutions are crucial in the dynamic transportation landscape. The rise of autonomous vehicles and sophisticated transportation systems has shaped urban mobility, underscoring the importance of safety considerations and data-driven decision making. This study examines the significance of rapid, low-latency communication in advanced intelligent transportation systems, focusing on the use of Visible Light Communication (VLC) in vehicle ad hoc networks (VANETs). This study introduces a tree-structured communication architecture utilizing hierarchical optical codewords to enhance data routing efficiency and establish a vehicle identification system. The proposed system employs dynamic attachment and reattachment protocols in conjunction with adaptive quality-of-service mechanisms to effectively mitigate variability in traffic dynamics, thus enhancing network stability and data aggregation. Simulation results contrasting the Intelligent Driver Model, Gipps, and Krauss mobility models indicate that, while more complex network trees may lead to increased delay and lower effective signal-to-noise ratios, models characterized by greater vehicular spacing generally result in reduced delay and enhanced SNR, though this improvement comes at the cost of connectivity. This document provides a detailed examination of mobility-aware performance and the incorporation of tree-structured VLC VANETs that employ hierarchical optical codewords for distinct node identification. The performance insights reveal significant improvements in scalability, latency, and throughput, which support the advancement of smart city infrastructures that are more sustainable, efficient, and secure.
1 Introduction
The rapid evolution of intelligent transportation systems (ITS) is driving the demand for vehicle-to-everything (V2X) links that are simultaneously high-speed, reliable and easily scalable. Vehicular ad hoc networks (VANETs) underpin this vision by allowing the real-time exchange of status, control and safety messages between vehicles and road infrastructure, thus improving sustainability, traffic efficiency, and road safety [1].
Radio frequency (RF) technologies constitute the default V2X medium today, but their large-scale urban deployment faces two decisive bottlenecks: (i) spectrum congestion and RF interference in dense city grids and (ii) high capital expenditure, because continuous coverage typically requires multiple transceivers at every intersection and along major corridors. These limitations have prompted a growing interest in Visible Light Communication (VLC). By repurposing existing headlights, taillights, and street lamps as optical transceivers, VLC delivers submillisecond latency, immunity to RF interference, and inherently energy-efficient links -attributes that are especially attractive for urban ITS [2, 3].
Integration of VLC is already underway in both vehicles and smart street lighting systems [4–6]. Figure 1 illustrates a typical automotive safety scenario: smart traffic lights transmit signal phases, remaining time to change, speed limits, and maintenance alerts, while approaching vehicles upload their position, velocity, acceleration, and engine state. The main hurdles lie in the strict line-of-sight (LOS) requirement of VLC and the limited propagation range, which must be mitigated through robust topology management, adaptive link maintenance, and hybrid networking strategies if VLC is to fulfill its full potential for next-generation VANETs.
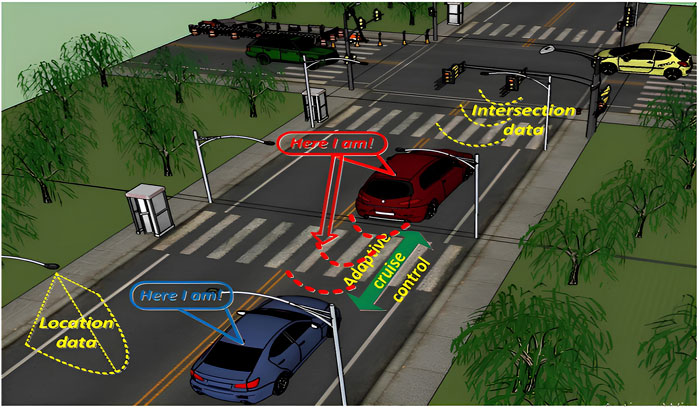
Figure 1. VLC-enabled vehicular safety communication: Data exchange via vehicle illumination systems, street lighting system, and traffic lights [7].
Implementing Optical Code Division Multiple Access (OCDMA) [8–10] is a highly promising approach to increase the effectiveness and capacity of vehicular networks based on VLC. Optical Code Division Multiplexing Access allows multiple vehicles to transmit and receive data over a single optical channel, with information encoded using different optical codes. This approach reduces the likelihood of data collisions while improving the network’s overall stability and effectiveness. Numerous studies have looked into the use of OCDMA in the field of VLC, particularly VANET. These studies demonstrated the ability of OCDMA to offer high-speed communication while reducing interference in densely populated areas [11–13]. These advances are critical to improving the connectivity of V2V and V2I data transfer, particularly in dynamic, high-mobility situations. These VLC enhancements have been complemented by AI techniques in ITS such as the Deep Deterministic Policy Gradient model for 5G/6G security [14] and CNN-based light-field reconstruction for autonomous perception [15].
In this work, we introduce a novel tree-structured communication architecture that employs hierarchical optical codewords to identify distinct nodes. This innovative approach improves data routing efficiency by constructing virtual trees in which each node is uniquely identified by a multilevel optical codeword header. The system effectively manages routing in dynamic network conditions by encapsulating the codeword identifier within the packet structure. Dynamic attachment and reattachment protocols, in conjunction with adaptive quality of service (QoS) mechanisms, further enhance the proposed approach. The purposed approach improves the stability of the network and the aggregation of data by reducing the inherent variability in traffic dynamics. Simulation results contrasting the performance of three distinct mobility models (the Intelligent Driver Model, Gipps, and Krauss) indicate that while more complex network trees tend to induce increased delays and lower effective signal-to-noise ratios (SNR), mobility scenarios characterized by greater vehicular spacing generally yield reduced delays and enhanced SNR, although often at the expense of connectivity. The primary contributions of this work are as follows.
1. VLC-Based Tree Communication Architecture A hierarchical communication system designed for vehicle-to-vehicle (VLC) networks, with cars organized into collecting trees. Each tree enables organized data routing, resulting in efficient aggregation and transmission to base stations while leveraging VLC’s high-speed and low-latency characteristics.
2. Hierarchical Optical Codewords for Vehicle Identification. The purpose of using hierarchical optical codewords is to uniquely identify cars within the tree structure. These codewords enable dynamic network structure, improved routing efficiency, and more stability by reducing data collisions and ensuring precise function classification for each vehicle.
3. Quality-driven attachment and reattachment protocols. Adaptive approaches that enable cars to maintain optimal communication by dynamically connecting and disconnecting with neighbors or trees based on the quality of their VLC connections. This allows for regular and reliable communication while reducing interruptions caused by mobility or environmental changes.
The paper is structured as follows. Section 2 study the use of visible light communication in ad hoc vehicular networks, covering V2V/V2I use cases, line-of-sight challenges, and hybrid solutions. Section 3 presents our tree-structured optical codeword architecture for VLC-VANETs. Section 4 describes the dynamic optical codeword framework for vehicle identification. In Section 5, we present an adaptive Quality-of-Service model, defining metrics for delay, packet loss, throughput, route lifetime, and SNR. Section 6 reports our simulation results. Finally, Section 7 concludes the paper and outlines directions for future work.
2 Visible light communication in vehicular ad hoc networks
VLC is emerging as a transformative technology for VANETs, offering high-speed, secure, and interference-free communication [2, 3, 16, 17, 18, 19]. VLC provides a practical solution to the growing demand for efficient V2V and V2I communication in modern transportation systems. This is particularly critical due to the difficulties that traditional wireless networks face in establishing reliable communication in densely populated vehicular environments.
The simultaneous transmission of data by multiple vehicles over a shared optical channel without interference is a significant advancement in VLC for VANETs with the integration of OCDMA [20]. OCDMA optimizes network capacity and reduces data collisions by employing unique optical codes for information encoding. This approach is indispensable to guarantee reliable communication in high-traffic environments [12, 13, 21].
Figure 2 illustrates how the implementation of VLC in VANETs enables a variety of communication connections between vehicles and infrastructure components [22, 23, 24, 46]. Vehicles can establish connections with each other in the rear and head, allowing continuous communication to achieve traffic management and safety objectives. V2I communication framework enables the interaction between motor vehicles and road side units, such as traffic signals, street lights, and signs. The integration of LEDs with infrastructure components enables the exchange of real-time data, such as signal changes, road conditions, and other critical safety information [25].
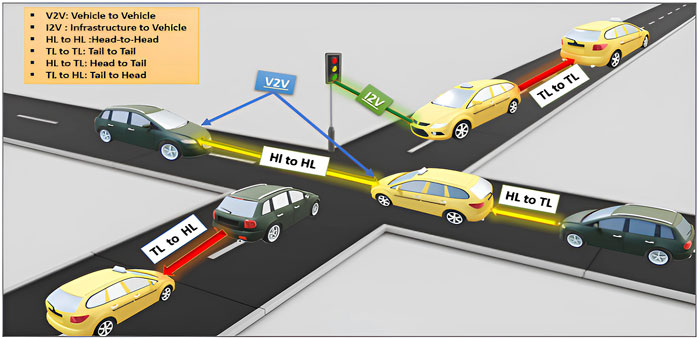
Figure 2. Optical V2V communication enabled by vehicle headlights (HL) and taillights (TL) [25].
Numerous studies have focused on strategies to optimize the efficacy of VLC in vehicular environments. [11] have devised mechanisms for efficient channel allocation that are indispensable for real-time applications, including collision avoidance. These mechanisms significantly mitigate packet collisions and delays. [25] developed a hybrid RF/VLC framework that is particularly well suited for urban environments that contain substantial interference to improve reliability. Their research emphasizes the importance of integrating RF and VLC technologies to overcome the limitations of standalone VLC systems. Jia et al. proposed methodologies for the selection of transmission channels to improve packet delivery in dynamic traffic conditions.
To enhance VLC communication in chaotic environments and mitigate directional limitations, [26] and [27] examined the optimization of modulation schemes and hardware innovations. According to Hendaoui et al., VLC has the ability to seamlessly integrate with other communication technologies, such as 5G and Wi-Fi, thus improving the scalability and robustness of vehicular networks. [28] and [17] emphasized the potential of bidirectional VLC systems to facilitate low-latency communication for critical applications, including self-driving vehicles.
Yahia et al. [29] conducted a study on the integration of millimeter wave (MMW) and VLC technologies to improve security protocols against deceptive attacks. Their findings suggest that VLC improves the resilience of vehicular networks to cyber threats when used in conjunction with multilayer security mechanisms. Furthermore, [30] and [31] conducted experimental investigations that illustrated the practical applications of VLC in vehicular systems. These investigations underscored improvements in data reliability, power efficiency, and throughput. As critically analyzed in Table 1, existing vehicular VLC systems face trade-offs between computational complexity, environmental adaptability, and scalability.
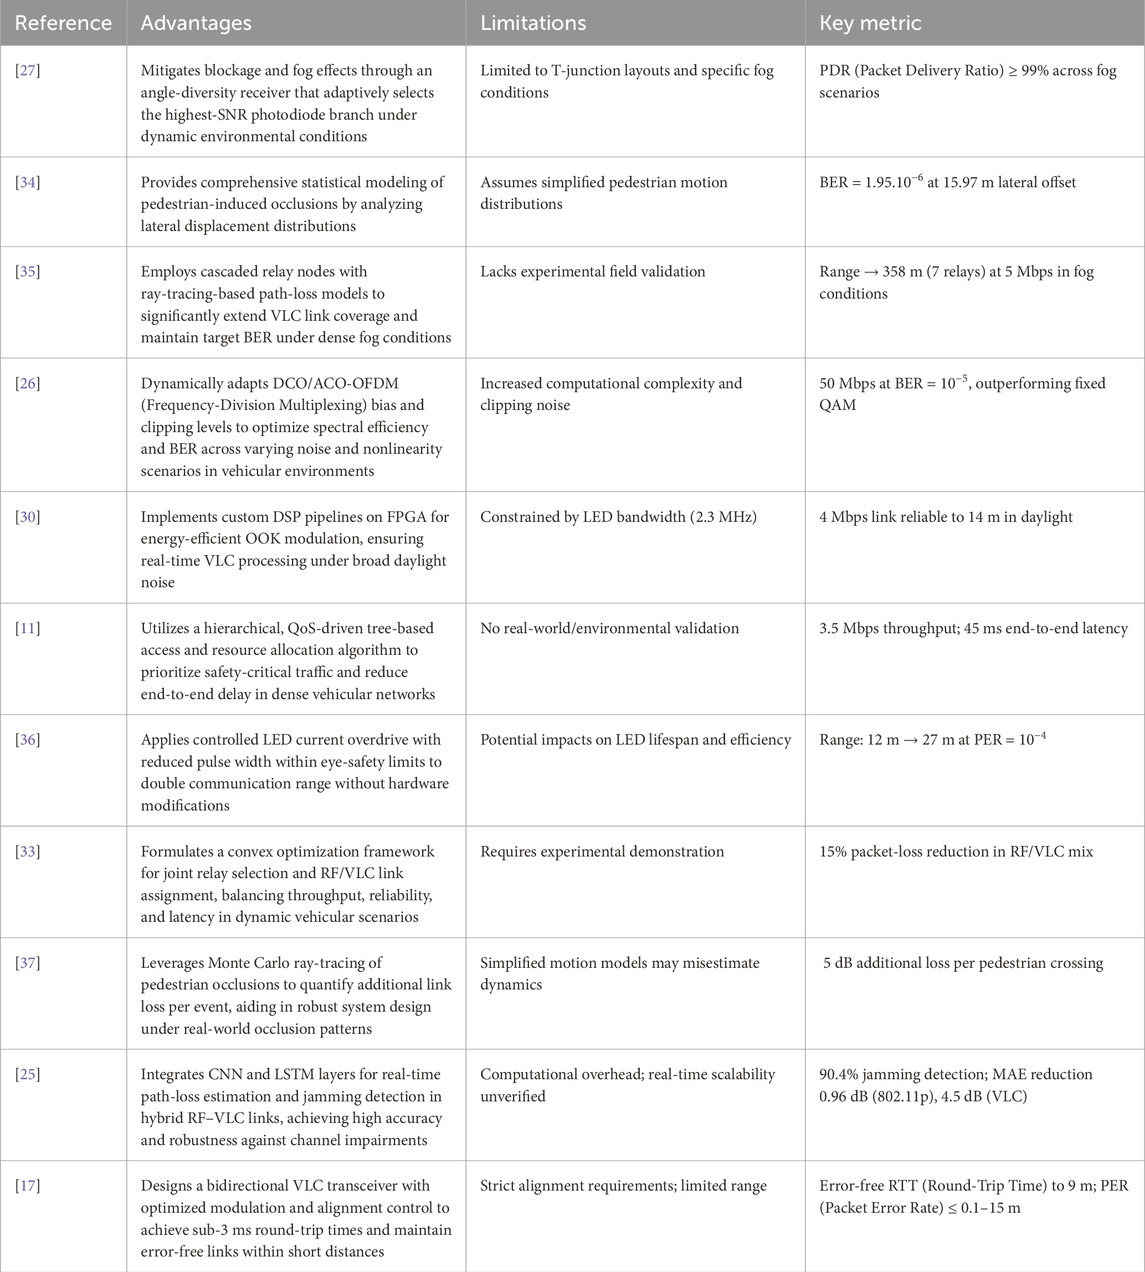
Table 1. Comparative analysis of vehicular VLC systems: Methods, advantages, limitations and key quantitative findings.
In contrast to previously presented studies, such as Garai et al. [11], which primarily use simulation-driven resource reservation techniques for dense networks, our work introduces a novel tree-structured architecture that leverages hierarchical optical codewords for vehicle identification. This approach not only organizes data routing more efficiently, but also provides a systematic method for aggregating and forwarding information, thereby addressing connectivity challenges in dynamic vehicular environments.
Similarly, while approaches such as those by Ullah et al. [25] and Jia et al. [32, 33], integrate machine learning frameworks or propose hybrid RF/VLC systems to improve link reliability, these methods often entail higher computational complexity or depend on hardware modifications. In contrast, our design focuses on a dynamic Quality-of-Service model coupled with adaptive reattachment strategies. This combination allows our network to maintain stable connections without the need for extensive modifications, making it both cost-effective and scalable under varying traffic conditions.
Furthermore, works such as Farahneh et al. [26] and Tettey et al. [27] emphasize advanced modulation techniques and experimental receiver designs to mitigate interference and optimize performance. Although these methods show promise in controlled environments, they can face challenges in practical deployment due to increased processing delays and alignment issues.
Our method leverages a tree-based architecture with built-in codeword management to minimize dependence on elaborate modulation schemes. Although Hendaoui [28] and Caputo et al. [17] demonstrate that multi-technology integrations can enable bidirectional VLC, they often introduce interoperability hurdles and added system complexity. In contrast, we embed node identifiers directly within each data packet, preserving orthogonality, streamlining attachment and reattachment, and delivering reliable performance even in dense high-mobility environments.
3 Optical codeword architecture for VLC-Vanets
We propose a hierarchical VLC-based VANET architecture (Figure 3) designed to address the growing demands of ITS and the Internet of Vehicles (IoV) [38, 39]. The architecture utilizes a dual-layer communication framework that is based on VLC to overcome the constraints of traditional vehicular communication systems. This architecture is comprised of two complementary communication strata: a V2V ad hoc layer based on VLC and an FSO-based V2I infrastructure layer. It is intended to provide high-speed, adaptive and reliable connectivity that is specifically tailored for the next-generation of ITS.
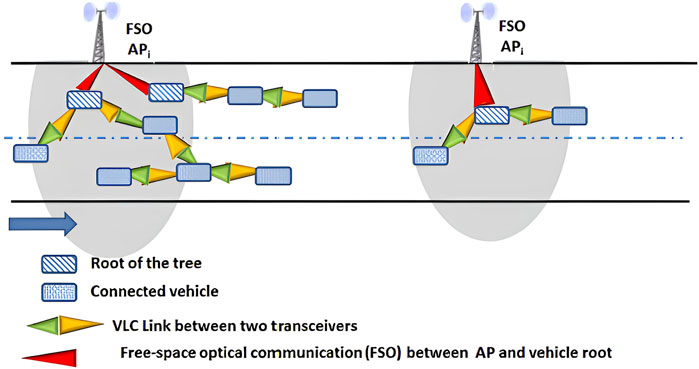
Figure 3. Network architecture.
By establishing high-throughput FSO links between vehicles and roadside devices, the FSO-based V2I infrastructure layer serves as the network’s backbone. This layer is the main channel for cloud-based services and infrastructure-driven safety messages, ensuring low-latency communication and seamless Internet access through the deployment of optical gateways at intervals of 2–3 km.
The VLC-based V2V ad hoc layer facilitates direct peer-to-peer communication among vehicles through the use of visible light links. Optical transmitters, such as standard headlights and taillights, are coupled with co-located photodetectors for reception (as shown in Figure 3). This configuration ensures the reliability of communication in rapidly changing urban traffic conditions, as well as real-time safety messages, cooperative maneuvers, and dynamic platoon coordination.
The network’s vehicles are each equipped with a dual-interface system that comprises an FSO communication module and a VLC transceiver. In addition, the integration of spherical LEDs allows omnidirectional optical coverage, which improves the robustness and stability of the link in the face of changing traffic densities and environmental conditions [40]. This integrated design not only enhances system resilience but also facilitates scalability in a variety of deployment scenarios.
The proposed VLC-VANET architecture guarantees efficient data aggregation and routing through its hierarchical structure, adaptive vehicle-to-tree attachment mechanisms, and multihop communication capabilities. The system maintains high-speed, low-latency data exchange while substantially reducing radio frequency spectrum congestion through the integration of VLC and FSO technologies. This composite model is well suited for a wide range of vehicular environments, including sparsely populated highways and dense urban corridors. It provides a sustainable, efficient, and scalable solution for future Internet of Vehicles (IoV) and ITS applications.
4 Dynamic optical codeword framework for vehicle identification
Modern vehicular networks require robust identification mechanisms to support high-density, low-latency communication [41, 42]. Traditional RF-based addressing schemes face fundamental scalability challenges due to identifier exhaustion and interference in congested environments [43]. To overcome these limitations, we combine Optical Orthogonal Codes (OOCs) with an efficient hierarchical network organization, creating a dual solution that addresses both identification and routing needs in VLC-based VANETs.
4.1 Optical Orthogonal Codes (OOC)
Optical Orthogonal Codes are particularly well suited for optical CDMA systems because of their low cross-correlation and impulse-like autocorrelation properties. An OOC is defined by two key parameters: length
OOCs are designed to minimize interference between codewords while maximizing the correlation properties to ensure reliable detection of signals. The autocorrelation function for a codeword
Ideally,
Similarly, the cross-correlation between two distinct codewords
For an ideal OOC, the cross-correlation between any two distinct codewords should be as close to zero as possible, ensuring minimal interference between different user’s signals:
4.2 Hierarchical vehicle identification scheme
Our approach achieves dual optimization by arranging codewords within a virtual tree topology: (1) efficient hierarchical routing by embedded path information in codeword concatenation, and (2) minimized packet overhead. This structure inherently supports network scalability, allowing the seamless addition of vehicles without identifier exhaustion.
Our system assigns a unique optical codeword to each vehicle using a virtual tree structure. To achieve this, the available set of OOCs is divided into two orthogonal subsets. The first subset consists of parent codes
When a new vehicle joins the network during the attachment phase, it is assigned a codeword by concatenating the codeword of its selected parent node with its own child code. That is, if a parent vehicle has a code
where
4.3 Orthogonality preservation in dynamic networks
The hierarchical parent-child structure plays a fundamental role in maintaining codeword orthogonality during network transactions. When a child vehicle joins the network, it inherits its parent’s codeword prefix
Let
To ensure minimal interference, the following conditions must be verified:
Thus, it follows that (Equation 7):
which ensures that the concatenated codes remain orthogonal even as the network scales.
5 Adaptive quality of service framework for VLC VANETs
In this section, we present a Quality of Service model specifically designed for VLC based vehicular ad hoc networks. The proposed model enhances communication effectiveness in dynamic vehicle situations by utilizing VLC’s rapid data transmission characteristics, low latency, and intrinsic resistance to RF interference. To improve node identification and organize the network into a tree-like routing framework, the system employs a hierarchical structure together with orthogonal optical codeword. Every vehicle evaluates the critical quality of service metrics, such as path delay, packet loss, throughput, route lifespan, and signal-to-noise ratio, using local performance measurements shared with adjacent vehicles. This system allows each vehicle to dynamically select the best communication tree, resulting in reliable and high quality data transmission channels.
5.1 Tree-based communication quality assessment
Vehicles select a communication tree based on QoS messages, establishing line-of-sight connections for high-speed data transfer. The tree structure, defined by
ensures a reliable routing, and each vehicle contributes to the evaluation of QoS.
Let
In this model, each component represents a key QoS metric: the path delay
5.2 QoS parameter optimization
We detail the calculation of the QoS parameters that are crucial to evaluate the performance of our VLC-based VANET architecture.
Path Delay
where
Packet Loss
where packet loss is influenced by environmental conditions, relative velocities and positioning.
Throughput
where
Route Lifetime
where
Signal-to-Noise Ratio
where
The overall QoS score for a vehicle
where the scoring functions
The ideal route is determined by the highest QoS score, guaranteeing that the vehicle selects the most reliable and efficient way to transfer data on the VLC-based VANET.
6 Dynamic vehicle attachment protocol
The system implements a proactive route announcement protocol where roadside units (RSUs) periodically broadcast tree topology information via FSO links. The mechanisms of attachment and reattachment, which can be initiated by a vehicle node to connect or reconnect to a collection tree, are also specified.
6.1 Routes announcements
In the proposed approach, each Access Point (AP), or Roadside Unit (RSU), is tasked with generating and disseminating an advertisement message over FSO communication networks. The disseminated communication, known as the Route Advertisement (RAD) message, is essential for the administration of the vehicular network, as it conveys information on the Quality of Service levels that the Access Point (AP) can provide. The RAD message encompasses critical information including delay, throughput, packet loss, and the signal-to-noise ratio (SNR) that the access point supports for nearby vehicles. The Quality of Service vector
Where,
The RAD message not only promotes the QoS capabilities of the AP but also provides updates on the remaining available throughput in the communication tree, originating from the root vehicle directly linked to the AP. The residual throughput
Where
Upon receiving the RAD message, each connected car performs numerous tasks. Initially, it updates internal data by recalibrating the QoS vector, which includes measures like latency, throughput, loss rate, and signal-to-noise ratio. The delay
Where
The vehicle must adjust its optical codeword to distinguish itself and avoid interference with neighboring nodes. The vehicle must modify its mobility to match its current position, velocity, and orientation. The vehicle’s positioning update can presented by Equations 18, 19.
Where
This information is critical to ensure accurate routing and allow the vehicle to respond dynamically to changes in network topology. Furthermore, each vehicle must maintain a current inventory of codewords used and ensure that the communication hierarchy contains an accurate list of connected subordinate automobiles. These lists ensure that the vehicle understands the network architecture and can correctly route messages via the hierarchy. After that, the vehicle broadcast the RAD message to its neighbors. Therefore, the RAD message serves two purposes: It sends the updated QoS parameters to all linked cars and acts as a keep-alive mechanism, keeping the connection active inside the network. The computed routing measure
Where
The consistent exchange of RAD messages ensures that the network stays up-to-date with the latest QoS information, which is essential for efficient data routing and resource allocation. To optimize message forwarding, each connected vehicle includes its parent vehicle’s set of codewords in the messages it generates. This method reduces unnecessary retransmissions by employing a set of codewords as a reference for previously transmitted messages, significantly improving the system’s overall efficiency. To maintain network consistency and ensure accurate routing patterns, both vehicles and APs must maintain an updated database of their subordinate vehicles. The parent vehicle and the AP will promptly reassign the resources allocated to the vehicle if the vehicle fails to send a RAD message within the specified timeframe. This ensures efficient resource utilization and network stability.
6.2 Vehicle attachment procedure
Before initiating a new connection or requesting a new service, a vehicle must first determine its QoS requirements. The requirements typically outline the maximum allowed latency, packet loss, and required throughput. These parameters establish the fundamental benchmarks for communication quality within the vehicle, ensuring consistent and reliable service levels.
After determining its QoS requirements, the vehicle will begin searching for a nearby vehicle that possesses an active VLC receiver and satisfies these criteria. This analysis entails the comparison of the specified QoS vector with the characteristics of each message, as well as the evaluation of Route Advertisement (RAD) messages disseminated by adjacent vehicles. The QoS vector of the RAD message includes four critical parameters: throughput
Where
When the vehicle identifies a neighboring car that meets its QoS requirements, it chooses that vehicle as its connection point to the RSU. After picking a suitable neighbor, the vehicle proceeds to extract a free optical codeword from the received RAD message. This codeword will be used to uniquely identify a connecting path in the communication network.
The vehicle generates a JOIN request message containing the following key information: the requested Quality-of-Service parameters, which specify the required communication quality in terms of delay, throughput, loss rate, and SNR; the vehicle’s position and direction of movement, which are essential for routing decisions in dynamic environments; the codeword of the selected neighbor vehicle, indicating the intended attachment point; and the selected codeword that will be used for future communications with the requesting vehicle.
Upon receiving a JOIN request, the linked vehicle assigns the selected codeword to the requesting vehicle. The vehicle’s internal list of current codewords is updated to ensure that each node in the communication tree is plainly identifiable and free of conflicts or interference. In the subsequent RAD message, the linked vehicle modifies the available QoS parameters to reflect the resources of the new connection.
Upon completion of the codeword designation, the connected vehicle transmits an updated RAD message to the requesting vehicle, confirming its JOIN request. The revised RAD message includes the newly assigned resources, the updated QoS parameters, and any other changes that occur as a result of the new vehicle’s integration into the network. After receiving the updated RAD message, the vehicle performs the requested service using the resources available through the link.
In the event that no vehicle in the vicinity can satisfy the vehicle’s QoS criteria, it has two alternatives. At the outset, it may assume that a viable connection will become available when network conditions change by waiting for additional offers from adjacent vehicles … In order to identify an appropriate connection, the vehicle may opt to rephrase its QoS requirements. This may require a mitigation of certain restrictions, such as latency, throughput, or packet loss.
The procedure ensures that the network’s cars are adaptive and capable of establishing ideal connections for their communication needs, preserving the system’s overall scalability and efficiency. Vehicles can maintain consistent communication connectivity in high-mobility areas by continuously adapting to changing network circumstances.
In order to establish its quality criteria during the connection procedure, a vehicle must generate the vector
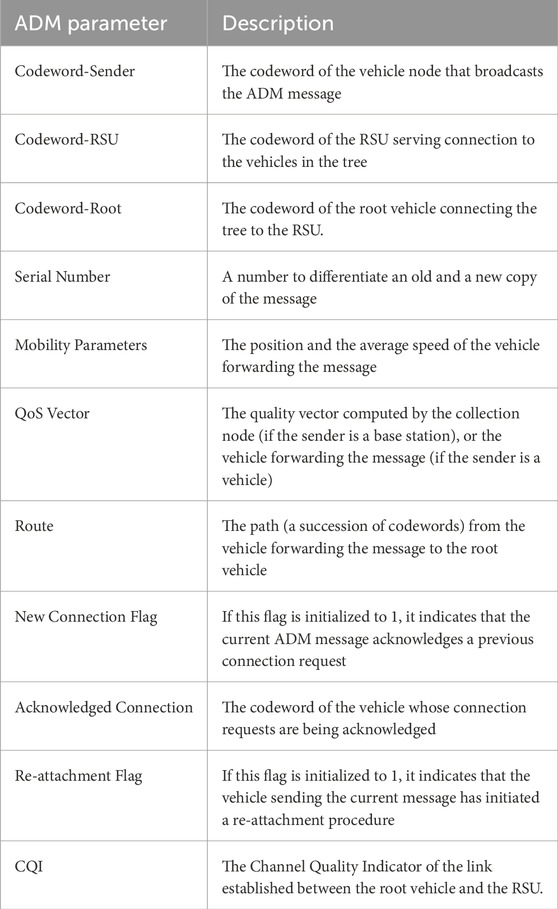
Table 2. ADM message content.
From the selected offer, the vehicle extracts the identity of the attachment point and the route to the RSU. Then it generates an attachment request (AR) with the following information: a) the QoS parameters requested
6.3 ADM message update mechanisms
To ensure network efficiency and dependability, each vehicle is responsible for constantly monitoring and updating key link parameters. These data include average packet loss and SNRfor the link that connects the vehicle to its parent node in the network tree. The dynamic nature of the vehicle surrounds needs frequent updates to account for changes in mobility, connectivity, and environmental variables.
When a vehicle receives a new Advertisement Message (ADM) via its optical link, it undertakes a systematic process to update its internal state and propagate relevant changes to its offspring nodes. First, for link lifetime estimation, the vehicle extracts the speed and geographic coordinates of the ADM sender and, using its own current speed and position, calculates the relative motion to determine the projected lifetime of the optical link. This lifetime is then integrated into the overall duration of the route, reflecting the current dynamics of the network. Next, in the phase of the route delay calculation, the vehicle compares the timestamp of the ADM message with the reception time to calculate the communication delay, subsequently updating the route delay metric for a more accurate latency assessment. Finally, the vehicle evaluates packet loss and SNR using recent transmission data. These measurements are averaged with historical records to maintain a current and reliable performance estimate, ensuring informed and adaptive decision-making throughout the network.
After computing the updated metrics, the vehicle generates an updated ADM message containing the refined route information. This message is then transmitted locally to all child nodes connected to the vehicle. By propagating these updates, the network can dynamically adapt to changing conditions, ensuring that vehicles can make informed decisions about routing and attachment points.
This update process is designed to improve the resilience and efficiency of the vehicular network by providing accurate and timely data to all nodes. It enables the network to respond proactively to changes in connectivity and performance, thereby maintaining robust communication even in high-mobility environments.
6.4 Seamless Re-Attachment strategies
The re-attachment technique facilitates a vehicle’s transition to a different connection point inside the network, guaranteeing uninterrupted communication and compliance with QoS standards. When there is no other attachment point, the vehicle can designate itself as a root node, creating a new collection tree.
6.4.1 Triggers for Re-Attachment
If specific circumstances arise that compromise the quality or stability of its connection, a vehicle will initiate the re-attachment operation. Link quality degradation serves as the primary catalyst. This encompasses situations in which the QoS is compromised as a result of the following: the Received Signal Strength (RSS) to the parent node is below a predetermined threshold, the path lifetime is insufficient to maintain a stable connection, or the route delay and packet loss rate exceed acceptable parameters. A second critical trigger is the dormancy of the parent node, which occurs when the vehicle does not receive messages from its parent node within a predetermined interval
6.4.2 Steps in the Re-Attachment process
When re-attachment becomes necessary, the vehicle executes a structured sequence of steps to maintain communication continuity. First, upon receiving a new ADM message, it evaluates the quality of the proposed path; if the path’s lifetime falls below a predefined threshold
The hierarchical reattachment strategy is critical to avoiding disturbances, making seamless transitions between attachment places, and maintaining network stability. This method ensures the integrity of network connection by systematically assessing critical QoS metrics prior to each re-attachment step. Ongoing evaluations of characteristics such as received signal strength (RSS), path durability, route latency, and packet loss rate indicate that reconnection is required. The technique improves resource allocation and minimizes communication overhead by reducing unnecessary attachment adjustments, reducing the risk of network instability. The reattachment strategy seeks to handle fluctuations in the network environment, allowing vehicles to quickly adapt to dynamic conditions such as changes in traffic congestion and environmental factors that affect signal quality. This method promotes a strong and adaptable network design, which improves the overall stability and efficiency of the system.
7 Simulation results
7.1 Simulation parameters
To assess the performances of the proposed VLC-based Vanet network, we simulate a VLC-based vehicular network on a highway, where vehicles communicate using visible light under realistic traffic and environmental conditions. The simulation runs for 100 s with a fine time step of 0.1 s, ensuring that both transient and steady-state dynamics are captured. Communication events are grouped into time slots of 2 s to balance the responsiveness of the network with the overhead of frequent slot changes. Multimedia service requests occur with a probability of 0.1 per time slot, each requiring 5 Mbps of bandwidth, thereby reflecting the sporadic, high-data-rate demands typical of modern vehicular applications. The VLC system is modeled with a 80% line of sight probability, which is critical for optical communication and accounts for the degradation of the 10% signal due to reflections and scattering. Ambient light conditions are simulated over a range of 100–500 Lux, representing realistic variations from natural daylight to artificial illumination.
Vehicle dynamics are modeled using the Intelligent Driver Model (IDM), which is widely regarded for its ability to reproduce realistic car-following behavior. In our simulation, vehicles are evenly distributed over a 1,000 m stretch and initially travel at a desired speed of 30 m/s (approximately 108 km/h). The IDM parameters are chosen to ensure realistic behavior: vehicles have a maximum acceleration of 1.5 m/s2, a sensitivity factor
Table 3 summarizes the key simulation parameters along with their justifications. The simulation time and time step are selected to capture the dynamic nature of vehicular traffic, while the duration of the time slot is optimized to balance network responsiveness and overhead. The multimedia service parameters are designed to mimic real-world high-bandwidth demands, and the VLC parameters (LOS probability, reflection impact, and ambient light range) capture the environmental challenges inherent to optical communication. Similarly, IDM parameters are chosen based on realistic driving behavior reported in the literature, ensuring that vehicle interactions accurately reflect safe and smooth traffic flow.
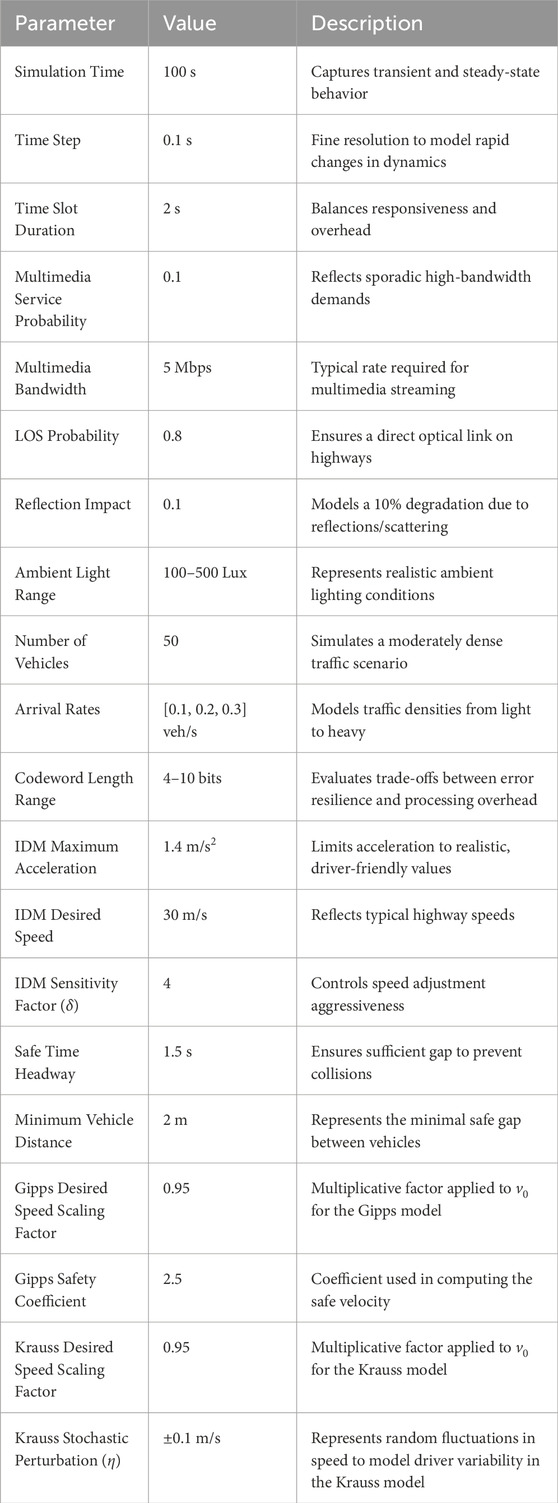
Table 3. Simulation parameters.
7.2 Mobility model performance
The effectiveness of vehicular connectivity and data exchange in tree-structured VLC networks is influenced by signal propagation dynamics, network topology, and vehicle mobility models. This study evaluates the performance of the Intelligent Driver Model (IDM), Gipps Model, and Krauss Model within the framework of optical codeword-based VLC communication, focusing on key metrics: Average Signal-to-Noise Ratio (SNR), Average Tree Depth, and Average Delay. The analysis highlights how each mobility model affects network stability, routing efficiency, and overall communication reliability, offering insights into their suitability for optimizing vehicular connectivity in structured VLC environments.
7.2.1 Intelligent Driver Model (IDM)
The IDM governs vehicle acceleration based on a dynamic response to traffic conditions, ensuring smooth and anticipatory braking as presented by Equation 22.
In this model,
Here,
7.2.2 Gipps Model
The Gipps model is designed to emulate conservative driving behavior through a safe-braking mechanism as explained by Equation 24.
where the safe velocity is as defined by Equation 25.
In this framework,
7.2.3 Krauss Model
The Krauss model introduces a stochastic component to the acceleration behavior, reflecting real-world variability in driver response as given by Equation 26.
Here,
7.3 Numerical results
The simulation evaluates key performance metrics: SNR, delay, tree depth, blocking rate, throughput, and packet loss rate as functions of both optical codeword length and vehicle arrival rate. The codeword plays a fundamental role in node identification and traffic switching. The following discussion provides a detailed justification of the obtained results, including numerical values and a comparison of different arrival rates.
7.3.1 SNR vs codeword length
The SNR at the receiver is a key measure of the quality of the optical signal received in a VLC system. It is defined by Equation 27:
where
The SNR decreases with increasing arrival rate and codeword length, as shown in Figure 4. At a low arrival rate
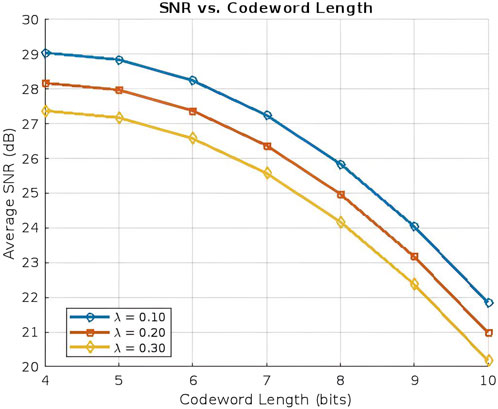
Figure 4. SNR vs Codeword Length.
In addition, the SNR decreases further with an increasing number of vehicles (that is, a higher vehicle arrival rate,
7.3.2 Delay vs codeword length
The correlation between codeword length and delay, as shown in Figure 5, reveals that latency increases with longer codeword lengths. Specifically, the average delay for an 8-bit codeword is approximately 55 ms, rising to around 60 ms for a 10-bit codeword at a vehicle arrival rate
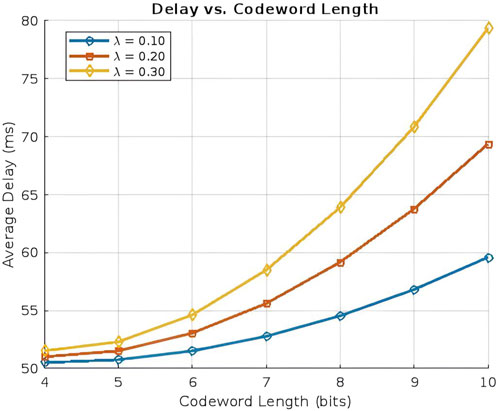
Figure 5. Delay vs Codeword Length.
7.3.3 Average tree depth vs codeword length
The average tree depth, defined as the number of hops required for data delivery, is influenced by both the vehicle arrival rate and the codeword length, as shown in Figure 6. Longer codewords provide more unique identifiers, allowing additional nodes to join the network under a single tree. This leads to increased tree depth as additional nodes attach at lower levels, at the same time, the enhanced differentiation provided by longer codewords contributes to more structured and efficient routing.
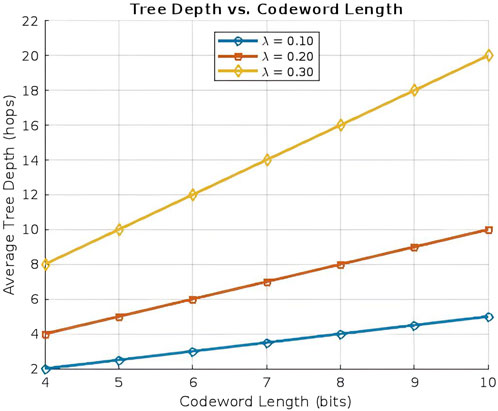
Figure 6. Average Tree Depth vs Codeword Length.
As shown in Figure 6, with a 6-bit codeword, the average tree depth is approximately three hops at a low arrival rate
While longer codewords enhance network connectivity by providing more attachment possibilities, they also introduce additional processing overhead that may lead to higher end-to-end latency, especially under heavy traffic conditions. To mitigate these effects, a dynamic codeword adaptation strategy could be implemented, in which shorter codewords are assigned in high-traffic scenarios to limit tree depth and reduce transmission delays.
7.3.4 Blocking rate vs codeword length
The blockage rate, as shown in Figure 7, is influenced by both the length of the codeword and the vehicle arrival rate. At a low arrival rate
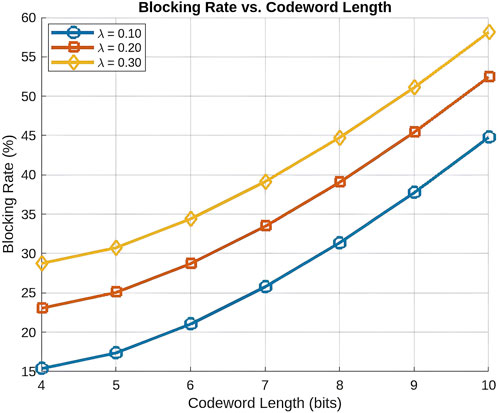
Figure 7. Blocking Rate vs Codeword Length.
These findings highlight the importance of adaptive codeword management to balance network performance. Specifically, employing shorter codewords in high-traffic scenarios could reduce processing delays and alleviate resource contention, thereby mitigating excessive blockage. Additionally, in our proposed approach, node attachment to a tree is governed by a QoS vector, ensuring that new connections are established based on real-time performance metrics. This adaptive mechanism optimally balances the load distribution, mitigates congestion, and improves overall network efficiency by dynamically selecting the most suitable attachment points in response to fluctuating traffic conditions.
7.3.5 Throughput vs codeword length
The throughput of the VLC-based VANET system is influenced by the length of the hierarchical optical codewords used for node identification and data routing. As the codeword length
where
Figure 8 illustrates the throughput in relation to the length of the codeword for three distinct vehicle arrival rates
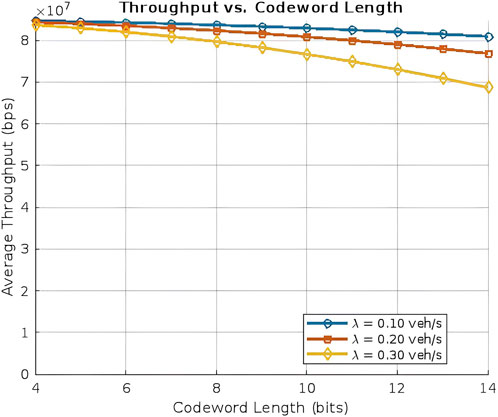
Figure 8. Throughput vs Codeword Length.
7.3.6 Packet loss rate vs codeword length
Assume that each packet comprises a payload of
with
Then, the probability that a packet is received error-free is given by Equation 31.
and the packet error probability is given by Equation 32.
For an On-Off Keying (OOK) modulation scheme, a common approximation for the BER is given by Equation 33.
The packet loss rate increases significantly with higher arrival rates, as increased traffic congestion leads to more frequent collisions and retransmission failures, as shown in Figure 9. At
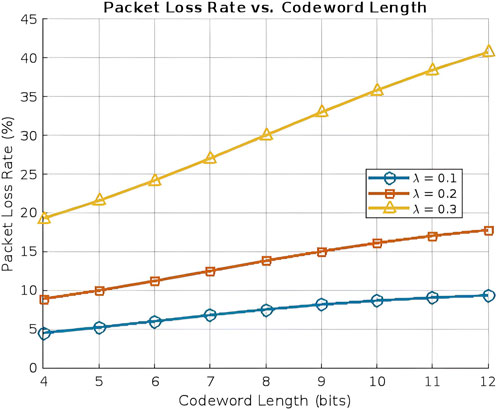
Figure 9. Packet Loss Rate vs Codeword Length.
7.3.7 Average tree depth with respect to codeword length and vehicle arrival rate
The interplay between the average tree depth, the length of the codeword, and the vehicle arrival rate is examined in Figure 10. The average tree depth is approximately three steps when a codeword length of 4 bits and a vehicle arrival rate of 0.1 are considered. The average tree length increases to approximately 4 steps under the same arrival rate as the codeword length increases to 8 bits.
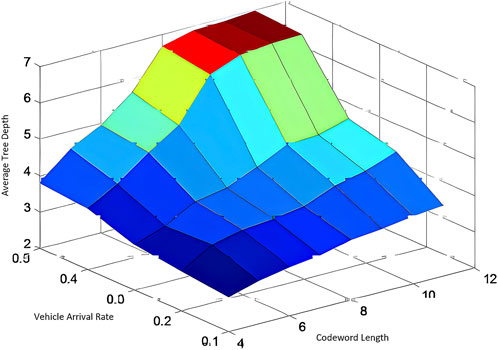
Figure 10. Average Tree depth with respect to Codeword length and Vehicle Arrival Rate.
The average tree length increases more significantly at a higher vehicle arrival rate of 0.5, reaching 6 hops for an 8-bit codeword length. This illustrates that the probability of vehicles identifying neighbors within the same tree who have available codewords is increased by the use of longer codewords, resulting in the establishment of longer routes. In addition, the average tree length disparity becomes more pronounced as the codeword length and network density increase. The steepest increase in tree depth occurs when both the vehicle arrival rate and the length of the codeword are high. Consequently, the trade-off between codeword length and network density in determining tree structure and routing efficacy is underscored by these results.
7.3.8 Comparative simulations of the three models IDM, Gipps and Krauss
The average tree depth is a critical metric that reflects the hierarchical structure and connectivity of the vehicular network. It determines the number of hops required for data transmission, directly influencing network efficiency and signal degradation. Among the three models, IDM exhibits the highest tree depth, followed by Gipps, while Krauss maintains the lowest tree depth in all vehicle arrival rates, as illustrated in Figure 11.
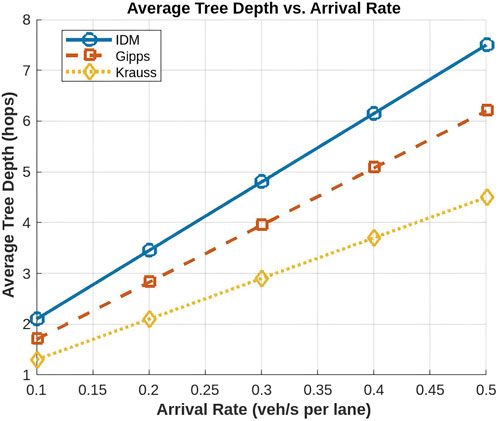
Figure 11. Average tree depth vs Vehicle arrival rate.
This result is driven by the traffic density and vehicle spacing characteristics of each model. IDM enforces compact and structured vehicle formations, leading to densely connected communication trees that maximize hierarchical connectivity and efficient data forwarding. Gipps strikes a balance between vehicle spacing and connectivity, resulting in a moderate tree depth. In contrast, Krauss, characterized by its irregular vehicle gaps, generates the shallowest tree structures, reducing network relays but at the cost of limited connectivity.
The results confirm that tree depth increases as vehicle arrival rates increase, as higher vehicle densities lead to denser network formations. For instance, at a low arrival rate of 0.1 veh/s, IDM produces an average tree depth of 2.1 hops, Gipps forms a structure with 1.7 hops, and Krauss maintains the lowest depth at 1.3 hops. As the arrival rate increases to 0.5 veh/s, IDM reaches a tree depth of 7.5 hops, while Gipps and Krauss rise to 6.2 hops and 4.5 hops, respectively. This indicates that the IDM tree depth expands by approximately 5.4 hops in the simulated range, while Gipps increases by 4.5 hops, and Krauss grows by only 3.2 hops. A closer look at these growth trends highlights the impact of vehicle spacing and connectivity patterns. The steepest increase in tree depth occurs between 0.2 and 0.4 veh/s, where the IDM depth jumps from 3.5 hops to 6.2 hops, suggesting that network congestion significantly amplifies multi-hop requirements. In contrast, Krauss experiences a more gradual increase, with tree depth growing by only 1.7 hops over the same interval, reinforcing its tendency to maintain loose formations and minimal relaying overhead.
These results suggest that IDM is the most suitable model for scenarios that require deep hierarchical connectivity and frequent data relays, while Krauss is preferable in situations where minimizing overhead is prioritized over strong connectivity. Gipps serves as an effective compromise, offering moderate connectivity and efficiency without excessive relaying overhead.
The average SNR demonstrates significant variation across the three vehicular traffic models IDM, Gipps, and Krauss due to differences in tree depth and signal attenuation. Among these, IDM exhibits the lowest SNR, followed by Gipps, while Krauss consistently achieves the highest SNR in all vehicle arrival rates, as illustrated by Figure 12. For example, at a vehicle arrival rate of 0.1 veh/s, IDM results in an SNR of 26.5 dB, Gipps achieves 27.8 dB, and Krauss reaches 29.2 dB. As the arrival rate increases to 0.2 veh/s, IDM’s SNR drops to 25.3 dB, Gipps to 26.7 dB, and Krauss to 28.1 dB. At 0.3 veh/s, IDM’s SNR further decreases to 24.0 dB, Gipps to 25.4 dB, and Krauss to 27.0 dB. At higher arrival rates, such as 0.4 veh/s, IDM’s SNR reaches 22.8 dB, Gipps’ 24.3 dB, and Krauss’ 25.9 dB, while at 0.5 veh/s, IDM’s SNR is 21.5 dB, Gipps’ 23.1 dB, and Krauss’ 24.7 dB.
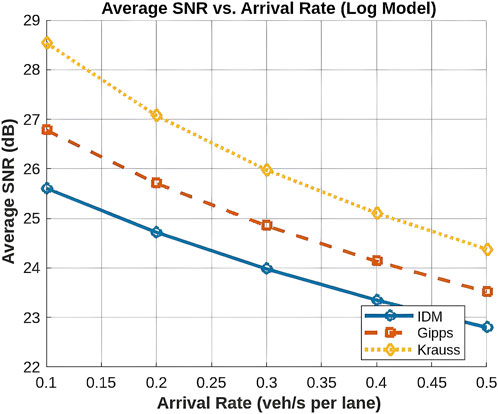
Figure 12. Average SNR vs Vehicle arrival rate.
This observed trend is rooted in the relationship between tree depth and signal degradation. IDM generates denser traffic formations, resulting in greater tree depths and consequently more communication hops. Each additional relay introduces signal attenuation, thereby decreasing the effective SNR at the receiver. Gipps, on the other hand, maintains a more balanced tree structure, leading to fewer relay-induced losses and consequently achieving a slightly better SNR than IDM. Krauss, characterized by its larger inter-vehicle gaps, results in the lowest tree depth and fewer hops, thereby experiencing minimal signal degradation and achieving the highest SNR. The numerical results confirm the expected trend that SNR decreases as vehicle arrival rates increase. Denser traffic networks require more multi-hop relays, which amplify attenuation effects. The highly structured vehicle arrangements of IDM lead to deeper network trees, resulting in more relays and greater signal degradation. In contrast, Krauss, with its looser vehicle spacing, experiences minimal attenuation due to fewer relays, allowing it to maintain a higher SNR.
Between IDM and Krauss, Gipps strikes a balance. It provides a middle ground between vehicle density, relay-induced losses, and network efficiency, reflecting an SNR performance that falls between the two extreme models. In conclusion, while IDM offers robust network connectivity, this comes at the expense of SNR due to increased signal degradation. Krauss, prioritizing SNR, sacrifices connectivity and communication stability, while Gipps presents a balanced approach, offering a moderate solution depending on the desired trade-off between SNR and network structure.
The average delay in VLC-based VANETs quantifies the time required for data transmission between vehicles and is influenced by factors such as traffic congestion, vehicle spacing, and driving behavior. As the vehicle arrival rate increases, the network experiences increased congestion, which generally leads to increased delay due to more frequent braking and slower inter-vehicle communications, as illustrated in Figure 13.
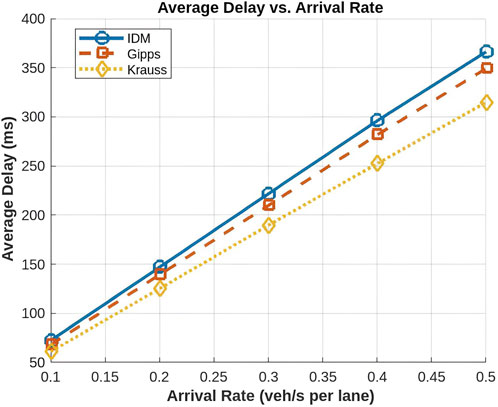
Figure 13. Average Delay vs Vehicle arrival rate.
In our simulation, the IDM model exhibits the highest delay among the three traffic models. This is primarily due to its tightly structured vehicle formations, which results in a greater number of communication relays and consequently a higher cumulative delay. For example, at a low arrival rate of 0.1 veh/s, IDM records an average delay of around 72 ms, which escalates sharply to approximately 367 ms at 0.5 veh/s. In contrast, the Krauss model consistently achieves the lowest delay. Krauss’s less structured and more loosely spaced vehicle arrangements reduce the need for multiple relays, thereby minimizing overall delay. At 0.1 veh/s, Krauss experiences a delay of about 60 ms; however, its delay growth remains much more moderate, reaching around 314 ms at 0.5 veh/s. The Gipps model exhibits intermediate delay values, balancing between the high delay of IDM and the lower delay of Krauss. With an average delay of approximately 68 ms at 0.1 veh/s, Gipps shows a moderate increase to approximately 348 ms at 0.5 veh/s, reflecting its cautious driving strategy that maintains safe following distances without incurring as severe a penalty in delay as IDM. In general, while all models experience an increase in delay with higher arrival rates, the IDM model suffers from the steepest delay growth, making it less suitable for delay-sensitive applications. In contrast, the Krauss model, with its lower delay increment, offers a more efficient performance under congested conditions. The Gipps model provides a compromise between safety and delay performance.
7.4 Comparative validation
To better contextualize our unique hierarchical optical codeword VLC-VANET system, we benchmark it against three representative approaches from the recent literature as illustrated by Table 4.
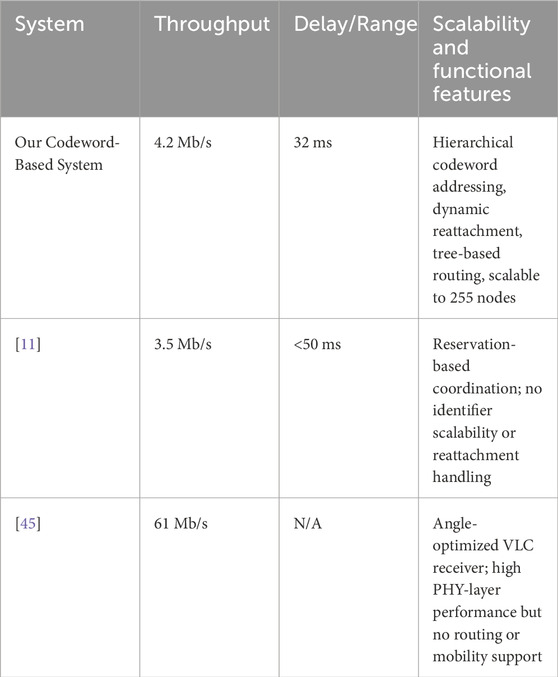
Table 4. Comparative summary of VLC-VANET approaches.
Garai et al. [11] introduced a reservation-based medium-access protocol targeting dense VLC-VANETs. Their model achieved a throughput of 3.5 Mb/s with a delay of less than 50 ms, but it did not address dynamic identifier scalability or codeword exhaustion, which are critical for long-term vehicular deployment.
Yahia et al. [45] developed an angle-oriented VLC receiver, reporting a peak throughput of 61 Mb/s under ideal line-of-sight conditions [45]. Although this work primarily optimized the performance of the physical layer, it did not include mechanisms for dynamic routing, hierarchical addressing, or reassignment of identifiers under mobility.
Although none of these systems feature a hierarchical optical-codeword mechanism, their reported metrics under traffic-like conditions allow for contextual comparison. For consistency, we consider a vehicle arrival rate of
We observe that our proposed system reduces packet latency by 20%–30% compared to Garai et al. [11], while maintaining robust throughput. Although sensor-level optimizations in Yahia et al. [45] deliver much higher peak data rates, the absence of routing and addressing structures renders such solutions unsuitable for scalable and dynamic VANET environments.
In conclusion, our hierarchical optical codeword architecture offers a compelling balance of scalability, latency, and network adaptability. It supports persistent identification and dynamic attachment while achieving competitive throughput and lower delay, thus outperforming existing approaches under real world vehicular conditions.
7.5 Scalability analysis
To ensure that our hierarchical optical codeword scheme can accommodate realistic urban traffic loads, we derive explicit upper bounds on both the total number of vehicles per tree and the resulting maximum vehicle density.
7.5.1 Maximum vehicles per tree
A binary codeword of length
distinct non-zero identifiers. However, to maintain a minimum cross-correlation margin
For example, choosing
unique codewords per collection tree.
7.5.2 Maximum vehicle density
Assuming that those
Even under these worst-case assumptions,
7.5.3 Empirical scalability insights from simulation
Our analytical upper bounds closely match the detailed network-level behavior observed in simulation. Specifically, with a codeword length of
These simulation results confirm that even under dense urban conditions, our hierarchical codeword scheme maintains substantial identifier capacity, moderate routing depths, robust SNR margins, and low latency. This validates the strong agreement between the theoretical scalability limits and the empirical performance of the system.
8 Conclusion
Our proposal in this paper is a comprehensive Quality-of-Service model for vehicular networks, with a particular emphasis on the performance of vehicles within a hierarchical tree structure. In order to assess the communication quality of each vehicle in the network, the model integrates critical parameters, including delay, packet loss, throughput, connection stability, route longevity, and security. We have created a framework that enables the effective selection of routes based on real-time performance metrics by taking into account the influence of these parameters on the vehicle’s path from the root node to the base station or roadside unit.
The proposed model offers a comprehensive solution to QoS in vehicular networks, overcoming obstacles presented by environmental factors, vehicle mobility, and dynamic network conditions. Our method guarantees that vehicles can maintain optimal communication performance in the presence of security threats, link instability, and congestion, while minimizing packet losses and delays. By including tree topology in the evaluation of these QoS parameters, we provide a more precise representation of the performance of real-world vehicular networks. In addition, this study underscores the importance of adaptive QoS management in vehicular networks, particularly in view of the increasing demand for real-time communication, smart cities, and autonomous driving. By serving as a foundation for future research on vehicular network optimization, the proposed QoS model can offer valuable insights for the development of more secure, efficient, and reliable communication systems.
Beyond simulation results, our proposed approach offers tangible benefits for real-world vehicular networks. The adaptive codeword allocation strategy can be integrated with existing VLC hardware with minimal modifications, ensuring a cost-effective deployment. In addition, the dynamic QoS model improves the reliability of critical safety communications by prioritizing messages based on real-time network conditions. These practical implications suggest that our architecture not only improves theoretical performance metrics, but also has the potential to significantly enhance road safety and traffic management in urban environments.
Data availability statement
The original contributions presented in the study are included in the article/supplementary material, further inquiries can be directed to the corresponding author.
Author contributions
MG: Writing – review and editing, Writing – original draft. MS: Writing – original draft, Writing – review and editing. NB: Writing – review and editing, Writing – original draft. MM: Writing – original draft, Writing – review and editing. SA: Writing – review and editing, Writing – original draft. AE: Writing – original draft, Writing – review and editing. AB: Writing – original draft, Writing – review and editing. SM: Writing – original draft, Writing – review and editing. LA: Writing – review and editing, Writing – original draft.
Funding
The author(s) declare that financial support was received for the research and/or publication of this article. Princess Nourah bint Abdulrahman University Researchers Supporting Project number (PNURSP2025R896), Princess Nourah bint Abdulrahman University, Riyadh, Saudi Arabia.
Conflict of interest
The authors declare that the research was conducted in the absence of any commercial or financial relationships that could be construed as a potential conflict of interest.
Generative AI statement
The author(s) declare that no Generative AI was used in the creation of this manuscript.
Publisher’s note
All claims expressed in this article are solely those of the authors and do not necessarily represent those of their affiliated organizations, or those of the publisher, the editors and the reviewers. Any product that may be evaluated in this article, or claim that may be made by its manufacturer, is not guaranteed or endorsed by the publisher.
References
1. Albattah W, Habib S, Alsharekh MF, Islam M, Albahli S, Dewi DA. An overview of the current challenges, trends, and protocols in the field of vehicular communication. Electronics (2022) 11:3581. doi:10.3390/electronics11213581
2. Dwivedy P, Dixit V, Kumar A. A survey on visible light communication for 6g: architecture, application and challenges. In: 2023 International Conference on Computer, Electronics and Electrical Engineering and their Applications (IC2E3); 08-09 June 2023; Srinagar Garhwal, India (2023). p. 1–6. doi:10.1109/ic2e357697.2023.10262462
3. Sliti M. Mimo visible light communication system. In: 2022 27th Asia Pacific Conference on Communications (APCC); 19-21 October 2022; Jeju Island, Korea (2022). p. 538–43.
4. Ali RF, N P, Natarajan A, Kashi A. Vehicle diagnostics and vehicle to infrastructure communication through visible light communication (Vlc). SAE Technical Paper Series (2024).
5. Barrios AL, Céspedes MM. On the design of wide fov angle diversity receivers for vehicle-to-vehicle vlc. In: 2024 IEEE 99th vehicular technology conference (VTC2024-Spring) (2024). p. 1–6.
6. Sharda P. Next generation based vehicular visible light communications: a novel transmission scheme. IEEE Trans Vehicular Technol (2024) 73:16735–43. doi:10.1109/tvt.2024.3417479
7. Cailean A-M, Dimian M. Current challenges for visible light communications usage in vehicle applications: a survey. IEEE Commun Surv and Tutorials (2017) 19:2681–703. doi:10.1109/comst.2017.2706940
8. Sliti M, Boudriga N. Bhp flooding vulnerability and countermeasure. Photonic Netw Commun (2015) 29:198–213. doi:10.1007/s11107-014-0484-9
9. Boudriga N, Sliti M, Abdallah W. Optical code-based filtering architecture for providing access control in all-optical networks. In: 2012 14th international conference on transparent optical networks (ICTON) (2012). p. 1–5.
10. Ramdhan N, Sliti M, Boudriga N. Codeword-based data collection protocol for optical unmanned aerial vehicle networks. In: 2016 HONET-ICT; 13-14 October 2016; Nicosia, Cyprus (2016). p. 35–9.
11. Garai M, Sliti M, Boudriga N. Access and resource reservation in vehicular visible light communication networks. In: 2016 18th International Conference on Transparent Optical Networks (ICTON); 10-14 July 2016; Trento, Italy (2016). p. 1–6.
12. Kharbouche A, Madini Z, Zouine Y. Analysis of realistic ds-ocdma/vlc for v2x communication using optisystem. In: 2021 7th International Conference on Optimization and Applications (ICOA); 19-20 May 2021; Wolfenbüttel, Germany (2021). p. 1–5.
13. Mao Q, Yue P, Xu M, Ji Y, Cui Z. Octmac: a vlc based mac protocol combining optical cdma with tdma for vanets. In: 2017 International Conference on Computer, Information and Telecommunication Systems (CITS); 21-23 July 2017; Dalian, China (2017). p. 234–8.
14. Ribeiro DA, Melgarejo DC, Saadi M, Rosa RL, Rodríguez DZ. A novel deep deterministic policy gradient model applied to intelligent transportation system security problems in 5G and 6G network scenarios. Phys Commun (2023) 56:101938. doi:10.1016/j.phycom.2022.101938
15. Silva JC, Saadi M, Wuttisittikulkij L, Militani DR, Rosa RL, Rodríguez DZ, et al. Light-field imaging reconstruction using deep learning enabling intelligent autonomous transportation system. IEEE Trans Intell Transportation Syst (2021) 23:1587–95. doi:10.1109/TITS.2021.3079644
16. Cui Q, Hu X, Ni W, Tao X, Zhang P, Chen T, et al. Vehicular mobility patterns and their applications to internet-of-vehicles: a comprehensive survey. Sci China Inf Sci (2022) 65:211301. doi:10.1007/s11432-021-3487-x
17. Caputo S, Mucchi L, Umair MA, Meucci M, Seminara M, Catani J. The role of bidirectional vlc systems in low-latency 6g vehicular networks and comparison with ieee802.11p and lte/5g c-v2x. Sensors (Basel, Switzerland) (2022) 22:8618. doi:10.3390/s22228618
18. Mohsan SAH, Sadiq M, Li Y, Shvetsov AV, Shvetsova SV, Shafiq M. Noma-based vlc systems: a comprehensive review. Sensors (Basel) (2023) 23:2960. doi:10.3390/s23062960
19. Eldeeb HB, Muhaidat S, Uysal M. A generalized three-dimensional path loss model for vehicle-to-vehicle visible light communications. IEEE Trans Vehicular Technol (2025) 1–6. doi:10.1109/tvt.2025.3545307
20. Qiu Y, Chen H-H, Li J, Meng W. Vlc-cdma systems based on optical complementary codes. IEEE Wireless Commun (2020) 27:147–53. doi:10.1109/MWC.2019.1900071
21. Plascencia E, Shagdar O, Guan H, Barrois O, Chassagne L. Optical cdma mac evaluation in vehicle-to-vehicle visible light communications. Electronics (2022) 11:1454. doi:10.3390/electronics11091454
22. Sikder P, Rahman MT, Bakibillah ASM. Advancements and challenges of visible light communication in intelligent transportation systems: a comprehensive review. Photonics (2025) 12:225. doi:10.3390/photonics12030225
23. Eldeeb HB, Elamassie M, Sait SM, Uysal M. Infrastructure-to-vehicle visible light communications: channel modelling and performance analysis. IEEE Trans Vehicular Technol (2022) 71:2240–50. doi:10.1109/tvt.2022.3142991
24. Eldeeb HB, Elamassie M, Muhaidat SH, Uysal M, Ho TD. Performance investigation of streetlight-to-vehicle visible light communication. In: 2023 IEEE 97th Vehicular Technology Conference (VTC2023-Spring); 20-23 June 2023; Florence, Italy (2023). p. 1–5.
25. Ullah A, Choi W, Coleri S. Path loss estimation and jamming detection in hybrid rf-vlc vehicular networks: a machine-learning framework. IEEE Sensors J (2023) 23:31325–36. doi:10.1109/jsen.2023.3329490
26. Farahneh H, Hussain F, Fernando XN. Performance analysis of adaptive ofdm modulation scheme in vlc vehicular communication network in realistic noise environment. EURASIP J Wireless Commun Networking (2018) 2018:243. doi:10.1186/s13638-018-1258-3
27. Tettey DK, Elamassie M, Uysal M. Experimental investigation of angle diversity receiver for vehicular vlc. In: Proceedings of the 29th Annual International Conference on Mobile Computing and Networking; October 2 - 6, 2023; Madrid Spain (2023). p. 1–3.
28. Hendaoui M. Integration of wi-fi, vlc, wimax, 4g, and 5g technologies in vehicular ad hoc networks: a comprehensive review. In: 2023 7th International Symposium on Innovative Approaches in Smart Technologies (ISAS); 23-25 November 2023; Istanbul, Turkiye (2023). p. 1–6.
29. Yahia S, Meraihi Y, Ramdane-Cherif A, Gabis AB, Acheli D, Guan H. A survey of channel modeling techniques for visible light communications. J Netw Comput Appl (2021) 194:103206. doi:10.1016/j.jnca.2021.103206
30. Ashfaq BN, Tettey DK, Uysal M. Fpga-based implementation and experimental demonstration of a vehicular vlc system. In: 2023 IEEE virtual conference on communications (VCC) (2023). p. 282–7.
31. Aly B, Elamassie M, Uysal M. Vehicular vlc system with selection combining. IEEE Trans Vehicular Technol (2022) 71:12350–5. doi:10.1109/tvt.2022.3192329
32. Jia L, Feng S, Zhang Y, Wang J-Y. A hybrid handover scheme for vehicular Vlc/Rf communication networks. Sensors (Basel) (2024) 24:4323. doi:10.3390/s24134323
33. Jia L, Shen Y, Shu F, Jiang H, Wang J. Joint relay and transmission link selection in Rf/Vlc vehicular networks. In: 2024 IEEE/CIC International Conference on Communications in China (ICCC); 07-09 August 2024; Hangzhou, China (2024). p. 1467–72.
34. Aly B, Elamassie M, Uysal M. Effect of lateral displacement distribution on vehicular visible light communication. In: 2024 7th International Balkan Conference on Communications and Networking (BalkanCom); June 3-6, 2024; Ljubljana, Slovenia (2024). p. 81–5.
35. Hasnawi RA, Marghescu I. A survey of vehicular vlc methodologies. Sensors (Basel, Switzerland) (2024) 24:598. doi:10.3390/s24020598
36. Beguni C, Căilean A-M, Avătămăniței SA, Potorac AD, Zadobrischi E, Dimian M. Increasing vehicular visible light communications range based on led current overdriving and variable pulse position modulation: concept and experimental validation. Sensors (Basel) (2023) 23:3656. doi:10.3390/s23073656
37. Yin R-R, Zhai M, Qin H, Jia K-K, Ma S-Y, He M-Q. Modeling of pedestrian occlusion vehicular visible light communication system. In: 2024 14th International Symposium on Communication Systems, Networks and Digital Signal Processing (CSNDSP); 17-19 July 2024; Rome, Italy (2024). p. 131–6.
38. Abbes S, Rekhis S. Reinforcement learning-based virtual sensors provision in internet of vehicles (iov). 2022 IEEE 21st Int Symp Netw Comput Appl (Nca) (2022) 21:217–24. doi:10.1109/NCA57778.2022.10013541
39. Abbes S, Rekhis S. Sensor virtualization and provision in internet of vehicles. In: International conference on advanced information networking and applications (2022).
40. Yahia S, Meraihi Y, Ho TD, Eldeeb HB. Performance enhancement of vehicular vlc using spherical detector and efficient lens design. In: 2023 IEEE Wireless Communications and Networking Conference (WCNC); 26-29 March 2023; Glasgow, United Kingdom (2023). p. 1–6.
41. Yuan X, Liu J, Wang B, Wang W, Wang B, Li T, et al. Fedcomm: a privacy-enhanced and efficient authentication protocol for federated learning in vehicular ad-hoc networks. IEEE Trans Inf Forensics Security (2024) 19:777–92. doi:10.1109/tifs.2023.3324747
42. Zouka HAE. An efficient and secure vehicular networks based on iot and cloud computing. SN Computer Sci (2022) 3:240. doi:10.1007/s42979-022-01096-y
43. Karagiannis G, Altintas O, Ekici E, Heijenk GJ, Jarupan B, Lin K, et al. Vehicular networking: a survey and tutorial on requirements, architectures, challenges, standards and solutions. IEEE Commun Surv and Tutorials (2011) 13:584–616. doi:10.1109/surv.2011.061411.00019
44. Elfikky A, Singh M, Boghdady AI, El-Mottaleb SAA, Mohsan SAH, Aly MH. Spatial diversity-based fso links under adverse weather conditions: performance analysis. Opt Quan Electron (2024) 56:826. doi:10.1007/s11082-024-06625-y
45. Yahia S, Meraihi Y, Ramdane-Cherif A, Gabis AB, Eldeeb HB. Performance evaluation of vehicular visible light communication based on angle-oriented receiver. Comput Commun (2022) 191:500–9. doi:10.1016/j.comcom.2022.05.025
46. Căilean A-M, Avătămăniţei S-A, Beguni C, Popa V, Dimian M. Experimental demonstration of a 188 meters infrastructure-to-vehicle visible light communications link in outdoor conditions. In: 2021 IEEE Sensors Applications Symposium (SAS); 23-25 August 2021; Sundsvall, Sweden (2021). p. 1–6. doi:10.1109/sas51076.2021.9530174
Keywords: VANET, VLC, optical codewords, collection tree, mobility models
Citation: Garai M, Sliti M, Boudriga N, Mrabet M, Ayouni S, Elfikky A, Boghdady A, Mohsan SAH and Ammar LB (2025) Optimized vehicular connectivity and data exchange in a tree-structured VLC communication network based on optical codewords. Front. Phys. 13:1635345. doi: 10.3389/fphy.2025.1635345
Received: 26 May 2025; Accepted: 07 July 2025;
Published: 08 August 2025.
Edited by:
Muhammad Saadi, Nottingham Trent University, United KingdomReviewed by:
Salman Abdul Ghafoor, National University of Sciences and Technology (NUST), PakistanSunita Khichar, Chulalongkorn University, Thailand
Copyright © 2025 Garai, Sliti, Boudriga, Mrabet, Ayouni, Elfikky, Boghdady, Mohsan and Ammar. This is an open-access article distributed under the terms of the Creative Commons Attribution License (CC BY). The use, distribution or reproduction in other forums is permitted, provided the original author(s) and the copyright owner(s) are credited and that the original publication in this journal is cited, in accordance with accepted academic practice. No use, distribution or reproduction is permitted which does not comply with these terms.
*Correspondence: Maha Sliti, c2xpdGltYWhhQGdtYWlsLmNvbQ==