Your new experience awaits. Try the new design now and help us make it even better

ORIGINAL RESEARCH article

Front. Phys., 10 September 2025

Sec. Interdisciplinary Physics

Volume 13 - 2025 | https://doi.org/10.3389/fphy.2025.1640293

This article is part of the Research TopicAdvances in Nonlinear Systems and Networks, Volume IIIView all 11 articles

Analysis and application for the source-free circuits

Xiang GaoXiang Gao1Yuhan QianYuhan Qian1Shengpeng LiShengpeng Li1Wenjuan LiWenjuan Li1Yao SuYao Su2Yue Liu
Yue Liu3*
  • 1Aerospace Times FeiHong Technology Company Limited, Beijing, China
  • 2Chinese Academy of Sciences Institute of Automation, Beijing, China
  • 3College of Electrical and Electronic Engineering, Changchun University of Technology, Changchun, China

Introduction: Memristor systems and their application circuits have attracted growing research interest. When a memristor circuit/network is designed, both memristors and conventional electronic components are inevitably required, particularly energy storage elements (e.g., capacitors and inductors). It has found that most existing studies focus on oscillatory phenomena generated by memristive systems, such as chaotic attractors, period-doubling oscillations, spiking and bursting oscillations. However, there is a notable lack of literature exploring and analyzing the energy exchange between these components, as well as the resulting oscillatory behaviors and outcomes arising from such interactions. It is well known that the unit of a memristor, like that of a resistor, is the ohm (Ω). In general circuits, the energy exchange between resistors and energy storage elements can induce nonlinear behaviors such as step functions, damping phenomena, both of which stem from the energy exchange between resistors and capacitors/inductors. So, when a memristor (though physical implementations are rare, several classic mathematical models exist) exchanges energy with energy storage elements, will similar behaviors emerge?

Methods: In this paper, to advance the theoretical completeness of memristive systems and take the classical HP memristor model as an example, four source-free circuit topologies integrating memristors with energy-storage elements are investigated deeply. They are categorized into two types: RMC/RML circuits and series/parallel RMLC circuits. Firstly, through mathematical modeling, the four circuits are all found to be governed by transcendental equations. Secondly, two types of four-component source-free circuits are configured and analysis. Finally, the application circuits comprising four fundamental components was configured and explored.

Results and Discussion: Simulation results for the mathematical models of the four circuits demonstrate memristor states (R0, kRd) and energy-storage elements collectively regulate response characteristics, damped oscillatory and decay behavior. The active power and apparent power curves reveal distinct energy exchange behaviors between components, differing fundamentally from conventional RL, RC, and RLC circuits. These findings demonstrate that due to the presence of memristors, such circuits cannot be employed for step response generation, but are exclusively applicable for energy memorization and dissipation. Then, the following conclusion on two types of source-free circuits are demonstrated: (1) capacitor and inductor provide energy (i.e., ϕ and q) to the system, while memristors exhibit hysteretic behavior, collectively and fundamentally co-modulating oscillation modes and attractor phenomenon; (2) The dual characteristics of memristors—memory capability and energy dissipation—endow them with the potential to break the von Neumann bottleneck, making them essential candidates for implementing next-generation neural networks and AI systems. Finally, the application circuits reveal that even within the same circuit, varying memristor placements can lead to distinct topological configurations and divergent nonlinear output behaviors. This phenomenon further validates the unique characteristics of memristors as an emerging field. These findings establish a solid theoretical and experimental foundation for future exploration and development of memristive systems, including next-generation neural networks, artificial intelligence applications, and aerospace technologies.

1 Introduction

The memristor has been hypothesized as the fourth fundamental circuit component [1] and named. Its fingerprint is a pinched hysteresis loop [2], which is the recovery of pure resistance (no hysteresis) for high frequencies [1, 2]. Subsequently, the HP-memristor was proposed and fabricated as a canonical model. Due to the special electrical properties of nonvolatile memory and extraordinary nonlinearity, the memristor is usually adopted to design the artificial neural networks, memristive circuits, oscillation circuits and employed for unmanned aerial vehicles and motors. Currently, the discussion is focused not only on the application to computation and memory storage, but also on the fundamental role in nonlinear circuit theory. For instance, real synaptic circuits [3, 4]. biological neurons [58], behaviors of some neural network models [9, 10], and even some complex systems [11, 12] with memristors or memristor emulators [11, 1316, 29]. Also, some meaning and interesting nonlinear behaviors and application have also been discovered and published [17], integration to mention just a few.

Totally, all above involved results contributed to improving the circuit theory and exploring related applications in the fields of circuit engineering, such as mathematics, physics, and aerospace circuits. According to the definition of the memristor, whose value depends on its internal parameter, which in turn has to evolve dynamically according either to current and voltage [2]. In other words, when the memristor was configured into one real circuit, the relationship (dΦ=RMdq) between its resistance and the state variable is the essence of characterizing the memristor [15, 18], which have been considered as the basic information to analyze the nonlinear and oscillation behaviors [15, 18], such as chaotic circuits [19], damping circuits [20], Bessel filter [21], diode bridge rectifier [22], and oscillation memristive circuit [23, 30], etc. Some of them addressed and studied the dynamics, and the other showed the complicated chaotic phenomenon [2426]. Furthermore, there are some literatures focused on the memristive oscillators, chaotic attractors [12, 24, 31], and application in synaptic [3], neuron networks [47, 10, 11, 24, 27, 28], and oscillation phenomenon [14, 16, 17], and so on.

Furthermore, it has found that most existing studies focus on oscillatory phenomena generated by memristive systems, such as chaotic attractors, period-doubling oscillations, spiking and bursting oscillations. However, there is a notable lack of literature exploring and analyzing the energy exchange between these components, as well as the resulting oscillatory behaviors and outcomes arising from such interactions. It is well known that the unit of a memristor, like that of a resistor, is the ohm (Ω). In general circuits, the energy exchange between resistors and energy storage elements can induce nonlinear behaviors such as step functions, damping phenomena, both of which stem from the energy exchange between resistors and capacitors/inductors. So, when a memristor (though physical implementations are rare, several classic mathematical models exist) exchanges energy with energy storage elements, will similar behaviors emerge? In this paper, to advance the theoretical completeness of memristive systems and take the classical HP memristor model as an example, four source-free circuit topologies integrating memristors with energy-storage elements are investigated deeply. They are categorized into two types: RMC/RML circuits and series/parallel RMLC circuits. Firstly, through mathematical modeling, the four circuits are all found to be governed by transcendental equations. Simulation results demonstrate memristor states R0, kRd and energy-storage elements collectively regulate response characteristics, damped oscillatory and decay behavior. The active power and apparent power curves reveal distinct energy exchange behaviors between components, differing fundamentally from conventional RL, RC, and RLC circuits. These findings demonstrate that due to the presence of memristors, such circuits cannot be employed for step response generation, but are exclusively applicable for energy memorization and dissipation. Secondly, two types of four-component source-free circuits are configured and the following conclusion are demonstrated: (1) energy-storage elements provide energy (i.e., ϕ and q): to the system, while memristors exhibit hysteretic behavior, collectively and fundamentally co-modulating oscillation modes and attractor phenomenon; (2) The dual characteristics of memristors—memory capability and energy dissipation—endow them with the potential to break the von Neumann bottleneck, making them essential candidates for implementing next-generation neural networks and AI systems. Finally, the application circuits comprising four fundamental components was configured and explored. The study reveals that even within the same circuit, varying memristor placements can lead to distinct topological configurations and divergent nonlinear output behaviors. This phenomenon further validates the unique characteristics of memristors as an emerging field. These findings establish a solid theoretical and experimental foundation for future exploration and development of memristive systems, including next-generation neural networks, artificial intelligence applications, and aerospace technologies. Moreover, once the fundamental rules are improved, more and more foundations could be refined and continual applications in the theories and overall design process, such as nonlinear circuits, the avionics for unmanned aerial vehicle systems, as we shall see.

The remainder of this paper is organized as follows: In Sec II, the information on HP memristive system and two types of general source-free circuits are presented. In Section III, both source-free circuits are introduced, that is, RMC and RML circuits. Then, their mathematical models, novel time constant, the response curves, the trajectories of the power dissipated and energy absorbed are performed, respectively. In Section IV, both series and parallel source-free RMLC circuits are analyzed. In Section V, the application circuits with four components are provided and demonstrate the influence of energy storage elements or memristors on the frequency and oscillatory behaviors. Finally, the paper is summarized in Section VI.

Notably, all the curves in this paper are tested by the software MATLAB R2018a Version, which is a programming and numeric computing platform used by millions of engineers and scientists to analyze data, develop algorithms, and create models.

2 HP memristor and gerenal source-free circuits

As both one fundamental 2-port electric component and the classical model, HP-memristor (RM) has been proposed and manufactured as the charge-controlled memristor [24, 2022]. Its model could be given as follows

RM=dφdq=RoffμvRoffD2Ronqt(1)

where, there are two regions: one region with a high dopant concentration with low resistance Ron, the other region has a low concentration of dopant with a considerably higher resistance Roff. Also, the Equation 1 was named as the linear drift model due to the velocity of the width being linearly proportional to the current. Then, the variable q(t) has been considered as the charge and means the integral of the current i(t).

In order to study the universality of this class of memristive systems, it can be re-written as

RM=R0+kRdidt=R0+kRdqRM=uMt/iMt(2)

where the variable uM(t) is the cross voltage, iM(t) as one function of current and has been defined as the rate of change of the state variable. Defining the parameters R0, k and Rd jointly reflect the relationship between uM(t) and iM(t). Then, the parameter R0 stands in the region which has a low concentration of dopant with a considerably higher resistance Roff. The parameter Rd is one region with a high dopant concentration and low resistance Ron. The parameter k=μVRoff/D2 is defined as a coefficient.

The important trajectory curves are depicted in Figure 1.
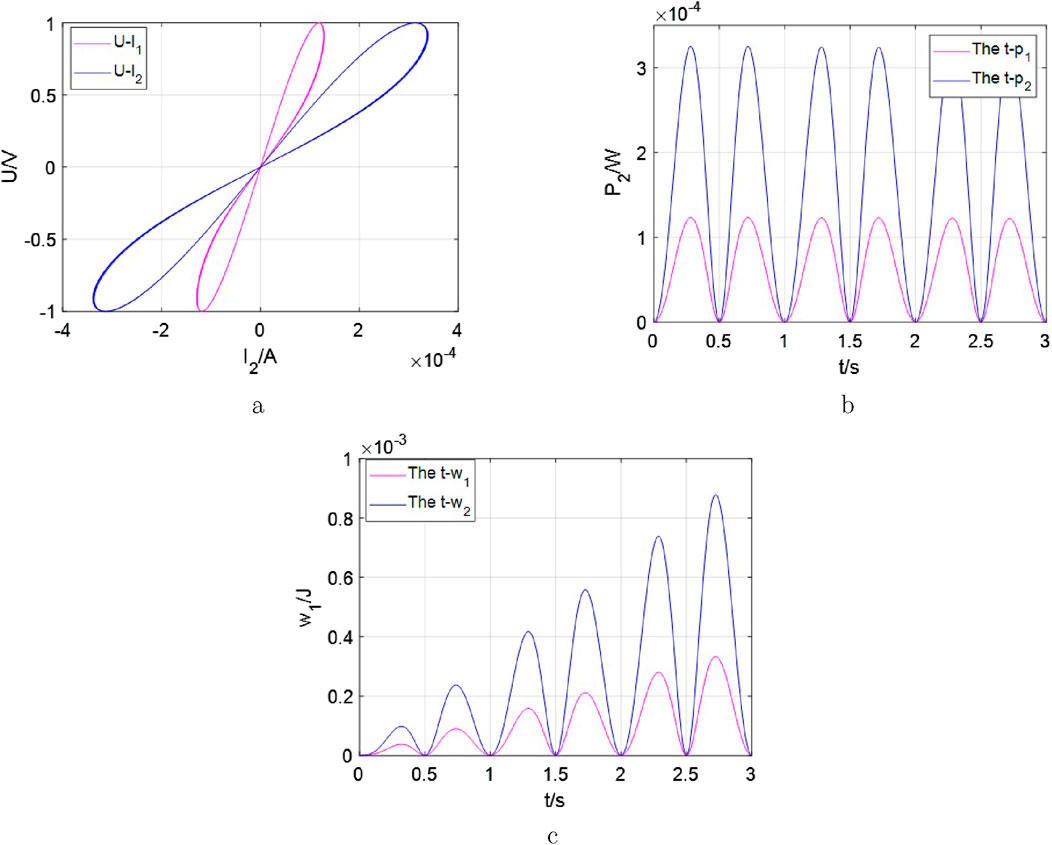
Figure 1
Three graphs display scientific data with various colored lines. Graph (a) shows

Figure 1. Several important relationships between different variants for the memristors, kRd1=106, R01=16k in RM1 and R02=6k, kRd1 = 106 in RM2, dq(t)/dt=i(t)=sin(2t). (a) the curves of vi phase. (b) p(t) by the memristor. (c) w(t) by the memristor.

From Figure 1, it can be seen that these curves are the fingerprints, the dissipated power and energy absorbed in time-domain graphs for the single memristor. They are so complex but cannot be applied directly like the other general discrete elements. Due to the characteristics of the memristive system, its power exhibits a frequency doubling phenomenon. Thus, the related basic fundamentals should be examined as soon as possible via the n-order circuit model with the RM and an energy storage element.

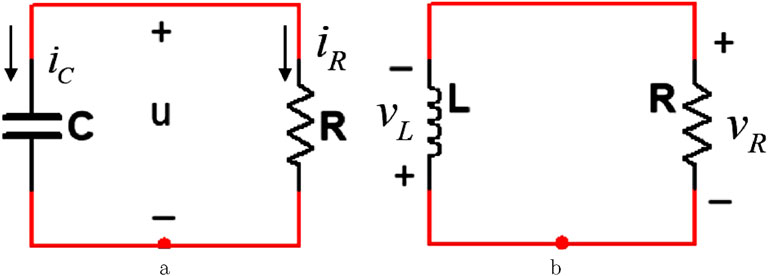
In circuit theory, for an ordinary circuit, there are two excitation methods. One method involves independent sources. The other utilizes the initial conditions of storage elements within the circuit, which are so-called source-free circuits. When energy is initially stored in capacitive or inductive elements, this stored energy drives current flow, which is gradually dissipated in resistors. The rate of dissipation can be calculated by Kirchhoff’s laws. This way has been considered as a sufficient, powerful set of tools to analyze a large variety of electric circuits all the time. Now, this method could be utilized to analyze the following circuits, such as RMC and RML circuits. The classical first-order source-free circuits are shown as Figure 2.

Figure 2
Two circuit diagrams are shown. The first diagram (a) includes a capacitor (C) with current \(i_C\) and voltage \(u\), connected in series with a resistor (R) with current \(i_R\). The second diagram (b) includes an inductor (L) with voltage \(v_L\) in series with a resistor (R) showing voltage \(v_R\). Arrows indicate current direction.

Figure 2. Two types of the classical source-free circuits. (a) RC circuit. (b) RL circuit.

Observing from Figure 2a, when the initial condition is u(0)=U0, the voltage response of the RC circuit could be expressed by an exponential decay of the initial voltage. Also, this result is attributed to the initially stored energy and the circuit’s intrinsic characteristics, rather than its external voltage or current sources. Similar to Figure 2b, it is shown that the natural response of the RL circuit is also an exponential decay of the initial current. Furthermore, the time constant for both RC and RL circuits have been defined as τ=RC and τ=L/R. Subsequently, the natural response could be illustrated graphically in Figures 3, 4. It has been evidence that an exponential decay of the initial condition, dissipated power and the absorbed energy by the resistor for the RC circuit are also given by Equation 3, as the current responses for the RL circuit are shown by Equation 4.
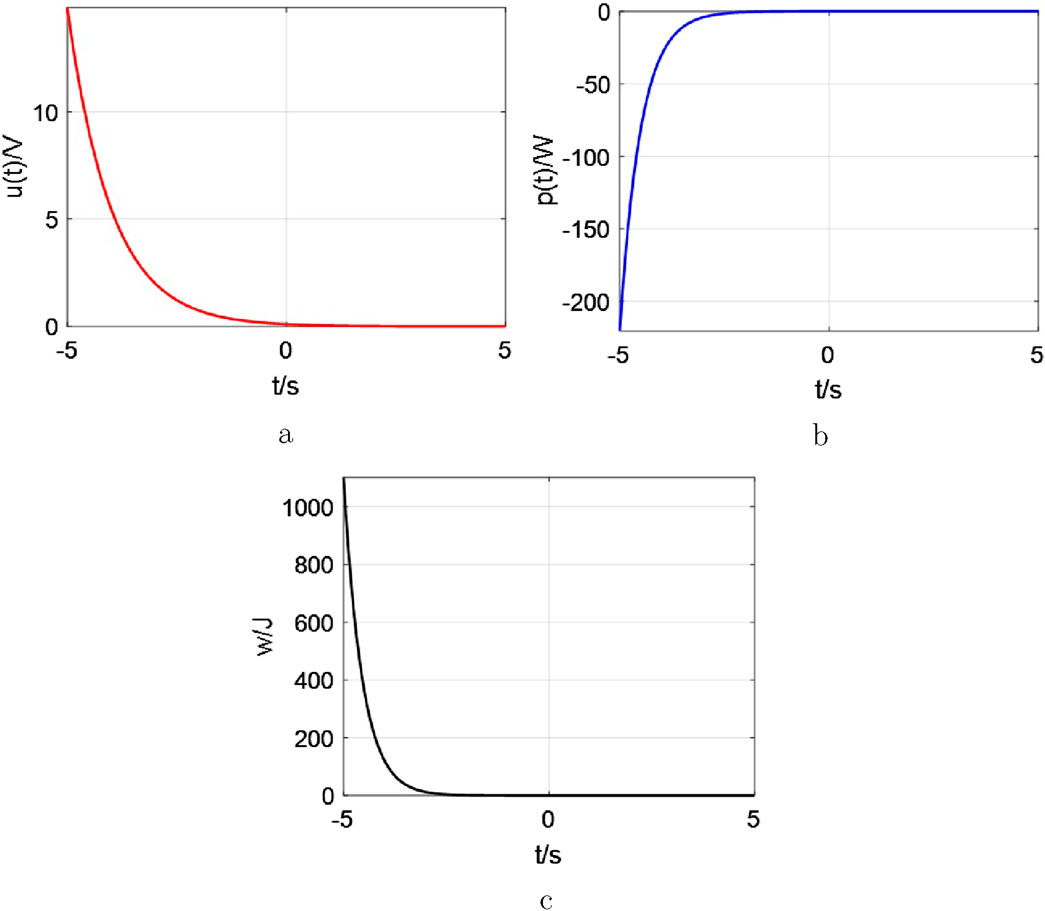
Figure 3
Three graphs labeled a, b, and c show different time-dependent variables. Graph a features a red line representing \( u(t)/V \) sharply decreasing from 10 to 0 over time \( t/s \). Graph b shows \( p(t)/W \) in blue, which rises quickly to level off near 0. Graph c depicts \( W/J \) in black, dropping from 1000 to 0. Each graph spans a time range from -5 to 5 seconds.

Figure 3. The natural response of the RC circuits, u(t0)=U0=0.1V, R=1, C=1F. (a) the curve of the voltage response. (b) p(t) by the resistor. (c) w(t) absorbed by the resistor.
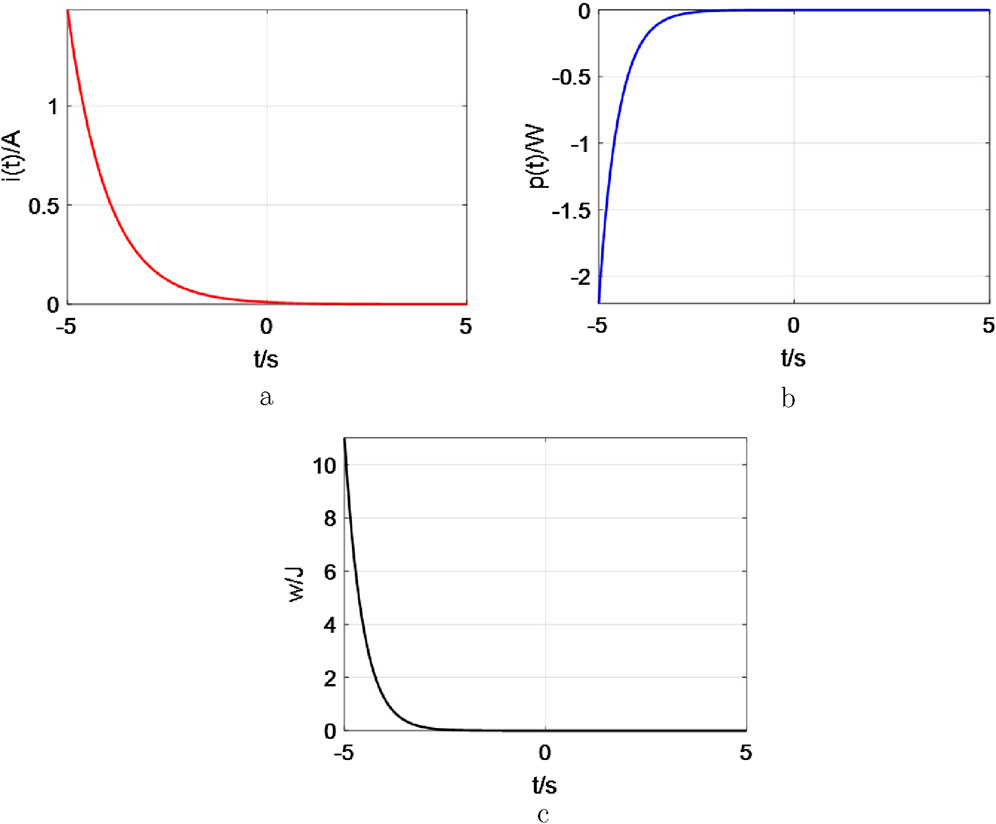
Figure 4
Three graphs show different functions over time. Graph (a) is a red curve depicting \( I(t)/A \) decreasing rapidly to a steady state. Graph (b) shows a blue curve for \( p(t)/W \) increasing sharply to a steady state. Graph (c) illustrates a black curve for \( w/J \) declining quickly to a stable value. Each graph's x-axis ranges from -5 to 5 seconds.

Figure 4. The natural response of the RL circuits, i(t0)=I0=0.01A, R=1, L=1H. (a) the curve of current response. (b) p(t) by the resistor. (c) w(t) by the resistor.

For the source-free RC circuit, when the initial condition u(t0)=u(0)=U0, the results could be given as follows

ut=U0et/τ,τ=RCpt=utiRt=U02Re2t/τwt=0tptdt=12CU021e2t/τ(3)

For the source-free RL circuit, when the initial condition i(t0)=i(0)=I0, the results could be computed as follows

it=I0et/τ,τ=L/Rpt=utiRt=I02Re2t/τwt=0tptdt=12LI021e2t/τ(4)

Observed from Figures 3, 4, when t, wR12CU02 for the RC circuit and wR12LI02 for the RL circuit could be observed. They are the same as the energy initially stored in the capacitor (wc(0)) element in Equation 3 and inductor (wL(0)) element in Equation 4.

The above has already provided a complete description for the properties of classical first-order circuits. Next, we pose a question: when resistors are substituted with memristors (e.g., HP memristors), what kind of conclusions could be obtained? For this purpose, the followingRMC and RML circuits will be configured and analyzed in the next section.

3 The source-free RMC and RML circuits

3.1 The source-free RMC circuits

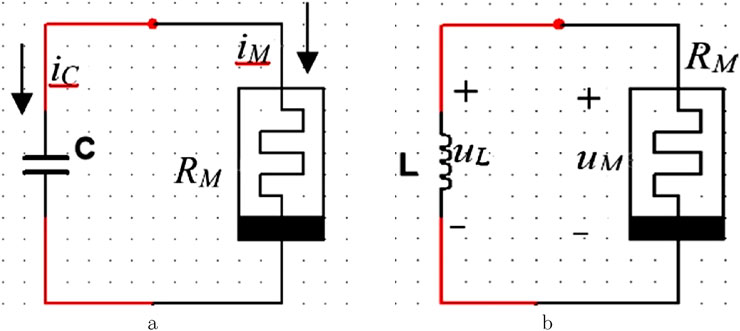
The produced source-free RMC circuit could be drawn as Figure 5a. Applying Kirchhoff’s Laws (i=iC=iM) yields

R0+kRdqCducdt+uc=0(5)

where, the variable u(t)=uc(t) stands for the voltage of the capacitor. Notably that dq(t)/dt=i(t)=iM(t)=iC(t) is the intrinsic variable for Figure 5a. Let τ0=R0C and b=kRdC/R0, the terms could be depicted as

lnu+bu=tτ0(6)

Figure 5
Diagram showing two circuit schematics labeled

Figure 5. The source-free circuits with charge-controlled memristor. (a) RMC circuit. (b) RML circuit.

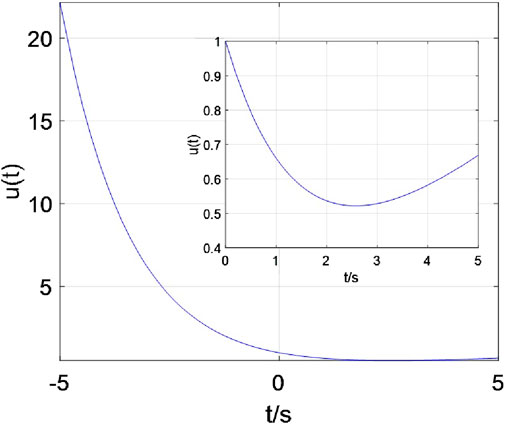
Obviously, Equation 6 a transcendental equation whose solution can only be computed using approximations and cannot be obtained exactly. The natural response curve of the Equation 5 could be illustrated graphically in Figure 6.

Figure 6
Graph showing the function \( u(t) \) over time \( t/s \), from \(-5\) to \( 5 \). Main curve decreases from \( 20 \) to approximately \( 0 \). Inset graph portrays a similar curve, ranging \( 0.4 \) to \( 1 \), dipping between \( 0 \) and \( 5 \).

Figure 6. The natural response of the RMC circuits, the initial value of kRd=0.8106, R0=16k, C=1mF

From Figure 6, this response curve is fundamentally distinct from that of an RC circuit (characterized by a single exponential curve), where the energy stored in the capacitor is entirely dissipated by the resistor. It is more complex and constitutes both exponential and non-exponential functional components. Crucially, although the memristor’s unit is also the ohm (Ω), its model reveals that it consists of both linear and nonlinear resistive components [1,2]. Here, the linear resistive component exhibits the conventional ”energy-dissipation” characteristic of resistors, as manifested by the exponential segment of the curve. However, the energy stored in the capacitor is not fully consumed the remaining portion is ”memorized” by the nonlinear component, which corresponds to the non-exponential segment of the curve. Then, according to the definition of the time constant, setting τ0=R0C and calculators b for this RMC circuit. When the circuit is excited, C provides the stored energy to the RM, the RM works for both memorizing the information and energy dissipation profile, immediately. Memory speed depends on this new time constant (τ0).

There are three variables related to the decay of the voltage response uC(t), which are Rd, R0 and C. Next, the decay behavior would be discussed when only one variable is changed and the other ones are fixed.

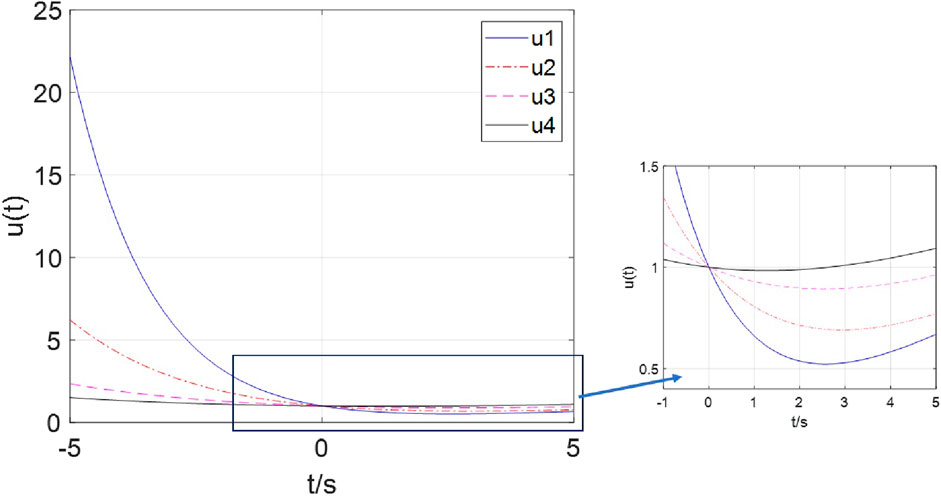
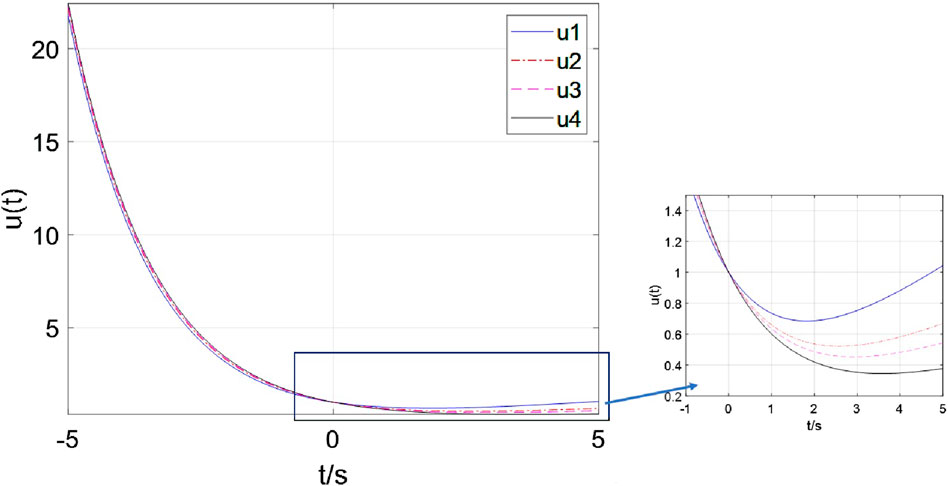
(1) when kRd=0.8104 and C=1mF, changing the variable R0, the response uC(t) are illustrated in Figure 7.

Figure 7
Graph depicting four functions of time, \(u_1(t)\), \(u_2(t)\), \(u_3(t)\), and \(u_4(t)\), with lines colored blue, red-dashed, pink-dashed, and black, respectively. The main graph shows the time \(t\) from \(-5\) to \(5\), with \(u(t)\) values ranging from \(-5\) to \(25\). A zoomed-in inset highlights the interval from \(-1\) to \(5\), with \(u(t)\) values between \(0.5\) and \(1.5\).

Figure 7. The curve of the voltage response with R01=16k in blue, R02=26k in red, R03=46k in pink, R04=66k in black.

Observe from Figure 7, When t<0, the blue curve resides innermost while the black curve lies outermost; when t>0, the blue curve shifts to the bottom position and the black curve to the top. This demonstrates that as the value of R01 increases, the curves become progressively flatter, indicating slower rates for both energy dissipation (“consumption”) and memory retention (“memorization”). Then, the following conclusion could be drawn:

i. A smaller R0 results in a larger τ0 with faster decay dynamics.

ii. A smaller R0 value leads to a significant increase in the proportion of the exponential segment of the curve. The more pronounced the “energy dissipation” component becomes, the more enhanced the ”memory” effect appears.

iii. A certain energy exists to memorize information for the memristor. Therefore, the voltage uC(t) cannot decay to 0 at the t=0.

(2) when kRd=0.8104 and R0=16k, changing the capacitance C, the response uC(t) are illustrated in Figure 8.

Figure 8
Graph showing four exponential decay curves labeled u1 to u4 over time t in seconds. Curves vary slightly among each other. Inset highlights the initial segment from -1 to 5 seconds with values ranging from 0.2 to 1.4.

Figure 8. The curve of the voltage response with C=1mF in blue, C=1.1mF in red, C=1.2mF in pink, C=1.3mF in black.

From Figure 8, when t<0, the blue curve resides innermost while the black curve lies outermost; However, when t>0, the blue curve shifts to the top position and the black curve to the bottom. This demonstrates that as the value of C increases, the curves exhibits a significantly steepened profile, indicating faster rates for both energy dissipation (“consumption”) and memory retention (“memorization”). Then, similar results are still observed.

i. A smaller C results in a larger τ0 with faster decay dynamics.

ii. A smaller C value leads to a significant increase in the proportion of the exponential segment of the curve. The more pronounced the “energy dissipation” component becomes, the more enhanced the “memory” effect appears.

iii. A certain voltage is required to memorize information for the memristor. Therefore, the voltage uC(t) cannot decay to 0 at the t=0. However, the different capacitor C could provide the different storage voltage to the memory.

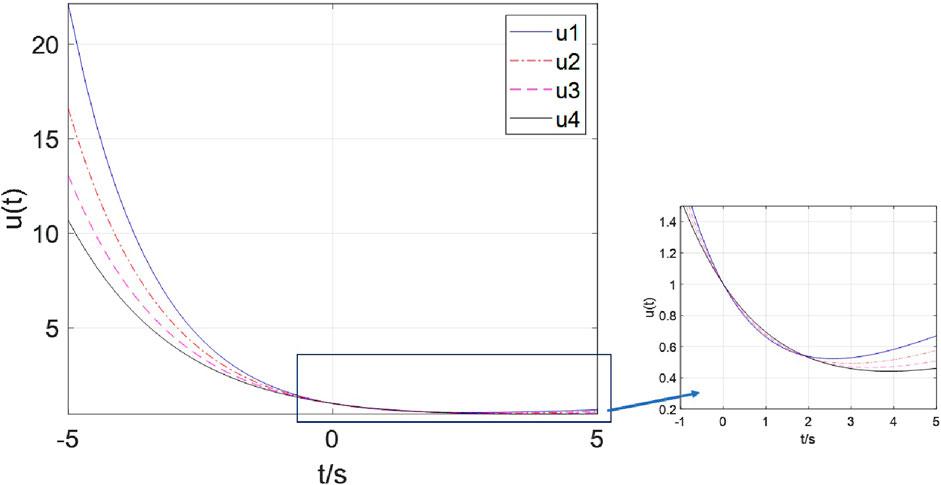
(3) when C=1mF and R0=16k, changing the variable Rd, the response uC(t) are illustrated in Figure 9.

Observed from Figure 9, when t<0, the black curve resides innermost while the blue curve lies outermost; when t>0, the blue curve shifts to the top position and the black curve to the bottom. This demonstrates that as the value of kRd increases, the curves exhibits a significantly steepened profile, indicating faster rates for both energy dissipation (“consumption”) and memory retention (“memorization”). Due to the minimal variation in kRd, the distinction between the curves is not particularly pronounced. Then, different results can be obtained:

i. A larger kRd results in a larger τ0 with faster decay dynamics.

ii. A larger kRd value leads to a significant increase in the proportion of the exponential segment of the curve. The more pronounced the “energy dissipation” component becomes, the more enhanced the “memory” effect appears.

iii. A certain energy exists to memorize information for the memristor. Then, the voltage uC(t) cannot decay to 0 at the t=0.

Figure 9
Plot illustrating four functions, u1 to u4, over time t from negative one to five seconds. The main graph shows values decreasing from around twenty to zero. A zoom-in view highlights differences between the functions near the origin. Each function is distinguished by color and style: solid blue, red dashed-dot, pink dashed, and black solid lines.

Figure 9. The curve of the voltage response with kRd1=0.5104 in blue, kRd2=0.8104 in red, kRd3=104 in pink, kRd4=1.5104 in black.

It should be noted that when applying both RC and RL circuits, they could be treated as the step functions to configure plenty of circuit-networks. However, both RMC and RML circuits are not the step functions. They do not focus on storing and consuming energy, but on memorizing pieces of information. Secondly, the speed of memorizing information is associated with the determined new time constant (τ0). The larger τ0 could lead to the faster the decay as well as speed of memorizing pieces of information. Thirdly, the memristor (RM) satisfies dual properties: memory (R0) and energy consumption (kRd).

Finally, the dissipated power and the absorbed energy by the memristor for the RMC circuit are depicted in Figure 10.
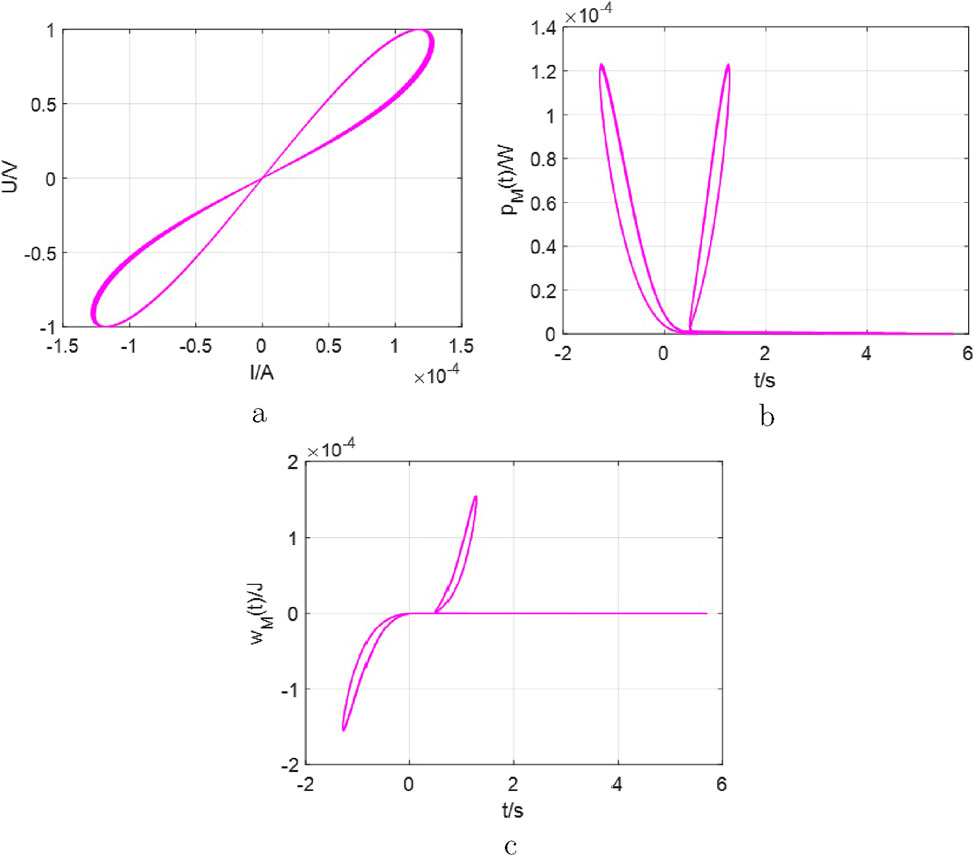
Figure 10
Three graphs display scientific data. Graph a shows a looped curve on a U/V vs. I/A scale. Graph b presents a plot of \( p_{M}(t)/W \) against time in seconds, forming a V-shape. Graph c depicts \( w_{M}(t)/J \) versus time with a curve starting near zero, peaking, and leveling. All graphs use similar magenta-colored lines.

Figure 10. The curves for the RMC circuit with the parameters kRd=0.8106, R0=16k, C=1mF. (a) the fingerprint characterizes of vi for RM). (b) the dissipated power by the memristor up to time t/s). (c) the energy (w(t)) absorbed by the memristor up to time t/s).

Between Figure 1 and Figure 10a, the fingerprint characteristics have been presented. Observed from Figure 10b, some information could be memorized by RMC circuit. Furthermore, dissipative power and absorbed energy are utilized for information storage. This reaffirms the memristor’s fundamental divergence from resistors even though they shared dimensional homogeneity and common unit of ohms (Ω). Moreover, their distinct time constants (τ0) manifests the memory functionality, not the energy dissipation profile.

3.2 The source-free RML circuits

The inductor (L) is the other type of energy storage element. In this subsection, the RML circuit would be configured and discussed. Similar to analyzing the RMC circuit, consider one memristor circuit as shown in Figure 5b.

Applying Kirchhoff’s Laws uL+uM=0, i=iL=iM and Figure 4b, yields

Ldidt+R0i+kRdqi=0(7)

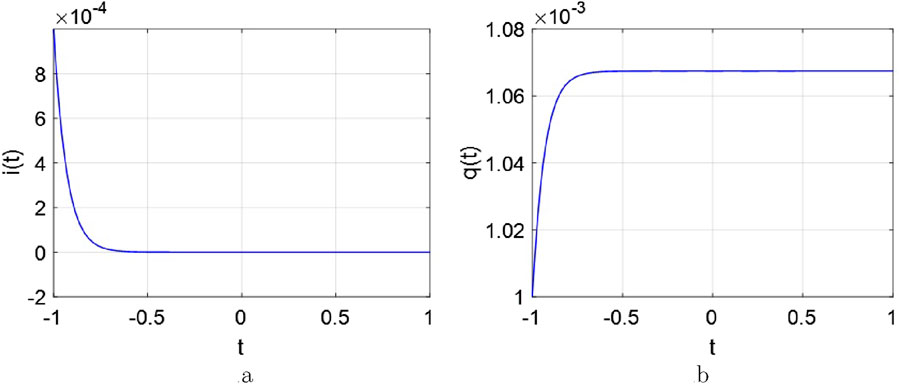
where the variable i(t) stands for the current through the inductor. Hereby, dq(t)/dt=i(t)=iM(t)=iL(t) is the determined relationship. Also, let τ0=L/R0. Obviously, this is also a higher-order transcendental equation. Its natural response curve of the Equation 7 could be illustrated graphically in Figure 11.

Figure 11
Two line graphs show functions over time (t). In graph (a), \(i(t)\) decreases rapidly from 8 to near zero between \(t = -1\) and \(t = 0\). In graph (b), \(q(t)\) increases sharply from 1 to about 1.06 within the same time frame. Both graphs have time (t) on the x-axis, with \(i(t)\) and \(q(t)\) on the y-axes.

Figure 11. The natural response of the RML circuits, the initial value of kRd=0.8106, R0=16k, L=0.1H. (a) i(t)t). (b) q(t)t).

As shown in Figure 11, the depicted response curve bears similarities to the general RL circuit in Figure 2b but also exhibits significant differences. Model (7) reflects more complex and faster nonlinear behavior of higher-order functions. Then, according to the definition of this new time constant (τ0=L/R0), when this circuit is excited, RM immediately begins to store information. At the same time, the inductor (L) is busy converting energy to the memristor. Notably, the speed of memorization depends on τ0.

The decay of the current response i(t) is influenced by three variables: Rd, R0 and L. Next, the decay behavior would be discussed when only one variable is varied and the other remains fixed.

(1) when kRd=0.8104 and L=0.1H, changing the variable R0, the response uC(t) are illustrated in Figure 12.

Observe from Figure 12, the following conclusion could be obtained:

i. A large R0 brings a small τ0, and decays the fast.

ii. A certain current is required, when a memristor memorizes information. Therefore, the current i(t) cannot decay to 0 even at t=0.

iii. The memory characteristics could be occurred by R0.
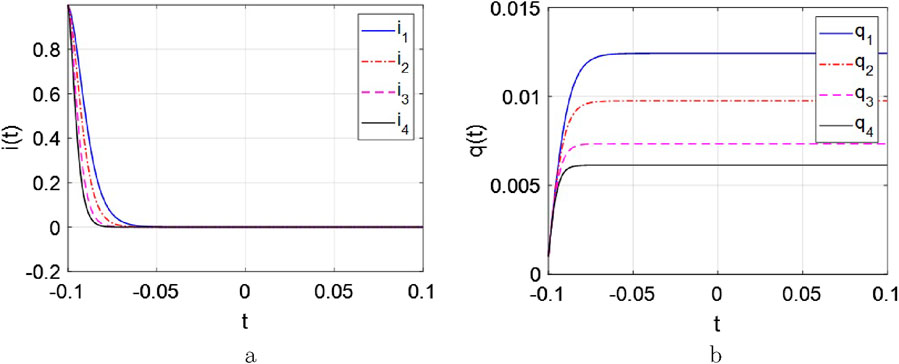
Figure 12
Two graphs display functions over time labeled

Figure 12. The curves of the current and charge response with R01=16k in blue, R02=26k in red, R03=46k in pink, R04=66k in black. (a) i(t)t. (b) q(t)t.

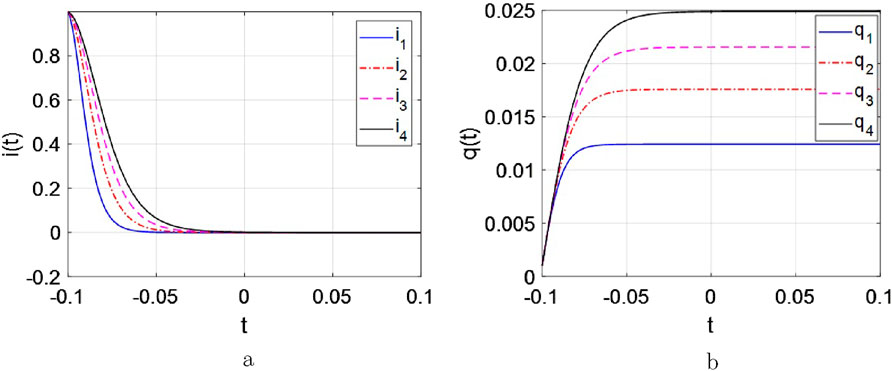
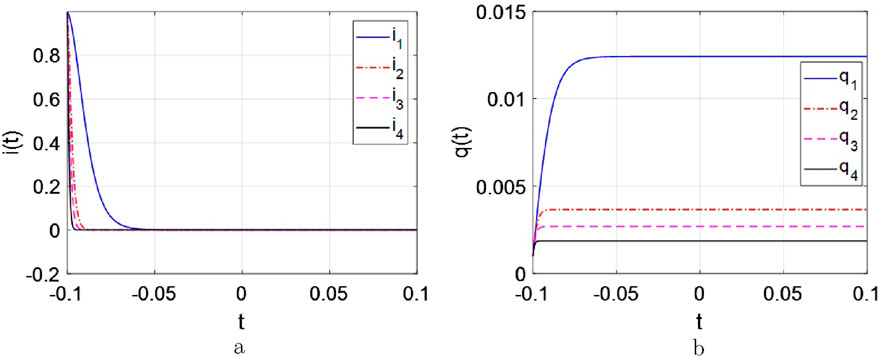
(2) when kRd=0.8104 and R0=16k, changing the inductance L, the response i(t) are illustrated in Figure 13.

Figure 13
Two graphs showing i(t) and q(t) over time t. Graph (a) depicts i(t) with four curves: blue, red dashed, pink dashed, and black, each labeled i1, i2, i3, and i4. Graph (b) shows q(t) with similar curves labeled q1, q2, q3, and q4. Both graphs illustrate data trends converging towards zero as t increases.

Figure 13. The curve of the current and charge response with L1=0.1H in blue, L2=0.2H in red, L3=0.3H in pink, L4=0.4H in black. (a) i(t)t). (b) q(t)t.

From Figure 13, the similar results could be got:

i. A large inductive L brings a large τ0, and decays the slow.

ii. When a memristor is utilized for information storage, the current (i) and charge (q) are altered. Furthermore, the role of the energy storage element L can be demonstrated.

(3) when L=1H and R0=16k, changing the variable Rd, the response uC(t) are illustrated in Figure 14.

Observed from Figure 14, the following results could be given as:

i. A large kRd also leads to decay the fast similar to Figure 12.

ii. The energy consumption characteristics exist and are presented by kRd.

Figure 14
Two graphs display data over time labeled

Figure 14. The curves for the RMC circuit with the parameters kRd=0.8106, R0=16k, C=1mF. (a) i(t)t). (b) q(t)t).

Finally, Figure 15 presents the dissipated power of the RML circuit and the energy absorbed by the memristor.
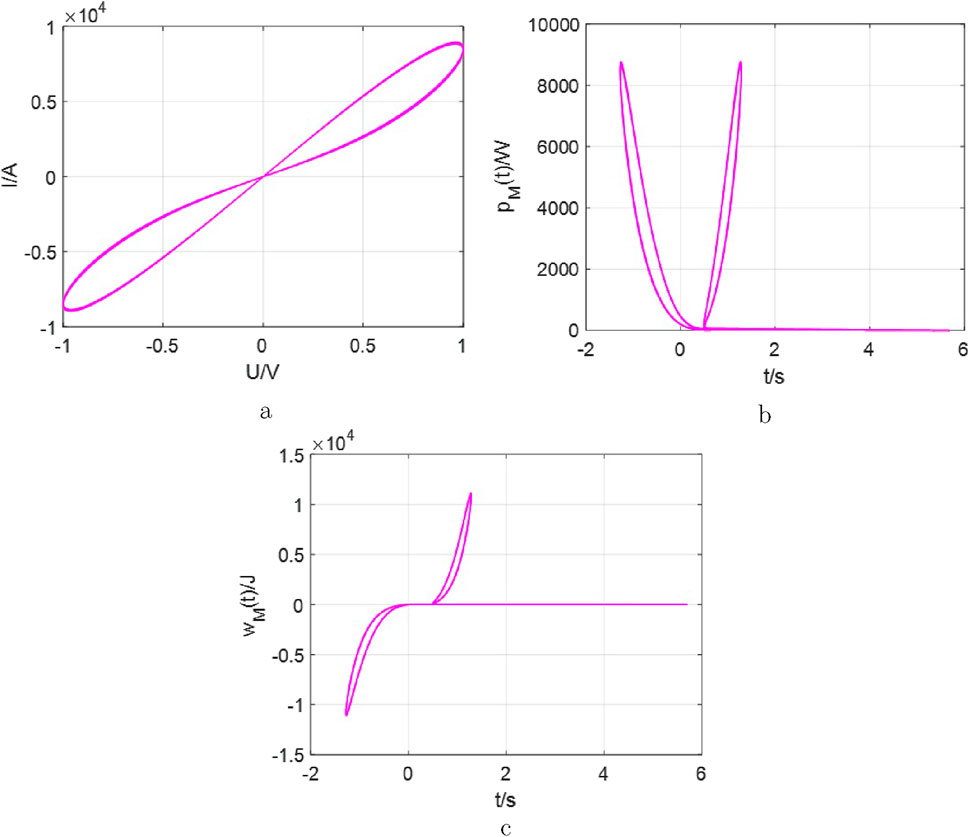
Figure 15
Graph a is an I/A vs. U/V curve showing a loop shape. Graph b is a p<sub>M</sub>(t)/W vs. t/s curve depicting a U-shaped line with peaks around zero. Graph c is a w<sub>t</sub>(t)/J vs. t/s curve with an S-shaped trajectory and peaks around zero. All graphs have pink lines.

Figure 15. The curves for the RML circuit. (a) the fingerprint characterizes of vi for RM). (b) the dissipated power by the memristor up to time t/s). (c) the energy (w(t)) absorbed by the memristor up to time t/s).

Similar to the RMC circuit, when designing a source-free circuit using an inductor and a memristor, its behavior cannot be treated as a step function, too. Because its primary purpose is to store information. The smaller the new time constant leads to the faster the decay. Furthermore, a higher-order transcendental equation has been obtained and more complex nonlinear behaviors have been captured. There are three crucial points in a source-free RML circuit to determine the calculator iL(t), that is, the initial current I0, new time constant τ0, and the integral of the charge q(t) in RM. Thirdly, the memristor is presented with dual characteristics: the memory behavior (represented by R0) and the energy consumption characteristics (described by kRd).

4 The RMLC circuits

Importantly, building memristive circuits is inseparable from energy storage components, similarly, the study of source-free circuits cannot proceed without them. In the aforementioned analysis and discussion of the natural response of the source-free circuits, two transcendental equations incorporating memristor models have been established. Additionally, the new time constant for the both circuits has been redefined. In this section, similar to the analysis of RLC circuits, RMLC circuits could also be connected in two configurations: series and parallel circuits, see Figure 16.

Figure 16
Two electrical circuit diagrams labeled 'a' and 'b'. Diagram 'a' shows a series circuit with a motor with internal resistance \( R_M \), an inductor \( L \), a capacitor \( C \), and a resistor \( R \). Diagram 'b' depicts a parallel circuit configuration with similar components: a motor \( R_M \), an inductor \( L \), a capacitor \( C \), and a resistor \( R \). Arrows indicate current direction.

Figure 16. The source-free RMLC circuits with charge-controlled memristors. (a) the series circuit. (b) the parallel circuit.

4.1 A.Series circuit

Applying Kirchhoff’s Laws (i=iR=iC=iL=iM) and Figure 16a, according to the description of Equation 2, the following Equation 8 could be built as following

Ri+R0+kRdqi+Ldidt+u=0i=Cdudtq=idti0=I0,u0=U0(8)

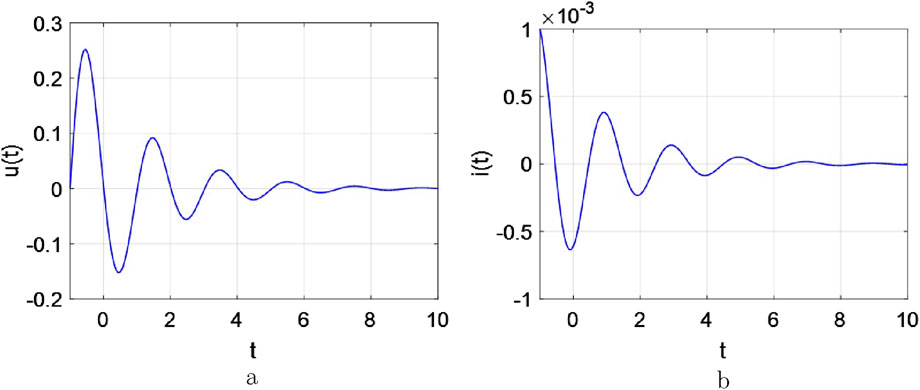
where the variables i(t)=iL(t), u(t)=uc(t) stand for the current flowing through the inductor and voltage across the capacitor. From the preceding analysis, when energy storage elements are integrated with memristors in a circuit, their response models can be established as transcendental and higher-order equations. In Figure 16a, let q=Ae(st) and i=Ase(st), where s and t critical variables that must be discussed and determined. Additionally, the necessary derivatives can be derived as

s3+RC+R0C+kRdqL+AkRdLests2+1LCs=0(9)

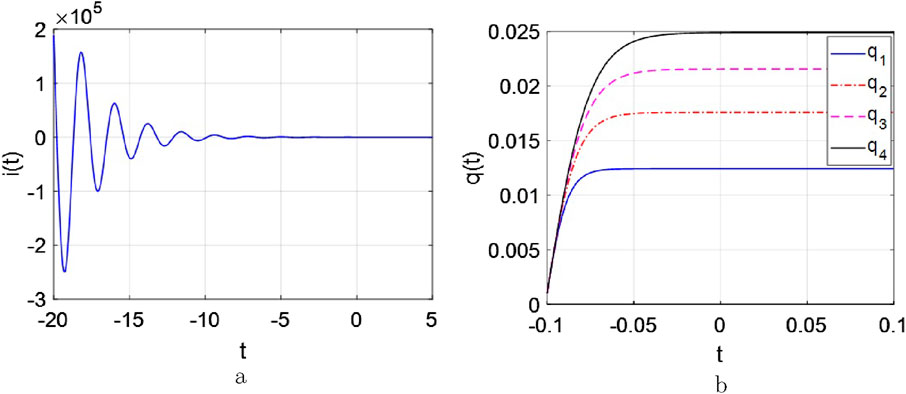
There is no doubt that Equation 9 is still a high-order transcendental equation. Thus, the natural response curve could be depicted graphically in Figure 17.

Figure 17
Two graphs display damped oscillations over time from zero to ten. Graph (a) shows the function \(u(t)\) peaking at approximately 0.25, while graph (b) depicts \(i(t)\) peaking at 0.001. Both graphs exhibit decreasing amplitude.

Figure 17. The response curves of the source-free RMLC series circuits, I0=0.001A, U0=0.001V, kRd=1106, R0=16k, R=1, L=0.1H, C=1mF. (a) u(t)t. (b) i(t)t.

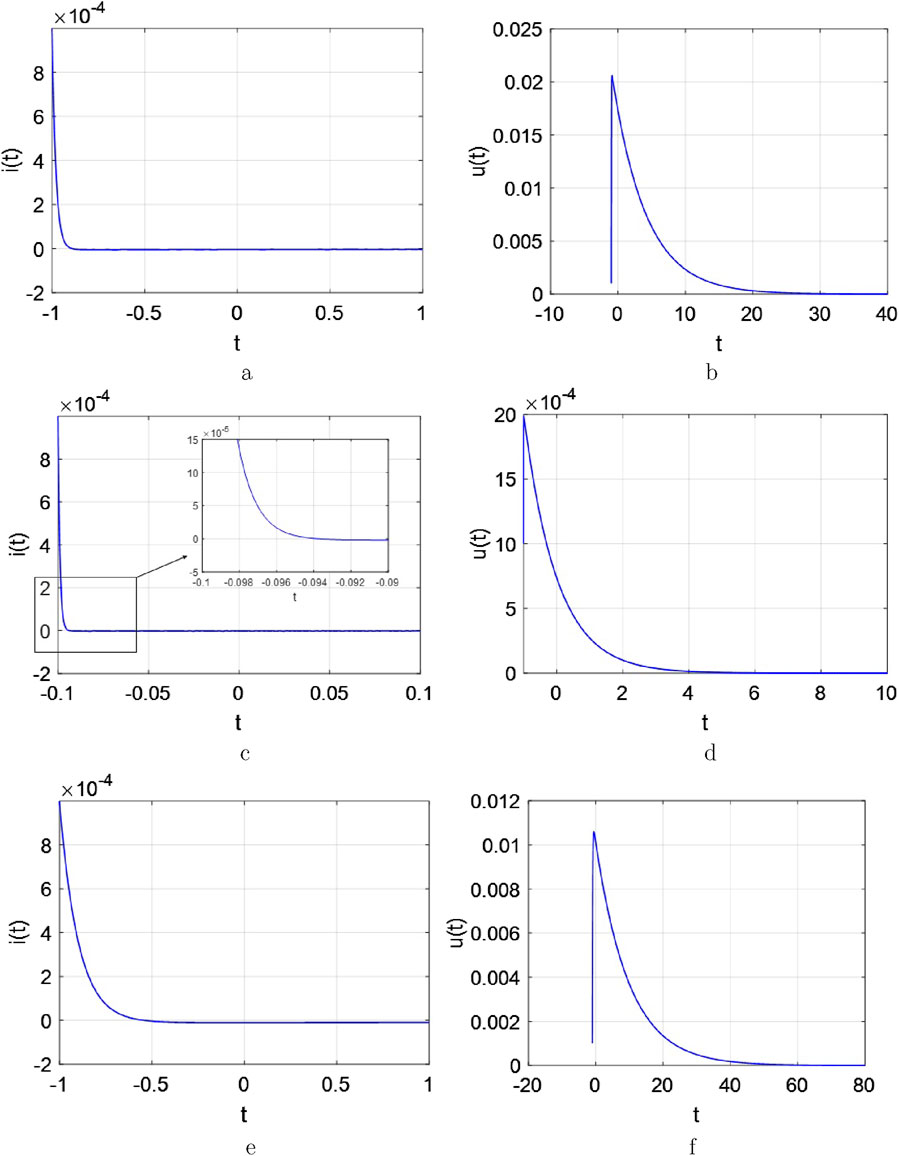
Comparison with a conventional RLC (second-order) series circuit, the solution of system (9) also could exhibit damping characteristics and generate the type of resonance phenomenon. By varying the values of RM, L or C, it discusses whether the system could observe the three damping conditions (overdamped, critically damped, and underdamped) analogous to traditional RLC circuits. These three cases might be illustrated and analyzed in the following Figures 1820, respectively.

Figure 18
Six graphs labeled a to f show plots of functions over time. Graph a shows \(i(t)\) decreasing quickly to near zero. Graph b shows \(u(t)\) peaking at the start then decaying. Graph c, similar to a, includes a zoomed-in section. Graph d shows a rapid initial peak of \(u(t)\) then a decrease. Graph e mirrors a with a wider time range. Graph f resembles b with an extended time scale.

Figure 18. The response of current and voltage curves for the RMLC series circuit. (a) i(t)t with R=5k, L=0.1H, and C=1mF. (b) u(t)t with R=5k, L=0.1H, and C=1mF. (c) i(t)t with R=1k, L=1mH, and C=1mF. (d) u(t)t with R=1k, L=1mH, and C=1mF. (e) i(t)t with R=1k, L=0.1H, and C=10mF. (f) u(t)t with R=1k, L=0.1H, and C=10mF.
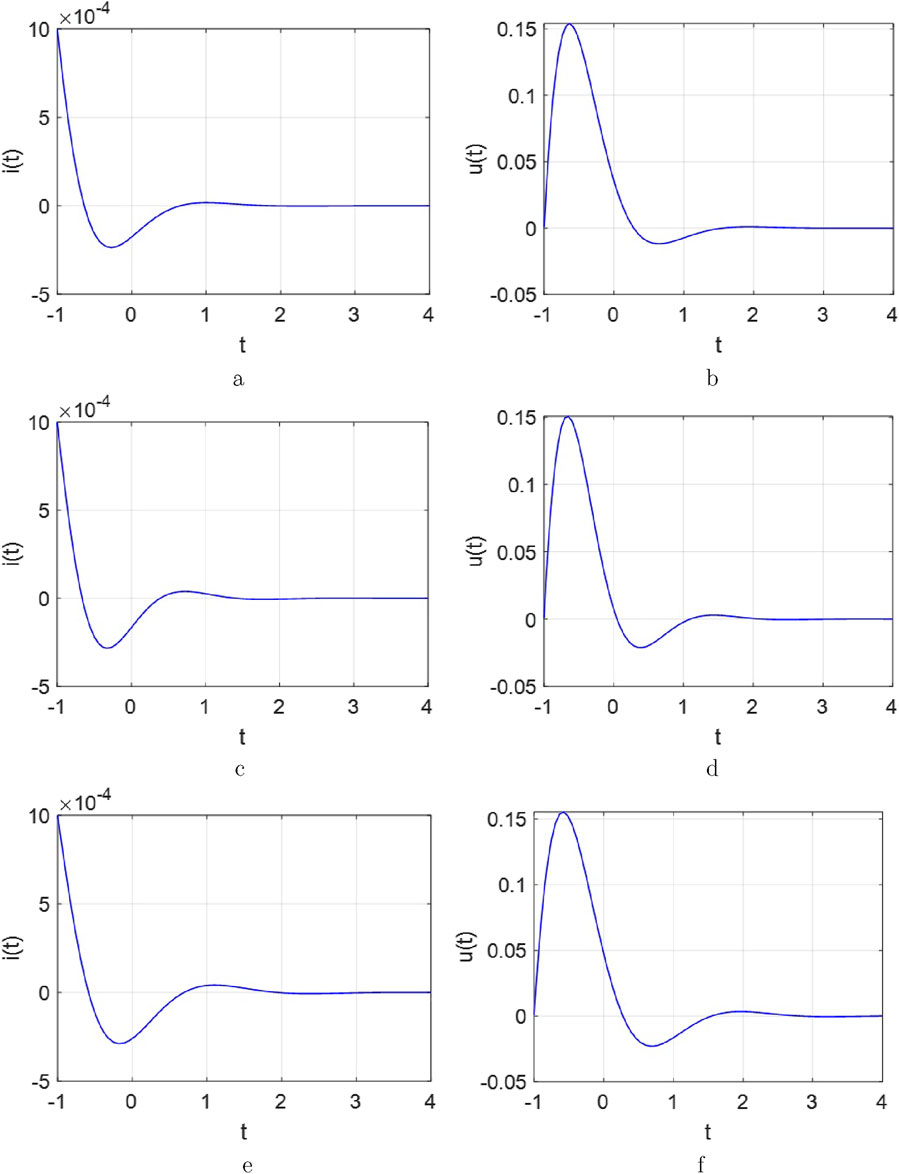
Figure 19
Six plots labeled a to f show graphs of functions against time (t). Plots a, c, and e display \( i(t) \) with values ranging from -5 to \( 10 \times 10^{-4} \). Plots b, d, and f show \( u(t) \) peaking at 0.15, with values from -0.05 to 0.15. Each graph depicts a curve with an initial peak followed by a decline and stabilization.

Figure 19. The response of current and voltage curves for the RMLC series circuit. (a) i(t)t with R=400, L=0.1H, and C=1mF. (b) u(t)t with R=400, L=0.1H, and C=1mF. (c) i(t)t with R=300, L=0.08H, and C=1mF. (d) u(t)t with R=300, L=0.08H, and C=1mF. (e) i(t)t with R=300, L=0.1H, and C=1.2mF. (f) u(t)t with R=300, L=0.1H, and C=1.2mF.
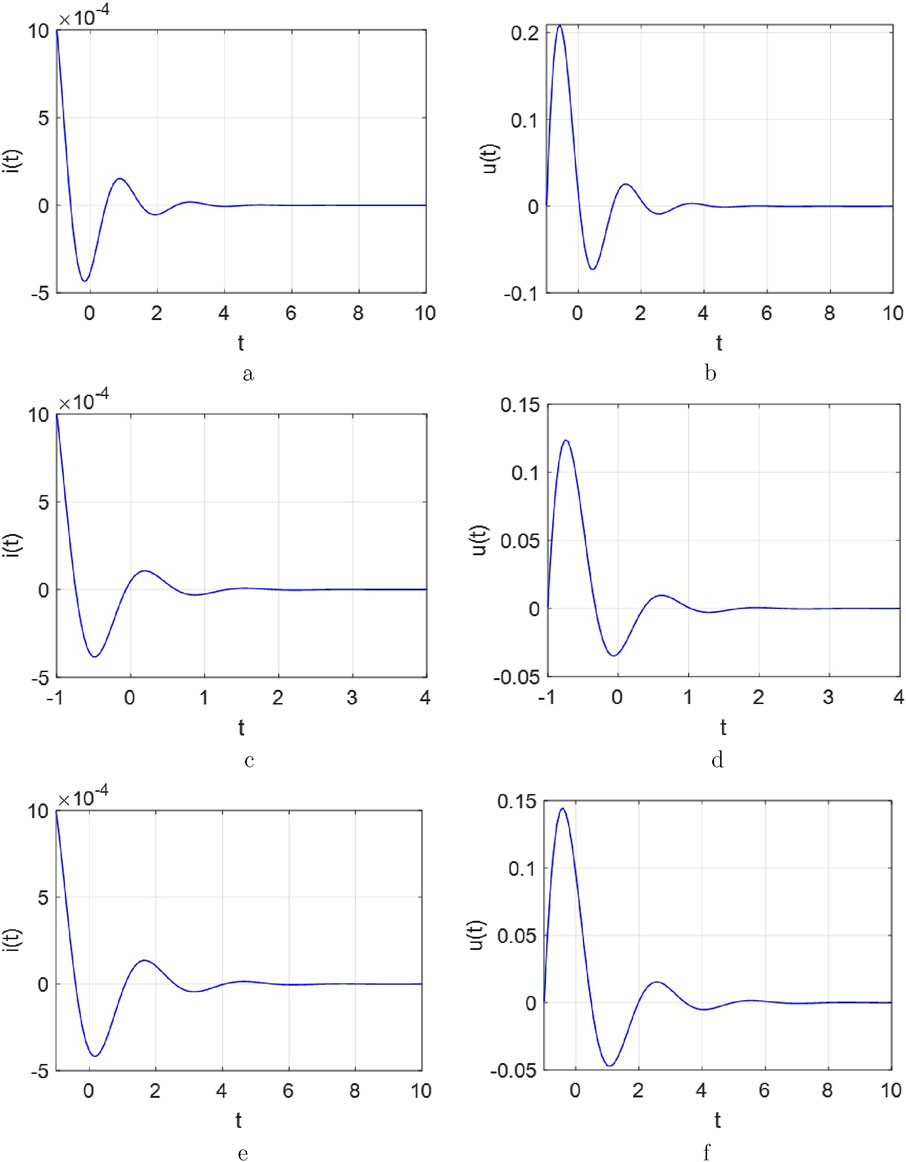
Figure 20
Six graphs displaying wave-like oscillations, labeled a to f, in pairs. Graphs a, c, and e plot \( i(t) \) against time \( t \), showing damped sine wave patterns from 0 to 10 on the x-axis. Graphs b, d, and f plot \( u(t) \) against time \( t \), with similar oscillatory behavior. Each pair of graphs shares a time range on the x-axis, spanning from various negative to positive values.

Figure 20. The response of current and voltage curves for the RMLC series circuit. (a) i(t)t with R=350, L=0.12H, and C=1mF. (b) u(t)t with R=35, L=0.12H, and C=1mF. (c) i(t)t with R=1k, L=1H, and C=1mF. (d) u(t)t with R=1k, L=1H, and C=1mF. (e) i(t)t with R=1k, L=0.12H, and C=120uF. (f) u(t)t with R=1k, L=0.12H, and C=120uF.

4.1.1 Overdamped case

When the following conditions are assigned, both response curves of i(t) and u(t) are shown in Figure 18. The decay approaches zero as t increases.

Observed from Figure 17 and Figure 18, the overdamping phenomenon occurs when the memristance increases (i.e., increasing R0+R), the inductance decreases, or the capacitance increases, while other parameters remain fixed.

4.1.2 Critically damped case

When the following conditions are set, both the current and voltage of the system exhibit maximum and minimum values in Figure 19, respectively. Also, the delays all the way to zero.

Between Figure 17 and Figure 19, the critically damped phenomenon presents immediately when the memristance increases (i.e., increasing R0+R) but remains much smaller than that in the overdamped case, the inductance decreases, or the capacitance increases, respectively, while other conditions remain fixed.

4.1.3 Underdamped case.

The oscillation period in both i(t) and u(t) curves are depicted in Figure 20. Moreover, the delays all the way to zero.

Compared with Figure 17 and Figure 20, the underdamped phenomenon has been shown as the same situation.

From Figures 1820, the special characteristics of the RMLC series circuit could be summarized as follows:

i. In HP-memristor is known as the linear drift model. When current flows through a designed circuit incorporating energy storage elements and a memristor, a higher-order mathematical model can be derived, which surpasses the complexity of conventional RLC series circuit models.

ii. Similar to the RLC series circuit, its behavior could be characterized by damping phenomena, where the gradual loss of initial stored energy results in a continuous reduction of response amplitude. This explains why such nonlinear circuits with memristors exhibit abundant oscillatory behaviors and strange attractors.

iii. The damping phenomenon arises because a memristor integrates two functional aspects: memory (R0) and energy dissipation (kRd). The oscillation period determines the damping rate of the response. To achieve overdamped, critically damped, or underdamped behavior, three discusses can be employed: increasing memristance (R+R0) but remains much smaller than that in the both overdamped and critically damped cases, or capacitance (C) or decreasing the inductance (L), while keeping other parameters fixed, respectively.

iv. The damped oscillation is possible due to the presence of the nonlinear elements (i.e., RM, L, and C). Furthermore, the delays all the way to zero, which stems from the ability of the storage elements and memory element to transfer energy back and forth between them.

v. All subplots uniformly validate that the same initial conditions but different component parameters would manifest a similar yet quite different output waveform. This variance could be thought as a kind of catalyst to get various application areas in the future, simultaneously revealing characteristics of chaotic oscillations. It further demonstrates the influence of (R+R0), L, and C on the decay rate. Therefore, during the design and application of memristive circuits, memristors with appropriate R0 could be chosen according to the needs of the actual oscillation and decay rate.

4.2 Parallel circuit

From Figure 16b, when the conditions (u=uR=uC=uL=uM) are satisfied for this parallel circuit, and according to the description of Equation 2, the following Equation 10 have been set as

dudt=1CuR+uR0+kRdq+ididt=uLdqdt=ii0=I0,u0=U0(10)

where the variables i(t)=iL(t), u(t)=uc(t) stand for the current flowing through the inductor and voltage across the capacitor. System (10) is also a third-order function. Let u=Ae(st) where s and t critical variables. Additionally, the necessary derivatives can be derived as

R0Cs2+1+R0Rs+R0L+kRdCs2+kRdRs+kRdLAest=0(11)

Equation 11 is still a transcendental equation. Its solution could be obtained through approximately methods. Now, the nature response curve could be drawn in Figure 21.

Figure 21
Two graphs displaying functions over time. Graph (a) shows a plot of \(i(t)\) ranging from negative twenty to five on the time axis, illustrating oscillations stabilizing around zero. Graph (b) depicts multiple plots of \(q(t)\) against a narrow range from negative 0.1 to 0.1, with four distinct lines converging to different values, as indicated by a legend for \(q1\), \(q2\), \(q3\), and \(q4\).

Figure 21. The response curves of the source-free RMLC parallel circuits, I0=1A, U0=10V, kRd=1106, R0=16k, R=1k, L=0.12H, C=1mF. (a) i(t)t. (b) u(t)t.

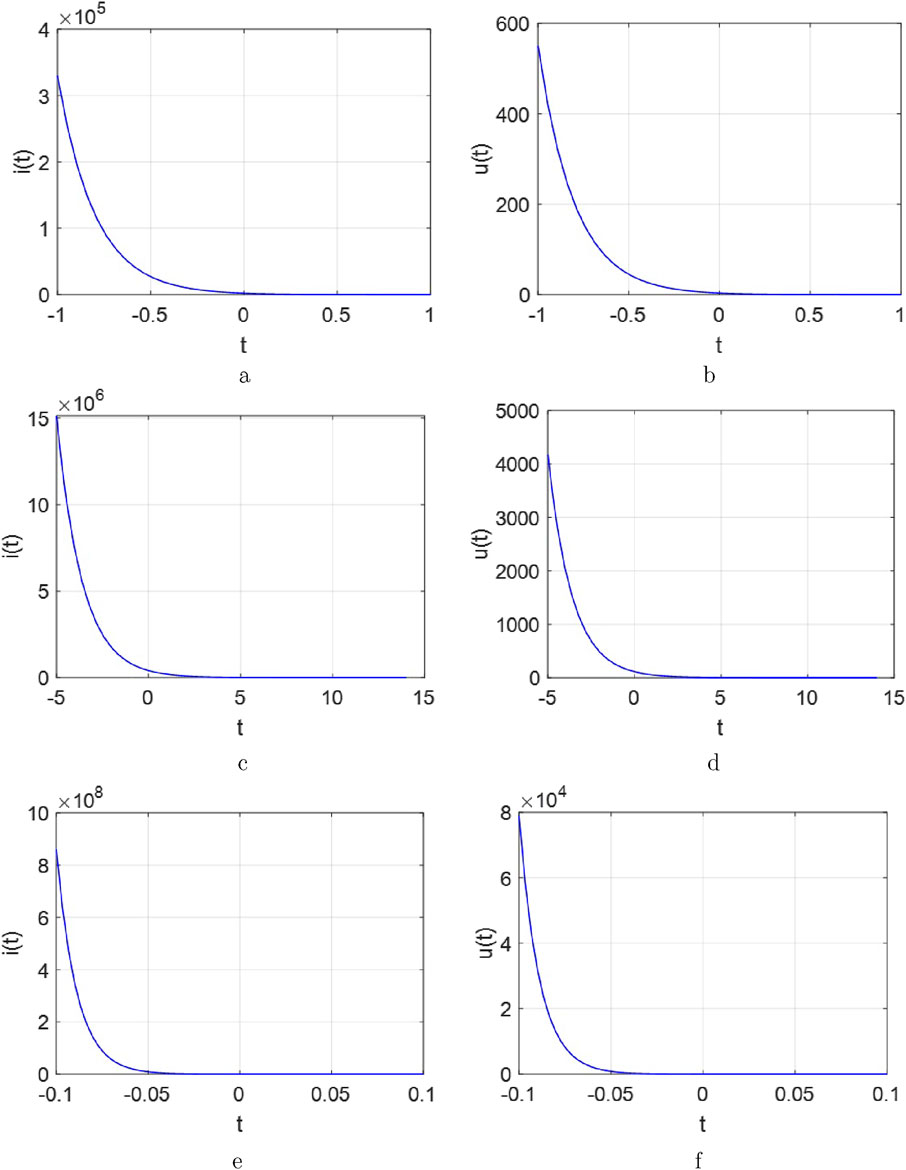
Next, we investigate the impact of varying parameters (RM, L or C) and observe whether analogous responses emerge. The current and voltage response curve are presented in Figures 2224. There are also three cases:

Figure 22
Six graphs labeled (a) to (f), show decreasing exponential curves over time (t). Graphs (a), (c), and (e) depict i(t) with different scales, while (b), (d), and (f) depict u(t), also with varying scales. Each graph displays a rapid decline followed by a plateau, demonstrating a decay pattern across different domains.

Figure 22. The response curves for the RMLC parallel circuit. (a) i(t)t with R=150Ω, L=0.12H, and C=1mF. (b) u(t)t with R=15Ω, L=0.12H, and C=1mF. (c) i(t)t with R=1k, L=50H, and C=1mF. (d) u(t)t with R=1k, L=50H, and C=1mF. (e) i(t)t with R=1k, L=0.12H, and C=10uF. (f) u(t)t with R=1k, L=0.12H, and C=10uF.
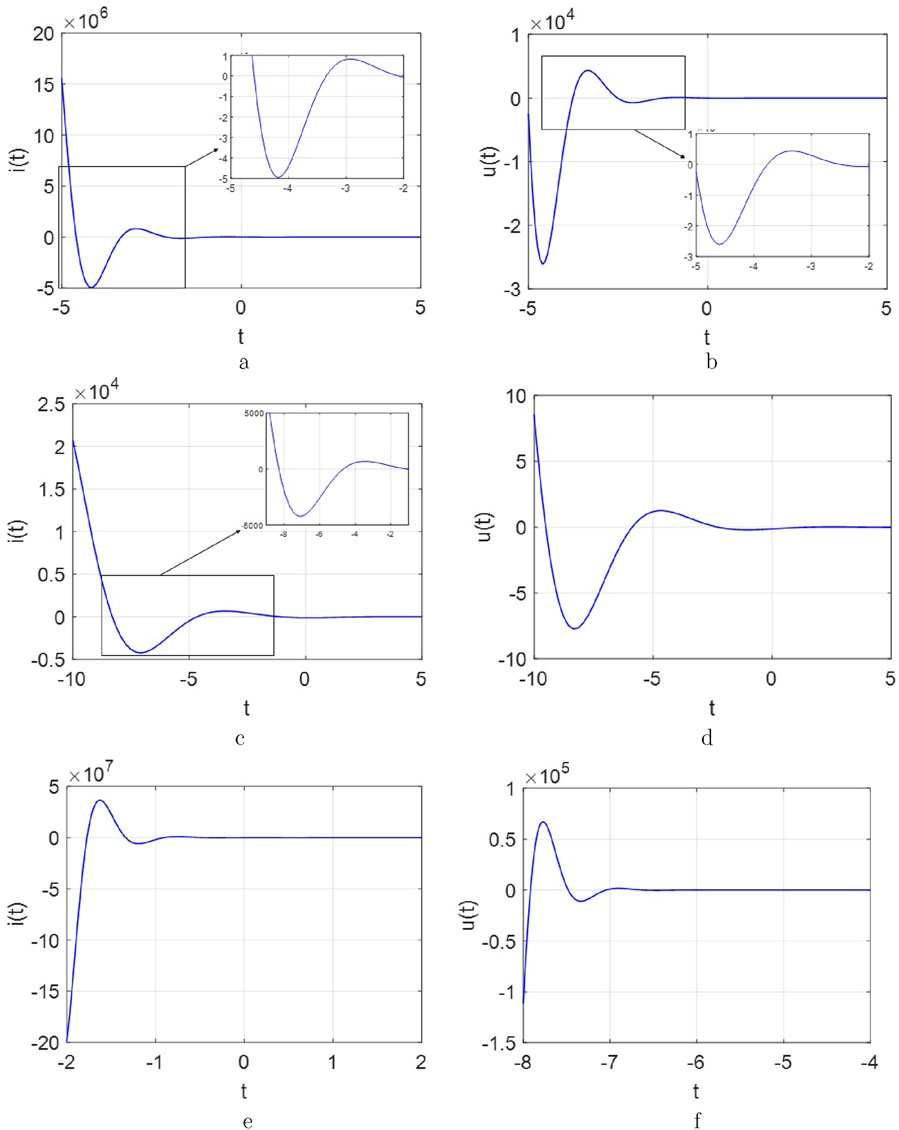
Figure 23
Series of six graphs labeled a to f. Graphs a, c, and e plot i(t) over time t, and graphs b, d, and f plot u(t). Each graph shows oscillations with varying scales and points of focus, indicated by inset diagrams. Graph a has a range of negative five to positive five on the x-axis with a highlighted inset. Graphs c and d have a wider time range from negative ten to five. Graphs e and f focus on narrower ranges showing sharp peaks and stabilization over time. Each graph is in blue and is displayed with a linear time axis.

Figure 23. The response curves for the RMLC parallel circuit. (a) i(t)t with R=350, L=0.12H, and C=1mF. (b) u(t)t with R=350, L=0.12H, and C=1mF. (c) i(t)t with R=1k, L=1H, and C=1mF. (d) u(t)t with R=1k, L=1H, and C=1mF. (e) i(t)t with R=1k, L=0.12H, and C=120uF. (f) u(t)t with R=1k, L=0.12H, and C=120uF.
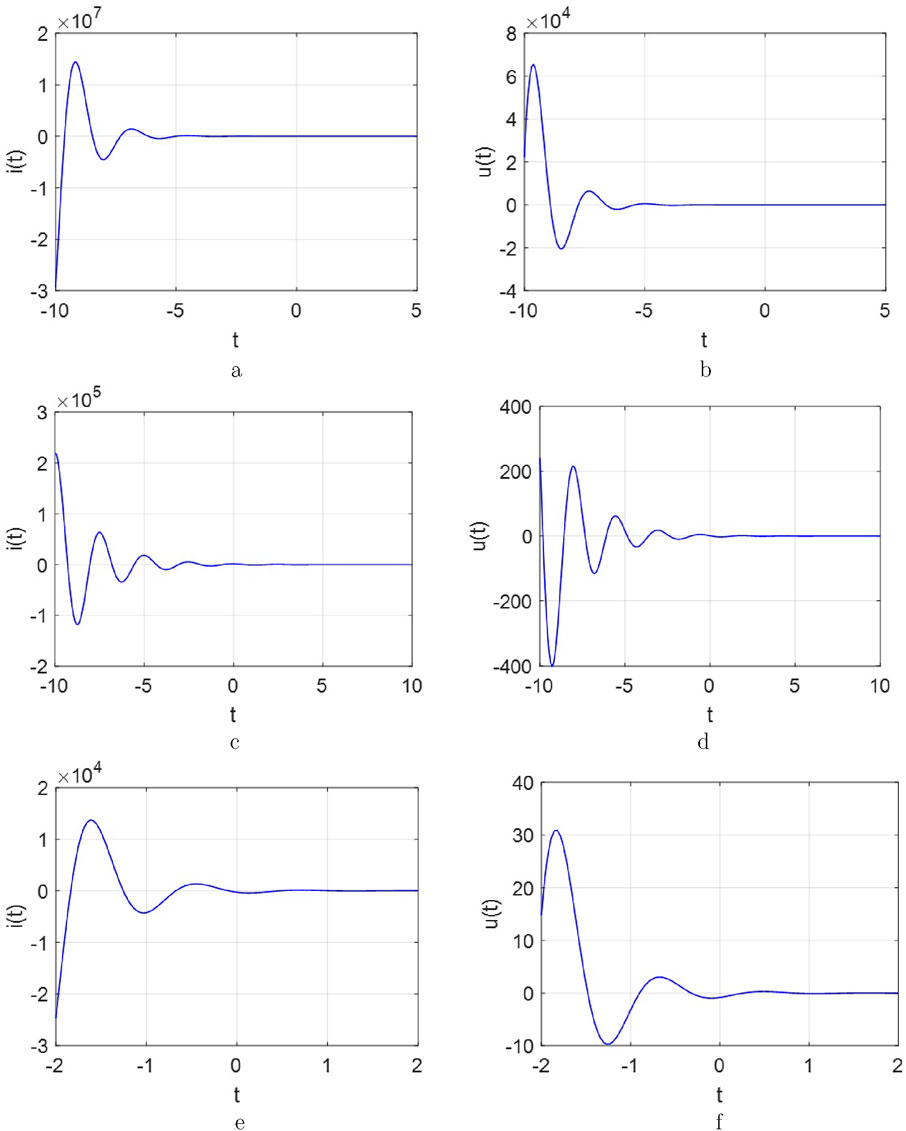
Figure 24
Six plots are displayed in a grid, labeled a to f. Plots a, c, and e on the left show \(i(t)\) against \(t\), with oscillations decaying to stability. Plots b, d, and f on the right show \(u(t)\) against \(t\), also displaying oscillatory decays. The scales and ranges differ for each plot, capturing varying frequencies and amplitudes of the signals, with time axes varying from -10 to 5 or -2 to 2.

Figure 24. The response curves for the RMLC parallel circuit. (a) i(t)t with R=500, L=0.12H, and C=1mF. (b) u(t)t with R=500, L=0.12H, and C=1mF. (c) i(t)t with R=1k, L=0.55H, and C=1mF. (d) u(t)t with R=1k, L=0.55H, and C=1mF. (e) i(t)t with R=1k, L=0.12H, and C=250uF. (f) u(t)t with R=1k, L=0.12H, and C=250uF.

4.2.1 Overdamped case.

When the following conditions are assigned, both response curves of i(t) and u(t) are shown in Figure 22.

Between Figure 21 and Figure 22, the overdamping phenomenon occurs when the memristance decreases (i.e., decreasing R0+R), the inductance increases, or the capacitance decreases, while other parameters remain fixed.

4.2.2 Critically damped case.

When the following conditions are given, both the current and voltage exhibit maximum and minimum values, respectively (see Figure 23). Also, the delays all the way to zero.

Observed from Figure 21 and Figure 23, the critically damped phenomenon have happened when the memristance decreases (i.e., decreasing R0+R) but remains much larger than that in the overdamped case, the inductance increases, or the capacitance decreases, while other conditions remain fixed.

4.2.3 Underdamped case.

The oscillation period in both i(t) and u(t) curves are depicted in Figure 24. Moreover, the delays all the way to zero. Compared with Figure 21 and Figure 24, the underdamped phenomenon has been shown under the same conditions.

To summarize the conclusions according to the Figures 2224 for one RMLC parallel circuit as follows:

i. Similar to the RLC parallel circuit, when energy storage elements and a memristor are integrated into the same parallel system, the energy would be back and forth between them, thereby establishing a damping decay curve.

ii. The coexistence of memory storage and energy dissipation characteristics in this circuit arises from the dual-resistance structure of the memristor, characterized by R0 and kRd.

iii. The conditions for achieving overdamped, critically damped, or underdamped phenomena differ from those in RMLC series circuits. Specifically, these damping regimes can be realized by adjusting the resistance (R+R0) but remains much larger than that in the both overdamped and critically damped cases or capacitance (C) should be decreasing or increasing the inductance (L), while keeping all other parameters constant under each configuration.

iv. Under identical initial current and voltage conditions but with varying circuit component values, all subplots in the figure were analyzed. These results validate the influence of (R+R0), L and C on the decay rate. The single regrettable drawback resides in the waveforms lacking sufficient resolution to reveal detailed distinctions between the RMLC circuit and conventional variable RLC systems. However, in the design and application of one memristive circuit, memristors should be selected according to the needs of the actual oscillation and decay rate based on the analysis and discussion in thoery.

5 Application of classic circuits with four fundamental components

A classical four-component application circuit is presented, as shown in Figure 25.

Figure 25
Two electrical circuit diagrams labeled a and b. Diagram a shows a series circuit with an inductor (L) in parallel to a capacitor (C2) connected to a resistance (R) in series with another capacitor (C1) parallel to a load (R_M). Diagram b is similar but shows R_M parallel to the inductor, with a directional arrow labeled “i” indicating current flow.

Figure 25. A circuit with HP-memristor. (a) Replacing the Chua diode with an HP memristor. (b) Transposing the positions of HP memristor and resistor.

The following analysis would demonstrate how energy storage elements or memristors influence the memory characteristics and oscillatory behavior. The Figure 25a, this circuit shares the same topological structure as the Chua system, but features a different memristor configuration. Consequently, it also produces different phase trajectory curves, the mathematical model has been built and analyzedin the following form:

C1dV1dt=1RV1+1RV21RMV1C2dV2dt=1RV11RV2+iLLdiLdt=V2dqdt=iL(12)

Secondly, when transposing the positions of the HP memristor and resistor in this circuits, the mathematical model is given as follows:

C1dV1dt=1RMV1+1RMV21RV1C2dV2dt=1RMV11RMV2+iLLdiLdt=V2dφdt=dφdqdqdt=V1V2(13)

Setting the variable x=V1, y=V2, z=iL and ω=q; parameters p1=1/(RC1), q1=1/(RC2), a2=1/(RC1), b=1/C2, r=1/L, a1=p2=1/[(R0+kRdq)C1], q2=1/[(R0+kRdq)C2], both the built as Equation 12 and Equation 13 can be rewritten in the following dimensionless forms:

ẋ=p1yxa1.xẏ=q1xy+b.zż=r.yω̇=z(14)

and

ẋ=p2yxa2.xẏ=q2xy+b.zż=r.yω̇=xy(15)

For Figure 25a, setting the parameters p1=7.9, q1=1, b=1, r=14.5 are fixed in Equation 14. The phase trajectory curves exhibit the chaotic attractor as shown in Figure 26a. When transposing the positions of the HP memristor and resistor, the phase trajectory becomes a single-scroll attractor as demonstrated in Figure 26b.
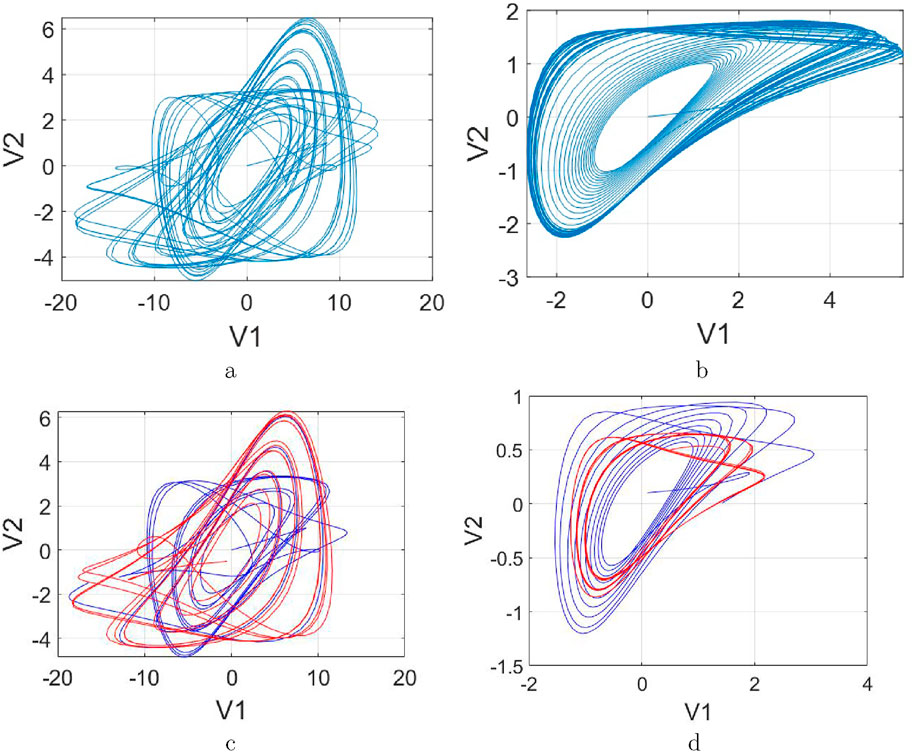
Figure 26
Four subplots labeled a, b, c, and d depict different chaotic attractors on V1-V2 axes. Subplot a shows a blue chaotic pattern extending horizontally. Subplot b displays a blue, more compact pattern. Subplot c shows overlapping red and blue patterns, similar to a but with more variation. Subplot d presents overlapping red and blue patterns in a compact, rounded shape.

Figure 26. Phase portrait in v1v2 and their coexistence attractors. (a) replacing Chua Diodes with HP Memristors. (b) replace the resistance (R) in original Chua’s circuit with an HP memristor. (c) Coexistence attractor. (d) Hidden attractor.

These observations demonstrate that as initial values vary, the system not only exhibits irregular oscillations but also manifests chaotic attractors, coexisting attractors in Figure 26c and hidden attractors in Figure 26d. These characteristics serve as critical evidence for the system’s capability to facilitate the construction of complex neural networks with memory properties.

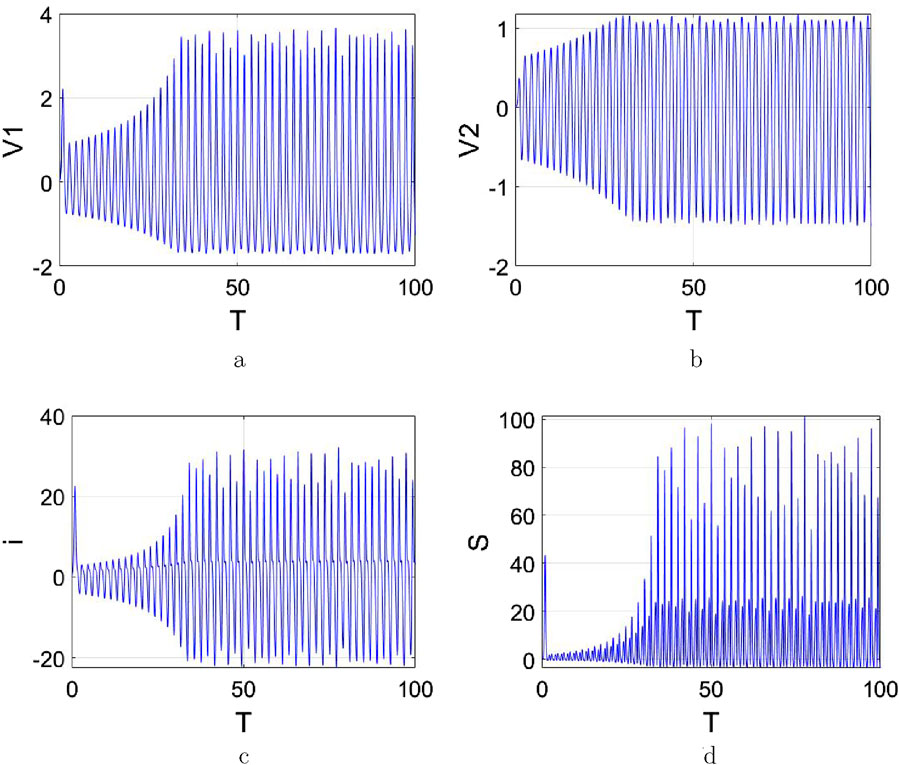
Let p2=1/(6.230.9q), q2=1/(8.494.33q), a2=7.9, b=1, r=14.5, and the initial condition [x,y,z,w]=[0.01,0.01,0.01,0.01], the time domain curves of Equation 15 can be obtained as shown, seeing Figure 27.

Figure 27
Four graphs showing oscillatory data as follows: (a) V1 vs. T, with amplitude increasing over time from -2 to 4; (b) V2 vs. T, similar pattern from -2 to 1; (c) I vs. T, increasing amplitude from -20 to 40; (d) S vs. T, increasing from 0 to 100. Each graph displays an increasing frequency pattern over time.

Figure 27. Time domain curves. (a) v1(t)t. (b) v2(t)t. (c) i(t)t. (d) S(t)t.

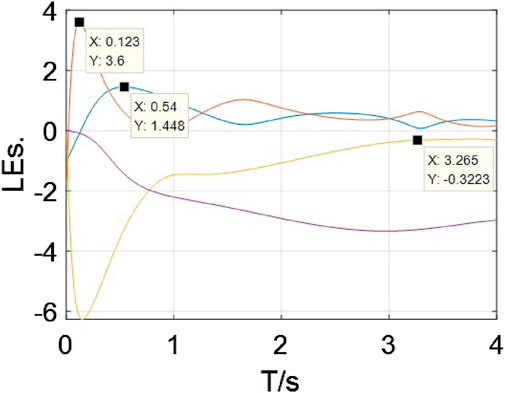
Then, the Lyapunov exponent spectrum corresponding to parametrically configured is illustrated in Figure 28.

Figure 28
Line graph showing four curves representing data over time from zero to four seconds (T/s) on the x-axis and LES on the y-axis. Notable data points are marked with black squares at coordinates (0.123, 3.6), (0.54, 1.448), and (3.265, -0.3223), with corresponding labels. Curves intersect and display varying peaks and troughs.

Figure 28. The Lyapunov Exponents spectrum.

This provides another perspective to demonstrate that the chaotic oscillation arises from the energy to transfer energy back and forth between the memristor and energy storage elements. From Figure 28, the LEs are calculated and illustrated, LE1=3.6, LE2=1.448, LE3=0.3223, LE4=3.339. Two positive Lyapunov exponents confirm that the system is a hyperchaotic system. Next, in order to verify the conclusions derived from previous analyses, we systematically modify the values of energy storage elements of Figure 25b to investigate their impact on the memory characteristics and oscillatory behaviors of the HP-memristor from the response of voltage curves.

Observed from Figures 29a–c, they illustrate the effect of varying the inductance L on output voltage (v2) of the system (15). As inductance L increases, the decay rate diminishes. Conversely, reduction of L induces damped and overdamped dynamical manifestations. When inductance values decrease below critical thresholds, oscillatory phenomena and chaotic attractors undergo complete termination.
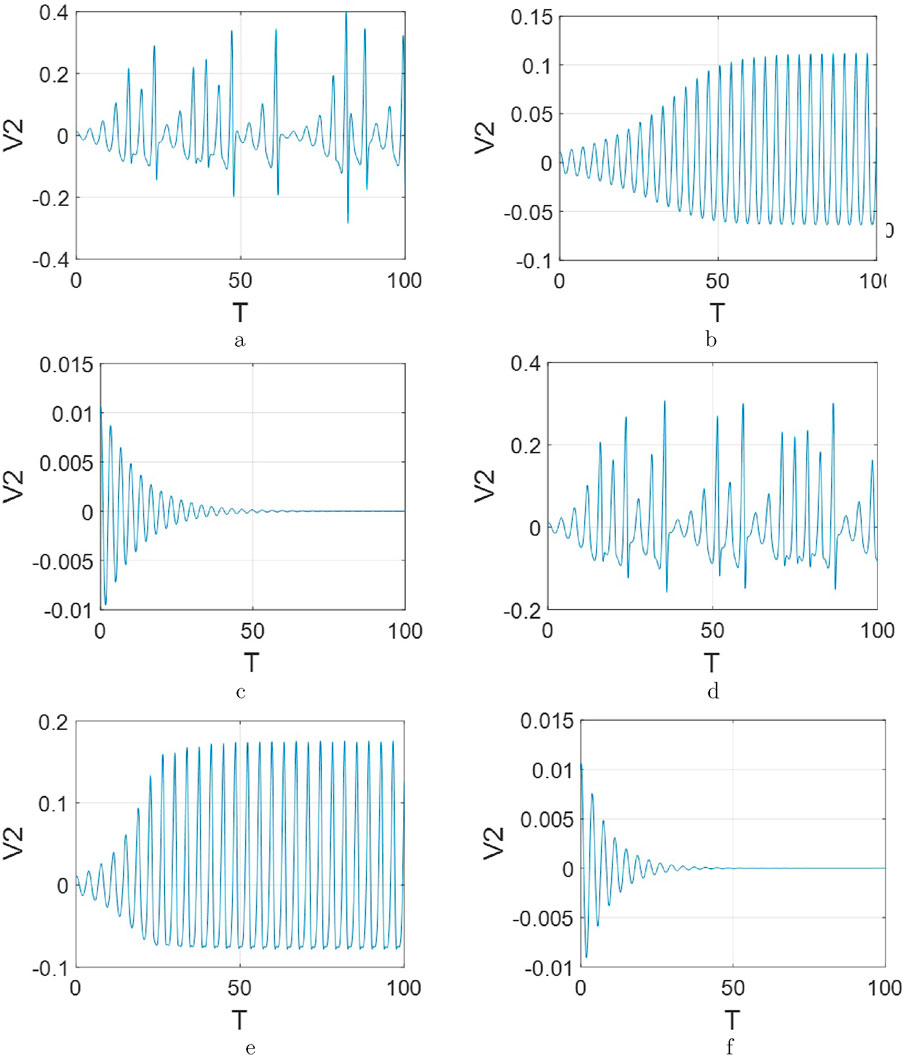
Figure 29
Six graphs labeled a to f depict waveforms over a time period of zero to one hundred units. Each graph shows varying oscillation patterns for V2 against T. Graph a features sporadic spikes, b and e display increasing amplitude oscillations, c and f show damping oscillations, while d has frequent spikes similar to a. Each graph represents different waveform characteristics.

Figure 29. The response of voltage curves (v2) of system (13). (a) a2=7.9, b=1, p2=1/(0.96.23q), q2=1/(8.494.33q), r=14.1. (b) a2=7.9, b=1, p2=1/(6.230.9q), q2=1/(8.494.33q), r=16. (c) a2=7.9, b=1, p2=1/(6.230.9q), q2=1/(8.494.33q), r=18. (d) a2=7.9, b=1, p2=1/(6.230.9q), q2=1/(8.04.11q), r=14.5. (e) a2=7.9, b=1, p2=1/(6.230.9q), q2=1/(8.924.33q), r=14.5. (f) a2=7.9, b=1, p2=1/(6.230.9q), q2=1/(9.24.92q), r=14.5.

Similarly, Figures 29d–f demonstrates the impact of changing the capacitance C2 on the output voltage (v2). As capacitance C2 increases, the decay rate also diminishes. Conversely, reduction of C2 induces damped and overdamped dynamical manifestations. When capacitance values decrease below critical thresholds, oscillatory phenomena and chaotic attractors undergo complete termination.

6 Conclusion

To advance the fundamental theory of memristive circuits, this study investigates four types of source-free circuits incorporating memristors and energy storage elements following the research methodology of classical source-free circuit analysis.

These circuits are categorized into two groups: one group consists of a memristor combined with a single energy-storing element (denoted as RMC and RML circuits), while the other group includes RMLC series and parallel circuits. Firstly, their models are built and analyzed, which reveals that they are transcendental equations. Secondly, new time constants are introduced (It pertains exclusively to a specific resistance region in the memristor, such as its low-resistance state R0, that is, τ0=R0C and τ0=L/R0), along with key factors influencing the decay rate. Furthermore, this study further verifies that two distinct regions in the memristor manifest two properties: memory characteristics and energy-dissipative behavior. Finally, through a systematic analysis using a classical application circuit with four fundamental circuit elements, we revalidate the critical role of both energy storage components and memristor in modulating oscillatory dynamics and attractor morphologies. More significantly, the characteristics of circuits combining memristors and energy-storage components have been refined, ensuring continuous advancement in memristive circuit principles. This establishes a robust theoretical foundation for innovative applications of memory elements across nonlinear circuits, avionics for UAV systems, and integrated theoretical-design frameworks.

Data availability statement

The original contributions presented in the study are included in the article/supplementary material, further inquiries can be directed to the corresponding authors.

Author contributions

XG: Writing – original draft, Writing – review and editing, Supervision. YQ: Formal Analysis, Investigation, Writing – review and editing. SL: Data curation, Methodology, Writing – review and editing. WL: Conceptualization, Data curation, Formal Analysis, Writing – review and editing. YS: Investigation, Supervision, Writing – review and editing. YL: Writing – review and editing, Writing – original draft.

Funding

The author(s) declare that no financial support was received for the research and/or publication of this article.

Conflict of interest

Authors XG, YQ, SL, and WL were employed by Aerospace Times FeiHong Technology Company Limited.

The remaining authors declare that the research was conducted in the absence of any commercial or financial relationships that could be construed as a potential conflict of interest.

Generative AI statement

The author(s) declare that no Generative AI was used in the creation of this manuscript.

Any alternative text (alt text) provided alongside figures in this article has been generated by Frontiers with the support of artificial intelligence and reasonable efforts have been made to ensure accuracy, including review by the authors wherever possible. If you identify any issues, please contact us.

Publisher’s note

All claims expressed in this article are solely those of the authors and do not necessarily represent those of their affiliated organizations, or those of the publisher, the editors and the reviewers. Any product that may be evaluated in this article, or claim that may be made by its manufacturer, is not guaranteed or endorsed by the publisher.

References

1. Chua LO. If it’s pinched it’s a memristor. Semiconductor Sci Technology (2014) 49(10):104001. doi:10.1088/0268-1242/29/10/104001

CrossRef Full Text | Google Scholar

2. Caravelli F, Carbajal JP. Memristors for the curious outsiders. Technologies (2018) 6(4):118. doi:10.3390/technologies6040118

CrossRef Full Text | Google Scholar

3. Zhang Y, Wang X, Li Y, Friedman EG. Memristive model for synaptic circuits. IEEE Trans Circ Syst.–II: Express Briefs (2017) 64(7):767–71. doi:10.1109/TCSII.2016.2605069

CrossRef Full Text | Google Scholar

4. Bao H, Zhang Y, Liu W, Bao B. Memristor synapse-coupled memristive neuron network: synchronization transition and occurrence of chimera. Nonlinear Dyn (2020) 100:937–50. doi:10.1007/s11071-020-05529-2

CrossRef Full Text | Google Scholar

5. Tan Y, Wang C. A simple locally active memristor and its application in HR neurons. Chaos (2020) 30(5):053118. doi:10.1063/1.5143071

PubMed Abstract | CrossRef Full Text | Google Scholar

6. Huang L, Wang S, Lei T, Li C. Coupled HR–HNN neuron with a locally active memristor. Int J Bifurcation Chaos (2024) 34(2):2450022. doi:10.1142/S0218127424500226

CrossRef Full Text | Google Scholar

7. Shama F, Haghiri S, Imani MA. FPGA realization of Hodgkin-Huxley neuronal model. IEEE Trans Neural Syst Rehabil Eng (2020) 28(5):1059–68. doi:10.1109/TNSRE.2020.2980475

PubMed Abstract | CrossRef Full Text | Google Scholar

8. Yu F, Shen H, Yu Q, Kong X, Sharma PK, Cai S. Privacy protection of medical data based on multi-scroll memristive Hopfield neural network. IEEE Trans Netw Sci Eng (2022) 10:845–58. doi:10.1109/TNSE.2022.3223930

CrossRef Full Text | Google Scholar

9. Eshraghian JK, Cho K, Zheng C, Nan M, Iu HH, Lei W, et al. Neuromorphic vision hybrid rram-cmos architecture. IEEE Trans Very Large-Scale Integration (VLSI) Syst (2018) 26(12):2816–29. doi:10.1109/TVLSI.2018.2829918

CrossRef Full Text | Google Scholar

10. Yu F, Zhang S, Su D, Wu Y, Gracia YM, Yin H. Dynamic analysis and implementation of FPGA for a new 4D fractional-order memristive hopfield neural network. Fractal and Fractional (2025) 9(2):115. doi:10.3390/fractalfract9020115

CrossRef Full Text | Google Scholar

11. Liu Y, Iu HH, Qian Y. Implementation of Hodgkin-Huxley neuron model with the novel memristive oscillator. IEEE Trans Circ Syst.–II: Express Briefs (2021) 68(8):2982–6. doi:10.1109/TCSII.2021.3066471

CrossRef Full Text | Google Scholar

12. Song Z, Liu Y. Generation of neuromorphic oscillators via second-order memristive circuits with modified Chua corsage memristor. IEEE Access (2023) 11:103712–24. doi:10.1109/ACCESS.2023.3318117

CrossRef Full Text | Google Scholar

13. Yu D, Zhao X, Sun T, Iu HHC, Fernando T. A simple floating mutator for emulating memristor, memcapacitor, and meminductor. IEEE Trans Circ Syst.–II: Express Briefs (2020) 67(7):1334–8. doi:10.1109/TCSII.2019.2936453

CrossRef Full Text | Google Scholar

14. Feali MS, Ahmadi A, Hayati M. Implementation of adaptive neuron based on memristor and memcapacitor emulators. Neurocomputing (2018) 309(2):157–67. doi:10.1016/j.neucom.2018.05.006

CrossRef Full Text | Google Scholar

15. Liu Y, Iu HH, Guo Z, Si G. The simple charge-controlled grounded/floating mem-element emulator. IEEE Trans Circ Syst.–II: Express Briefs (2021) 68(6):2177–81. doi:10.1109/TCSII.2020.3041862

CrossRef Full Text | Google Scholar

16. Yu F, Su D, He S. Resonant tunneling diode cellular neural network with memristor coupling and its application in police forensic digital image protection. Chin Phys B (2021) 34(5):050502. doi:10.1088/1674-1056/adb8bb

CrossRef Full Text | Google Scholar

17. Chai Q, Liu Y. MARR-GAN attention recurrent residual generative Adversarial Network with memristor for Raindrop Removal. Micromachiness (2024) 15(2):15020217. doi:10.3390/mi15020217

CrossRef Full Text | Google Scholar

18. Liu Y, Guo Z, Chau TK, Iu HHC, Si G. Nonlinear circuits with parallel-/series-connected HP-type memory elements and their characteristic analysis. Int J Circ Theor Appl (2021) 49(2):513–32. doi:10.1002/cta.2915

CrossRef Full Text | Google Scholar

19. Corinto F, Ascoli A. Memristive diode bridge with LCR filter. Electronics Lett (2012) 48(14):824–5. doi:10.1049/el.2012.1480

CrossRef Full Text | Google Scholar

20. Ntinas V, Vourkas I, Sirakoulis GC. LC filters with enhanced memristive damping. In: 2015 IEEE international symposium on circuits and systems (ISCAS) (2015). p. 2664–7. doi:10.1109/ISCAS.2015.7169234

CrossRef Full Text | Google Scholar

21. Torebayev G, Nandakumar A. Implementation of memristor in Bessel filter with RLC components. Int Conf Comput Netw Commun (Coconet) (2018) 190–4. doi:10.1109/CoCoNet.2018.8476913

CrossRef Full Text | Google Scholar

22. Sadecki J, Marszalek W. Analysis of a memristive diode bridge rectifier. Electronics Lett (2019) 55(3):120–2. doi:10.1049/el.2018.6921

CrossRef Full Text | Google Scholar

23. Li C, Zhou Y, Yang Y, Li H, Feng W, Li Z, et al. Complicated dynamics in a memristor-based RLC circuit. Eur Phys J Spec Top (2019) 228:1925–41. doi:10.1140/epjst/e2019-800195-8

CrossRef Full Text | Google Scholar

24. Liu Y, Wang K, Qian Y, Liu X, Wang S. Neuromorphic oscillators and electronic implementation of one novel MFNN model. IEEE Access (2023) 11:16076–84. doi:10.1109/ACCESS.2022.3233771

CrossRef Full Text | Google Scholar

25. Dautovic S, Samardzic N, Juhas A, Ascoli A, Tetzlaff R. Analytical solutions for charge and flux in HP ideal generic memristor model with Joglekar and Prodromakis window functions. IEEE Access (2024) 12:94870–84. doi:10.1109/ACCESS.2024.3424568

CrossRef Full Text | Google Scholar

26. So-Yeon K, Heyi Z, Rivera-Sierra G, Fenollosa R, Rubio-Magnieto J, Bisquert J. Introduction to neuromorphic functions of memristors: the inductive nature of synapse potentiation. J Appl Phys (2025) 137:111101. doi:10.1063/5.0257462

CrossRef Full Text | Google Scholar

27. Liu Y, Liu F, Luo W, Wu A, Li H. AC power analysis for second-order memory elements. Front Phys (2023) 11:1135739. doi:10.3389/fphy.2023.1135739

CrossRef Full Text | Google Scholar

28. Yu F, He S, Yao W, Cai S, Xu Q. Bursting firings in memristive hopffeld neural network with image encryption and hardware implementation. IEEE Trans Computer-Aided Des Integrated Circuits Syst (2025) 161–73. doi:10.1109/TCAD.2025.3567878

CrossRef Full Text | Google Scholar

29. Liu Y, Li H, Guo S, Iu HH. Generation of multi-lobe chua corsage memristor and its neural oscillation. Micromachines (2022) 13(8):1330–43. doi:10.3390/mi13081330

PubMed Abstract | CrossRef Full Text | Google Scholar

30. Liu Y, Iu HH. Novel floating and grounded memory interface circuits for constructing mem-elements and their applications. IEEE Access (2020) 8:114761–72. doi:10.1109/ACCESS.2020.3004160

CrossRef Full Text | Google Scholar

31. Liu Y, Iu HH, Guo S, Li H. Chaotic dynamics in memristive circuits with different -q characteristics. Jul 2021 Int J Circ Theor Appl (2022) 49(11):3540–58. doi:10.1002/cta.3112

CrossRef Full Text | Google Scholar

Keywords: memristor, R M C circuits, R M L circuits, Kirchhoff’s circuit laws, energy exchange

Citation: Gao X, Qian Y, Li S, Li W, Su Y and Liu Y (2025) Analysis and application for the source-free RMLC circuits. Front. Phys. 13:1640293. doi: 10.3389/fphy.2025.1640293

Received: 03 June 2025; Accepted: 11 August 2025;
Published: 10 September 2025.

Edited by:

Viet-Thanh Pham, Industrial University of Ho Chi Minh City, Vietnam

Reviewed by:

Yujiao Dong, Hangzhou Dianzi University, China
Fang Yao, The University of Western Australia, Australia

Copyright © 2025 Gao, Qian, Li, Li, Su and Liu. This is an open-access article distributed under the terms of the Creative Commons Attribution License (CC BY). The use, distribution or reproduction in other forums is permitted, provided the original author(s) and the copyright owner(s) are credited and that the original publication in this journal is cited, in accordance with accepted academic practice. No use, distribution or reproduction is permitted which does not comply with these terms.

*Correspondence: Yue Liu, bGl1eXVlMDQyM0BjY3V0LmVkdS5jbg==

Disclaimer: All claims expressed in this article are solely those of the authors and do not necessarily represent those of their affiliated organizations, or those of the publisher, the editors and the reviewers. Any product that may be evaluated in this article or claim that may be made by its manufacturer is not guaranteed or endorsed by the publisher.