 Shinya Horiai
 Makoto Okumura
 Kazuto Sato2
- 1Regional Resilience Planning Lab., International Research Institute of Disaster Science, Tohoku University, Sendai, Japan
- 2Takasaki Branch, East Japan Railway Co. Ltd., Takasaki, Japan
Tsunami evacuation planning is a critical and urgent social issue that requires consideration of traffic impediments and road blockages caused by earthquakes and flooding. Traditional pedestrian evacuation models have focused primarily on micro-scale environments spanning a few dozen meters within buildings, limiting their applicability to tsunami scenarios involving travel over hundreds of meters. This study aims to (1) extend a cell FD-based dynamic traffic distribution model into a zonal MFD-based model and (2) apply it to pedestrian traffic to construct an optimization model that outputs efficient evacuation directions. Focusing on real local cities in Japan, we compare optimal solutions for different pedestrian evacuation direction scenarios. The results confirm that if pedestrians can preemptively understand multiple safe evacuation routes, rather than relying solely on the nearest facilities, efficient directional guidance that reduces congestion can be achieved.
1 Introduction
In coastal cities vulnerable to tsunamis, ensuring safe evacuation methods for residents in flood-prone areas is essential. Recently, more Japanese local governments have permitted vehicle evacuations for individuals with mobility challenges. However, given that earthquakes may damage roads and bridges, rendering vehicle evacuations infeasible, it is vital to explore safe pedestrian evacuation strategies for the general population.
Tsunami evacuations often exceed the spatial and temporal scales addressed in conventional pedestrian studies. These traditional studies typically focus on micro-scale ranges of a few meters, emphasizing factors such as individual sightlines and flows around intersections and exits [1]. In contrast, tsunami evacuations involve pedestrians distributed across urban areas exceeding 100 m in scale. Evacuees do not follow a single route to a common destination but instead undertake long-distance evacuations of over 1 km using multiple roads and heading toward various destinations. Dispersing evacuation routes and destinations from a macro perspective may mitigate the micro-level problems mentioned above and enhance overall evacuation safety. In the future, rapid local road assessments and mobile IT devices may allow for real-time dynamic guidance. However, given that many older residents in tsunami-prone Japanese cities struggle with IT device usage, a more practical approach involves clearly defining evacuation directions by zone in advance and promoting understanding through evacuation drills.
Urban traffic optimization models have been developed for vehicles to determine efficient evacuation routes and destinations by minimizing total evacuation time, completion time, or hazard encounter risk. However, few models address pedestrian tsunami evacuation. This study presents two key contributions: (1) the development of an optimization model based on a macroscopic fundamental diagram (MFD) that captures the density–flow relationship within zones of approximately 500 m, and (2) the extension of this framework from vehicles to pedestrians.
Using the zonal MFD-based evacuation traffic optimization model, the optimal evacuation direction for pedestrians in each zone can be determined in real time. However, if the model’s guidance diverges from evacuees’ initial assumptions, they may follow their own path, which risks invalidating the optimization. This study examines the impact of the breadth of directional choices on evacuation efficiency through scenario-based analysis.
2 Literature review and study aims
2.1 Dynamic vehicular traffic assignment studies
The issue of pedestrian evacuation from hazardous events has been studied with a focus on efficiently moving large groups from enclosed spaces (e.g., vehicles, buildings, underground malls) to limited exits, as reviewed by [2]. These insights inform the design of exits, evacuation routes, and signage systems.
Since the early 2000s, disasters such as urban fires, floods, typhoons, tsunamis, and hazardous material accidents have heightened attention to horizontal evacuations across road networks. [3] conducted a comprehensive global review of evacuation planning over the past 30 years, while [4] provided a systematic review of simulation-based optimization studies.
When road network conditions are static and link travel times constant, choosing routes with the shortest travel time is efficient. However, as traffic density increases, movement becomes constrained, leading to slower speeds and longer travel times. Thus, link travel times are modeled as increasing functions of traffic volume, diverging near critical volume thresholds to reflect congestion. By integrating this with conservation laws, continuity conditions, and cost functions, dynamic traffic assignments can be computed; for example, the model by [5].
Traffic flow, defined as density times spatial average speed, increases under free-flow conditions but decreases in congested regions once critical density is surpassed. On roads with uniform width and slope, the dynamics of congestion buildup and dissipation have been theoretically analyzed using kinematic wave theory and the fundamental diagram (FD). Parameter estimation enables simulation of evolving traffic flow. In traffic planning, goals typically include maximizing completed trips within a timeframe, minimizing total travel time, or minimizing journey completion time. Maintaining high flow rates requires keeping density below critical thresholds. Hence, many models focus on subcritical capacity conditions. [6] proposed a linear programming approach using a linear link performance function. Related optimization-based models include those by [7], [8], [9], and [10].
2.2 Traffic congestion in evacuation situation
The aforementioned traffic distribution models assume that density remains below critical levels and that congestion is avoided. However, during disaster evacuations, urgency often compels users to enter downstream roads as long as any capacity exists, increasing the likelihood of congestion beyond critical density. If congestion queues can be restricted to safe zones, a rapid reduction in vehicle volume within upstream hazard areas may mitigate damage. Moreover, if congestion in hazardous zones clears before the hazard strikes due to timely upstream evacuation, its negative impact can be avoided. Therefore, when planning evacuations using objective functions such as expected evacuees or expected casualties, congestion is not inherently detrimental and may even yield advantages. It is thus desirable to use dynamic models capable of capturing traffic conditions that include congestion. [11] developed a Cell Transmission (CT) model for a single-lane setting, representing time-dependent changes in traffic flow per road segment (cell) using a flow–density relationship aligned with kinematic wave theory. [12] demonstrated that by modeling cell FD relationships as piecewise linear functions and defining inter-cell connections as linear functions, the overall traffic flow, including upstream congestion due to downstream saturation, can be formulated as a linear programming problem and solved efficiently.
In this study, we extend the [12] model to construct an optimization model. The formulation employs the notations presented in Table 1. Indices for the cell set
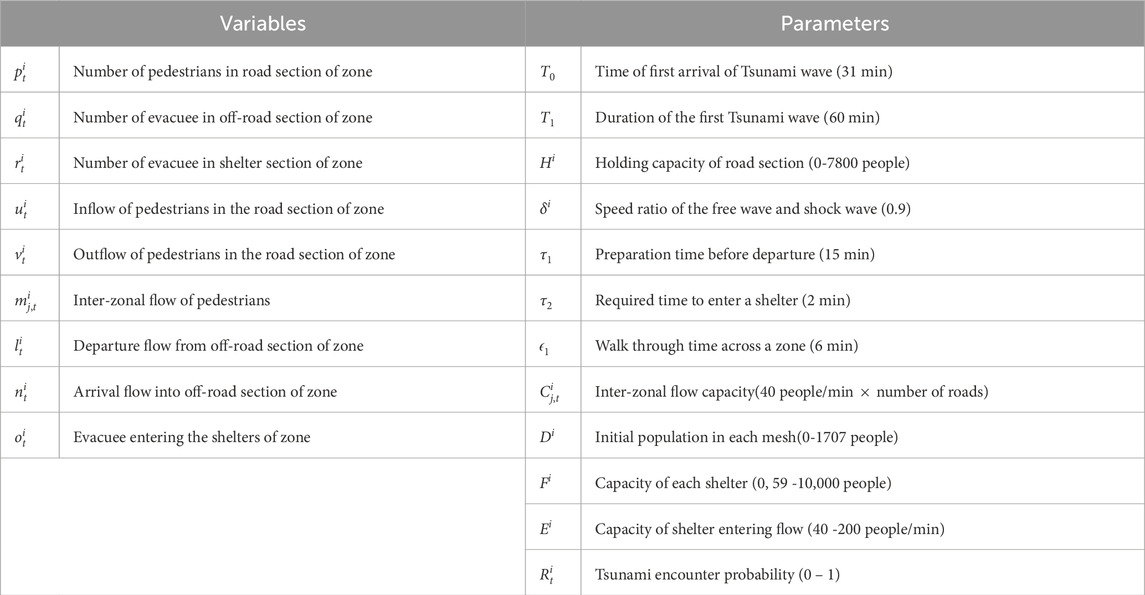
Table 1. Variables and parameters of this model.
The objective function Equation 1 represents the total number of vehicles on the road and corresponds to minimizing total travel time. Equation 2 expresses temporal conservation of vehicles, while Equation 3 ensures conservation of flow at nodes. Equation 4 captures initial demand, and Equations 5, 6 constrain exit and inflow rates by flow capacity. Specifically, Equation 7 limits inflow based on available holding capacity. Equation 8, known as the ordered solution property (OSP), ensures that in congested cells, outflow is maximized. This prevents the “flow holding back” issue, where vehicles remain in upstream cells despite available downstream capacity.
The model aligns with a trapezoidal FD. Since
Equation 9 implies that the outflow rate during a unit time cannot exceed the number of vehicles present at the beginning of the period, corresponding to the increasing portion (left edge) of the trapezoidal FD. Equation 6 sets the upper limit of outflow (top edge), while Equation 5 restricts inflow based on remaining capacity (right congested edge).
The FD models congestion in a single cell, considering vehicles as forming a point queue above it. The Nie model Equation 1 captures how rising cell density limits inflow (via Equation 7), which in turn constrains outflow from upstream cells through conservation at adjacent cells (Equation 3), allowing for upstream propagation of congestion.
Although the Nie model comprises linear expressions, Equation 8 introduces a conditional constraint that deviates from standard linear programming. [12] excluded Equation 8 from the initial formulation and applied an iterative algorithm to accelerate outflows from congested cells until the OSP condition was satisfied.
While these studies focus on single road sections, scaling to larger areas presents challenges in handling detailed road networks. To address this, MFD models were developed to express the relationship between the number of vehicles in an area (spatial density) and traffic volume (trip departures and arrivals). Studies by [13], [14], [15], [16], and [17] have explored the fundamental characteristics of such models. [18] created an agent-based simulation incorporating a trapezoidal MFD to estimate dynamic traffic distributions at the urban scale. These MFD-based efforts are reviewed by [19]. As an application, [20] proposed an evacuation optimization model using a nonlinear MFD. [21] applied a triangular MFD, incorporating departure time choices to analyze optimal transitions in road usage as urban flooding evolves over time.
2.3 Pedestrian evacuation studies
Compared to the above research on vehicle evacuations, pedestrian evacuation studies in road networks remain relatively limited. [22] and [23] adapted dynamic traffic assignment models for vehicular traffic to pedestrian contexts. [24] empirically studied crowd dynamics during the stoning rituals, contributing to flow–density modeling for pedestrians. [25] investigated maximum pedestrian flow under free-flow conditions, below critical capacity. [26] used a CT model to simulate pedestrian movement in confined areas such as public squares. [27] enhanced the applicability of trapezoidal pedestrian MFDs by introducing local density classifications around individuals. [19] reviewed pedestrian MFD developments and confirmed the feasibility of pedestrian evacuation modeling.
2.4 The current study
As described above, the development of zonal MFD models, evolved from CT models originally applied to single road segments, has advanced in pedestrian traffic modeling. The application of trapezoidal MFDs to evacuation contexts has also progressed. This study focuses on the trapezoidal FD-based model by [12], notable for its computational efficiency and operability as a linear programming formulation. By adapting this approach into a zonal MFD model for pedestrian evacuation, we aim to build an optimal, efficient, and tractable evacuation model.
Unlike [12], this study’s model does not incorporate the OSP condition. As discussed later, our objective function minimizes the expected number of tsunami victims during evacuation. In scenarios where a time buffer exists before tsunami arrival, it may be optimal to move toward zones closer to the coastline, despite higher eventual risk, due to the temporary equivalence in disaster probability across zones. As the hazard evolves, the rational direction of evacuation changes dynamically, and the OSP condition may not always be appropriate. Therefore, excluding the OSP condition allows the model to retain a standard linear programming structure, simplifying computation of the optimal solution.
3 Zonal MFD-based optimal tsunami evacuation model
3.1 Settings
This study develops a mathematical optimization model to determine the most efficient evacuation strategy while ensuring physical feasibility. The target area is divided into zones based on a regional mesh, which are rectangular units approximately 500 m in length, commonly used in urban planning for population aggregation. Each zone is divided into (a) road section, where pedestrians move between zones, (b) off-road land-use section, and (c) evacuation shelter section, which include safe facilities such as shelters, disaster prevention parks, or evacuation towers.
In the model,

Figure 1. Zone structure and variables.
3.2 Risk evaluation and objective function
The probability that an evacuee in mesh
The tsunami encounter probability is set to 0 for meshes outside the inundated area, evacuation shelter sections within inundated zones, and all zones for
Next, the expected number of tsunami victims based on a specific population distribution when evacuation does not occur is referred to as the “static risk value.” Specifically, this is calculated by first determining the average value of the tsunami encounter probability for each zone until the future and then summing the products of these averages with the given resident population, as expressed by Equation 11.
When evacuation occurs, population distribution changes over time. The dynamic risk value (DRV) estimates the expected number of tsunami victims under such conditions. It is calculated by summing, at each time point, the product of population and tsunami encounter probability, then averaging over the inundation period, as expressed by Equation 12. Minimizing the DRV is the objective of our optimization model.
3.3 Constraints
This model adopts similar constraints to those in the [12] model, including continuity conditions, capacity constraints for pedestrian flows, roadway capacity limits, maximum flow constraints, shelter capacity limits, initial population per zone, departure preparation time, walking time constraints, and non-negativity of decision variables.
Traffic continuity conditions are given by Equations 13–18.
Capacity constraints in road section are expressed by Equations 19, 20.
Maximum flow rate conditions limited by the existence of pedestrians are given by Equations 21–23.
Capacity constraints of evacuation shelter and its entry is given by Equations 24, 25.
Initial population in each zone is given exogenously by Equation 26.
Preparation time constraints are expressed by Equations 27, 28.
Walking time constraint is as given by Equation 29.
Lastly, nonnegative conditions for variables are given by Equation 30.
The model also incorporates the congestion effect, where increased pedestrian density reduces inflow to a zone. This is represented using a trapezoidal MFD structure, with key constraints including Equation 21, which indicates the limits on outflow based on existing population; Equation 19, which shows the flow capacity constraints at zone boundaries; and Equation 20, which demonstrates the congestion effects restricting inflow. These collectively describe the trapezoidal-shaped MFD governing outflow volume (
3.4 Restriction of pedestrians’ movements direction
The optimization model developed above seeks to minimize total dynamic risk across the entire region. As a result, individual evacuees may be directed along routes that diverge from those leading to the nearest shelter or that initially approach higher-risk areas. In such cases, evacuees may reject these instructions and instead follow routes they personally perceive as safer, potentially compromising evacuation effectiveness.
To address this issue, it is important to limit movement directions to those more acceptable to evacuees, such as toward the nearest shelter or higher ground. By choosing from among such acceptable directions, evacuation plans can be made more realistic and acceptable. This constraint can be implemented by Equation 31, below.
where
E) Movement allowed only toward the nearest evacuation shelter; if higher ground is closer, only that direction is allowed.
H) Movement allowed toward both the nearest shelter and nearest higher ground.
S) Movement allowed toward all adjacent zones with lower static risk, as well as toward the nearest shelter.
Typical movement options per mesh are: E) one direction; H) one or two directions; and S) two or three directions.
As a result of incorporating constraint (Equation 31), all model variables remain continuous and nonnegative, and both the objective function and constraints are linear. This ensures that the model remains a standard linear programming problem, solvable by general-purpose optimization solvers. In this study, we used Gurobi Optimizer v11.0.3.
4 Analysis of effectiveness of evacuation direction designation
To evaluate how well the proposed directional evacuation model reduces tsunami risk, empirical simulations were conducted using data from Hachinohe City, Aomori Prefecture, Japan.
4.1 Target area and calculation conditions for empirical calculations
The central urban area of Hachinohe City was selected as the target. The tsunami scenario used is based on a Japan Trench earthquake model, with inundation from the first wave expected within 30–60 min of the earthquake. In line with Hachinohe City’s evacuation policy, which excludes bridge crossings due to potential seismic damage, our study focuses on zones between the Mabechi and Niida Rivers (see Figure 2). The analysis included 284 regional meshes: 77 within the inundation area and 107 outside it. These meshes were treated as computational zones.
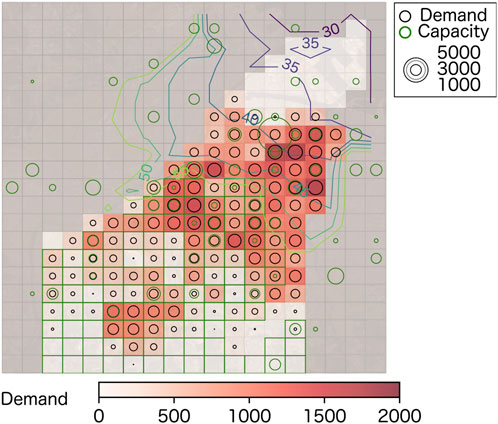
Figure 2. Evacuation demand and shelter capacity.
According to 2020 Census data, the inundation area has a nighttime population of 44,050. This “baseline population distribution” is used in all simulations. We aggregated the maximum capacities of designated shelters by Hachinohe City, and determined the capacity
The tsunami disaster probability

Figure 3. Static risk value and shelter capacity.
The road lengths, number of road intersections within each mesh, and the number of roads between meshes were obtained from the open data source, OpenStreetMap. From this data, the road capacity
Pedestrian free-flow speed was set at 5 km/h. Preparation time before evacuation was fixed at 15 min, based on data from the Great East Japan Earthquake.
4.2 Effect of limitation of movement directions
The four movement scenarios tested were: E) Toward the nearest shelter only; H) Toward the nearest shelter and high ground; S) Toward adjacent zones with lower static risk and the nearest shelter; O) Optimal: all physically possible directions allowed. These scenarios are illustrated in Figure 4 (panels E, H, S, and O).
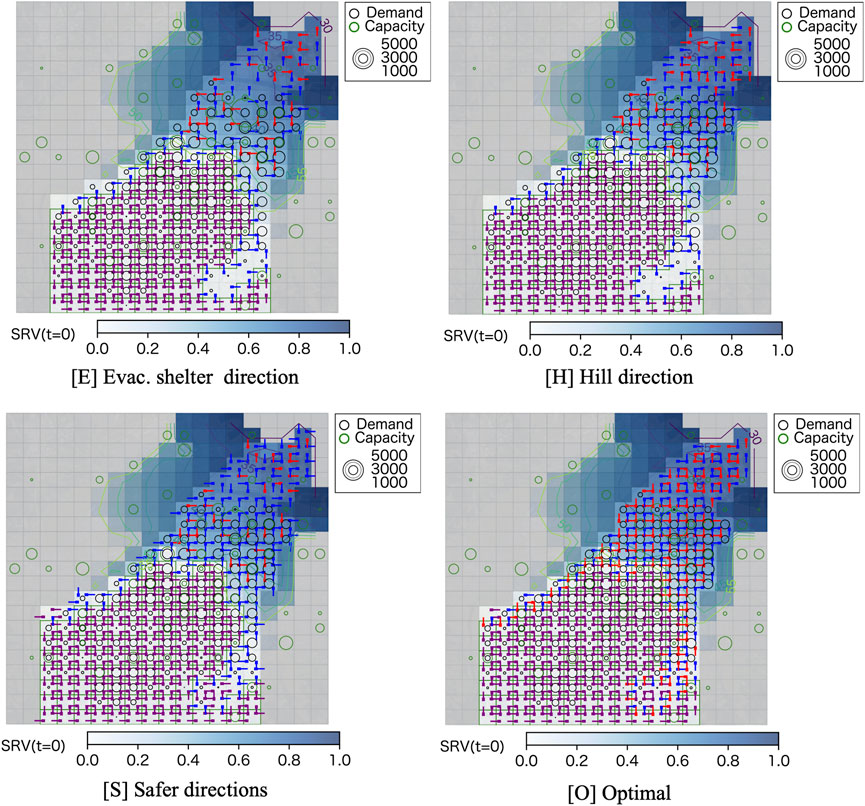
Figure 4. Direction sets for 4 cases.
Using the same baseline population, the SRV without evacuation is 2.1 × 10⁴, meaning nearly half of the 44,050 nighttime residents would encounter the tsunami without action. Table 2 summarizes results: O) Optimal: DRV = 4,883 people (11.1%); S) Safe direction: DRV = 5,167 people (11.7%); H) High ground: DRV = 6,278 people (14.3%); E) Shelter only: DRV = 9,259 people (21.0%).

Table 2. Comparison of 4 evacuation solutions.
Under O), shelter occupancy is highest (16,552 people), while 24,717 evacuate outside the inundation zone, fewer than in S or H. Total evacuation distance toward safer directions is 32,332 person-km, higher than S (32,068) and H (25,942). However, O) also involves 3,160 person-km of movement toward danger directions, more than the other three scenarios. This suggests that although O) minimizes risk, it may be difficult to implement due to evacuee resistance to moving toward danger.
Scenario S) results in the highest number of people evacuated outside the inundation area and limits dangerous movement to 1,436 person-km, making it a more acceptable option. Its DRV is only 1.06 times that of O), implying that, with prior explanation, this strategy could be implemented effectively.
Scenario E) assumes movement only to the nearest shelter, disregarding capacity constraints. As a result, 9,508 evacuees remain in inundated zones, producing a DRV of 9,259, which is 1.9 times that of O). The shelter occupancy rate is just 39.1%, indicating underutilization of safer, though less proximate, shelters.
Scenario H) outperforms E but is less effective than S. It achieves a DRV 1.28 times higher than O) and a casualty rate of 14.3%. However, it is implementable through basic education encouraging residents to identify and remember the nearest high ground.
Temporal changes in SRV(t) for all four scenarios are shown in Figure 5. Risk begins decreasing at t = 16, when evacuations start. At t = 30, divergence in rates becomes apparent, with E) plateauing first, followed by H) and then S). The final SRV values correspond to the DRV ranking in Table 2.
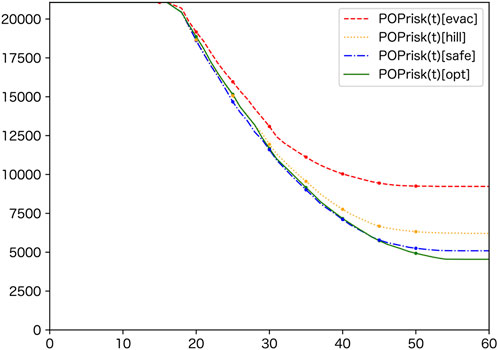
Figure 5. Temporal changes of static risk values for 4 cases.
Figure 6 compares cumulative inter-zone traffic volumes and population on roads per zone. In E, movement is concentrated along fewer paths, resulting in higher congestion. In contrast, H, S, and O show broader traffic dispersal, with increasing diversity of routes from H to O, demonstrating the effectiveness of broader movement allowances in distributing traffic load.

Figure 6. Inter-zonal Traffic and Cumulative Traffic in Zones for 4 cases.
4.3 Planning implications
Based on the above results, several implications for pedestrian evacuation planning emerge. In this study area, if no evacuation occurs, nearly half of the nighttime population is expected to be affected by the tsunami. To prevent congestion that could impede evacuation, it is essential to diversify evacuation traffic by encouraging route choices beyond the default direction to the nearest shelter, particularly across spatial scales greater than 500 m.
If evacuees are restricted to moving only toward the nearest evacuation shelter (E), the traffic dispersion effect is insufficient, resulting in a high expected casualty rate of 21%. In contrast, if residents are familiar with multiple safe evacuation directions from each zone (S), they can choose routes that are less prone to congestion. This behavioral flexibility supports traffic dispersion and reduces the expected casualty rate to 11.7%, which is close to the 11.1% achieved by the optimal scenario (O).
Therefore, disaster prevention education should emphasize not only the importance of prompt evacuation but also the existence of multiple safe directions from each zone. Residents should be encouraged to choose directions that avoid traffic concentration to improve safety. These insights should be integrated into public communication strategies and reinforced through regular evacuation drills.
5 Conclusion
This study highlights the significance of macroscopic evacuation guidance in pedestrian tsunami evacuation planning through an optimization-based approach. We developed a zonal optimization model based on the MFD, partitioning the urban space into zones of several hundred meters and representing the relationship between density and traffic flow within those zones. Importantly, we expanded the application scope from vehicular to pedestrian traffic. The resulting model is computationally tractable and operationally feasible. Moreover, we introduced a constraint mechanism that restricts movement directions to those considered rational by evacuees, demonstrating that such constrained optimization problems can be effectively solved using the same framework.
Empirical analysis using real-world data from Hachinohe City confirmed that the model’s optimal solution could reduce expected tsunami casualties by nearly 50% compared to a no-evacuation scenario. However, it also revealed challenges in implementation, as the optimal scenario required evacuees to move toward high-risk areas, which may be unrealistic. By incorporating constraints on movement toward risky directions, we confirmed that a high-demand strategy, acceptable to residents, can be computed with only a slight increase (1.06×) in expected casualties relative to the optimal solution.
Thus, the proposed model effectively calculates evacuation guidance from a macroscopic perspective, balancing efficiency and feasibility. Future research may explore sensitivity analyses involving traffic conditions such as pedestrian speed and road capacity. Additionally, applying the model to diverse regions under varying temporal and seasonal contexts will offer deeper insights. Expanding its application to areas with different population scales, spatial distributions, and infrastructure profiles will be essential for identifying local challenges and tailoring evacuation strategies accordingly.
Data availability statement
The original contributions presented in the study are included in the article, further inquiries can be directed to the corresponding author.
Author contributions
SH: Data curation, Formal Analysis, Writing – original draft, Visualization, Writing – review and editing, Conceptualization, Investigation. MO: Conceptualization, Methodology, Supervision, Project administration, Investigation, Writing – review and editing, Visualization, Software, Writing – original draft, Resources. KS: Visualization, Formal Analysis, Software, Writing – original draft, Data curation, Investigation.
Funding
The author(s) declare that no financial support was received for the research and/or publication of this article.
Acknowledgments
For the empirical analysis, the tsunami disaster probabilities
Conflict of interest
Author KS was employed by East Japan Railway Co. Ltd.
The remaining authors declare that the research was conducted in the absence of any commercial or financial relationships that could be construed as a potential conflict of interest.
Generative AI statement
The author(s) declare that no Generative AI was used in the creation of this manuscript.
Any alternative text (alt text) provided alongside figures in this article has been generated by Frontiers with the support of artificial intelligence and reasonable efforts have been made to ensure accuracy, including review by the authors wherever possible. If you identify any issues, please contact us.
Publisher’s note
All claims expressed in this article are solely those of the authors and do not necessarily represent those of their affiliated organizations, or those of the publisher, the editors and the reviewers. Any product that may be evaluated in this article, or claim that may be made by its manufacturer, is not guaranteed or endorsed by the publisher.
References
2. Vermuyten VH, Beliën J, De Boeck L, Reniers G, Wauters T. A review of optimisation models for pedestrian evacuation and design problems. Saf Sci (2016) 87:167–78. doi:10.1016/j.ssci.2016.04.001
3. Aldahlawi R, Akbari V, Lawson G. A systematic review of methodologies for human behavior modelling and routing optimization in large-scale evacuation planning. Intern J Disast Risk Reduc (2024) 110:104638. doi:10.1016/j.ijdrr.2024.104638
4. Bayram V. Optimization models for large scale network evacuation planning and management: a literature review. Oper Res Manag Sci (2016) 21:63–84. doi:10.1016/j.sorms.2016.11.001
5. Merchant DK, Nemhauser GL. A model and an algorithm for the dynamic traffic assignment problems. Transp Sci (1978) 3:183–99. doi:10.1287/trsc.12.3.183
6. Ziliaskopoulos AK. A linear programming model for the single destination system optimum dynamic traffic assignment problem. Transp Sci (2000) 34(1):37–49. doi:10.1287/trsc.34.1.37.12281
7. Liu Y, Lai X, Chang G. Cell-based network optimization model for staged evacuation planning under emergencies. Transp Res Rec (2006) 1964:127–35. doi:10.1177/0361198106196400114
8. Alaeddine H, Serrhini K, Maizia M, Neron E. A spatiotemporal optimization model for the evacuation of the population exposed to flood hazard. Nat Hazards Earth Syst Sci (2015) 15:687–701. doi:10.5194/nhess-15-687-2015
9. Ndiaye IA, Neron E, Jouglet A. Macroscopic evacuation plans for natural disasters - a lexicographical approach for duration and safety criteria: Lex((Q|S) flow). OR Spectr (2017) 39:231–72. doi:10.1007/s00291-016-0451-1
10. Hasan MH, Hentenryck PV. Large-scale zone-based evacuation planning - part I: models and algorithms. Networks (2020) 77:127–45. doi:10.1002/net.21981
11. Daganzo CF. The cell transmission model: a dynamic representation of highway traffic consistent with the hydrodynamic theory. Transp Res (1994) 28(4):269–87. doi:10.1016/0191-2615(94)90002-7
12. Nie YM. A cell-based merchant–nemhauser model for the system optimum dynamic traffic assignment problem. Transp Res B (2011) 45(2):329–42. doi:10.1016/j.trb.2010.07.001
13. Daganzo CF. Urban gridlock: macroscopic modeling and mitigation approaches. Transp Res B (2007) 41(41):49–62. doi:10.1016/j.trb.2006.03.001
14. Aboudolas K, Geroliminis N. Perimeter and boundary flow control in multi-reservoir heterogenous networks. Transp Res B (2013)(55) 265–81. doi:10.1016/j.trb.2013.07.003
15. Knoop VL, Lint HV, Hoogendoorn SP. Traffic dynamics: its impact on the macroscopic fundamental diagram. Physica A (2015) 438:236–50. doi:10.1016/j.physa.2015.06.016
16. Knoop VL, Hoogendoorn SP. An area-aggregated dynamic traffic simulation model. EJTIR (2015) 15(2):226–42. doi:10.18757/ejtir.2015.15.2.3070
17. Zhang Z, Parr SA, Jiang H, Wolshon B. Optimization model for regional evacuation transportation system using macroscopic productivity function. Transp Res B (2015) 81:616–30. doi:10.1016/j.trb.2015.07.012
18. Kim S, Tak S, Yeo H. Agent-based network transmission model using the properties of macroscopic fundamental diagram. Transp Res C (2018) 93(93):79–101. doi:10.1016/j.trc.2018.05.024
19. Aghamohammadi R, Laval JA. Dynamic traffic assignment using the macroscopic fundamental diagram: a review of vehicular and pedestrian flow models. Transp Res B (2020) 137:99–118. doi:10.1016/j.trb.2018.10.017
20. Zhang Z, Wolshon B, Dixit VV. Integration of a cell transmission model and macroscopic fundamental diagram - network aggregation for dynamic traffic models. Transp Res C (2015) 55:298–309. doi:10.1016/j.trc.2015.03.040
21. Masuda S, Hato E. Combinatorial reconfiguration problem based on MFD for evacuation management under disasters (2024). Available online at: https://trc-30.epfl.ch/wp-content/uploads/2024/09/TRC-30_paper_203.pdf (Accessed June 1, 2025).
22. Feng L, Miller-Hooks E. A network optimization-based approach for crowd management in large public gatherings. Transp Res C (2014) 42(42):182–99. doi:10.1016/j.trc.2014.01.017
23. Taneja L, Bolia NB. Network redesign for efficient crowd flow and evacuation. Appl Math Model (2018) 53:251–66. doi:10.1016/j.apm.2017.08.030
24. Helbing D, Johansson A, Al-Abideen HZ. Dynamics of crowd disasters: an empirical study. Phys Rev E (2007) 75:046109. doi:10.1103/PhysRevE.75.046109
25. Ndiaye IA, Neron E, Linot A, Monmarche N, Goerigk M. A new model for macroscopic pedestrian evacuation planning with safety and duration criteria. Transp Res Proc (2014) 2:486–94. doi:10.1016/j.trpro.2014.09.064
26. Li N, Guo R. Simulation of bi-directional pedestrian flow through a bottleneck: cell transmission model. Physica A (2020) 555:124542. doi:10.1016/j.physa.2020.124542
27. Hoogendoorn SP, Daamen W, Knoop VL, Steenbakkers J, Sarvi M. Macroscopic fundamental diagram for pedestrian networks: theory and applications. Transp Res Proced (2017) 23:480–96. doi:10.1016/j.trpro.2017.05.027
28. Ozaki S, Furusato H, Horiai S, Nojima K, Tanaka S, Takase S. Tsunami runup analysis in hachinohe city considering effects of structures. Proc Conf Comput Eng Sci (2024) 29:728–30. Available online at: https://confit-sfs.atlas.jp/customer/jsces29/abstract/C-11-03.pdf (Accessed June 1, 2025).
Keywords: tsunami evacuation, optimization, pedestrian, zonal MFD, macroscopic guidance
Citation: Horiai S, Okumura M and Sato K (2025) The necessity of macroscopic directional guidance in pedestrian tsunami evacuation: a zonal MFD-based optimization approach. Front. Phys. 13:1644312. doi: 10.3389/fphy.2025.1644312
Received: 10 June 2025; Accepted: 04 September 2025;
Published: 25 September 2025.
Edited by:
Ryosuke Yano, Tokio Marine dR Co., Ltd., JapanReviewed by:
Satoshi Sugiura, Kochi University of Technology, JapanMakoto Chikaraishi, Hiroshima University, Kasumi Campus, Japan
Copyright © 2025 Horiai, Okumura and Sato. This is an open-access article distributed under the terms of the Creative Commons Attribution License (CC BY). The use, distribution or reproduction in other forums is permitted, provided the original author(s) and the copyright owner(s) are credited and that the original publication in this journal is cited, in accordance with accepted academic practice. No use, distribution or reproduction is permitted which does not comply with these terms.
*Correspondence: Makoto Okumura, bW9rbXJAdG9ob2t1LmFjLmpw
†These authors have contributed equally to this work and share first authorship