 Sanglin Zhao
 Jin Ye2
- 1School of Engineering Management, Hunan University of Finance and Economics, Changsha, China
- 2Academy of Innovation, City University of Hong Kong, Kowloon, Hong Kong SAR, China
- 3School of Business, Society and Engineering, Mälardalen University, Västeras, Sweden
As the basic and important service facilities of the national economy, the smooth and safe operation of expressways is of considerable practical significance to promote the stable development of the transportation industry and support the implementation of national strategies. Therefore, in order to improve the ability of expressways to deal with sudden traffic accidents and its operation and maintenance resilience, this study introduces the theory of safety resilience into the safety management of expressway sections, uses word frequency analysis to identify the main factors of high-speed operation and maintenance safety resilience, and constructs an evaluation system of operation and maintenance resilience. An expressway operation and maintenance resilience evaluation model based on improved dung beetle algorithm optimization (WFA-Critical-IAHP-DBO-ELM) was established and applied to a section of the Chang–Zhang Expressway. Compared with the random forest model and XGBoost model, it is proven that the DBO-ELM model has strong generalization ability and evaluation accuracy. This paper proposes a scientific evaluation solution for improving the resilience of expressways and provides a reference for engineering practice.
1 Introduction
A report delivered to the 20th CPC National Congress of China Party clearly pointed out that it is necessary to optimize the layout, structure, function, and system integration of infrastructure and build a modern one. As the foundation, forerunner, strategic industry, and important service facilities of the national economy, the smooth and safe operation of expressways is of great significance to promote the healthy development of the transportation industry and support the implementation of national strategies. By 2025, mileage of the newly added expressways in China has reached 192 km, and the total mileage has exceeded 8,613 km. The successful operation of a series of landmark projects has strongly supported the national strategic development.12. However, rapid development of expressways is also accompanied by security challenges in the operation and maintenance stages. In recent years, there have been frequent accidents in the operation and maintenance stages of expressways. On 1 May 2024, the pavement collapse accident of Meida Expressway caused casualties and economic losses and had a negative impact on the public’s travel confidence and reliability of the transportation system, highlighting the lack of safety and resilience of the system. Traditional expressway safety management adopts the mode of “one road, one company,” which has serious business segmentation, unsmooth cross-organizational flow of elements, low transaction efficiency, and low sensitivity of operation and maintenance, and it is difficult to cope with the complex and changeable operation and maintenance environment. Thus, it is urgent to introduce the theory of safety resilience into the safety management of expressway sections to improve their anti-interference ability and rapid recovery ability in emergencies and ensure long-term stable operation. Therefore, it represents not only an urgent need to ensure the safety of people’s lives and property but also an inevitable choice to promote the high-quality development of the transportation industry by refining and evaluating the factors influencing expressway operation and maintenance resilience so as to put forward the path to improve the operation and maintenance resilience. It is urgent to introduce resilience theory to enhance the anti-interference ability and rapid recovery ability of the highway system in emergencies, and ensure its long-term stable operation. Therefore, extracting the factors affecting the resilience of highway operation and maintenance, evaluating them, and proposing a path to improve the resilience of operation and maintenance is not only an urgent need to ensure the safety of people’s lives and property but also an inevitable choice to promote the high-quality development of the transportation industry. After combining the related literature, some scholars have carried out research on the resilience of expressway systems, focusing on the construction of the expressway resilience index system and resilience evaluation methods.
Domestic and foreign scholars have carried out relevant research from the dimensions of technology and management for the expressway operation and maintenance index system. Some scholars have established the resilience index based on the theoretical framework of structural performance “resilience triangle” by quantifying parameters such as structural performance attenuation rate and recovery gradient [1, 2]. However, the simple utility function framework cannot comprehensively construct the resilience evaluation using multidimensional indicators [3]. Therefore, some scholars express the connectivity of the road network by integrating the index system of complex network theory and adopting parameters such as node degree distribution and network efficiency [4–6]. Although the complex network model can consider more dimensions of operation and maintenance indicators, it has poor sensitivity and high requirements for a single data source [7, 8]. In addition, some literatures only consider the pavement itself in the construction of the operation and maintenance resilience index of expressway sections, ignoring the exogenous factors leading to traffic accidents [5, 6, 9, 10]. The operation and maintenance of the expressway system takes into account not only data such as road conditions and traffic flow but also historical and current information such as aging degree of facilities and safety management measures. Exogenous factors such as regional economic development level, high-speed managers, and traffic services indirectly have a crucial impact on the occurrence of high-speed accidents. At the same time, the traditional index construction only considers disaster and accident data, and the data sources are scattered, so it is difficult to unify the dimensions. The extraction of disaster and accident data is superficial and lacks targeted index construction, with a low correlation between indicators [11–13]. Moreover, the evaluation results of some index dimensions lack scientific comparison, the basis of index construction is not revealed, and the evaluation mechanism has not been clarified. [14]. Therefore, the following improvements are put forward in the index construction of this study: ① introducing external influencing factors such as regional economic indicators to enhance the comprehensiveness of high-speed operation and maintenance evaluation; ② using word frequency analysis to extract the evaluation basis of key expressway operation and maintenance index enhancement index data; ③ synthesizing the data of disasters and accidents and establishing the multi-dimensional high-speed operation and maintenance evaluation index.
For expressway resilience evaluation methods, scholars mainly focus on traditional evaluation models, classical statistical methods, and artificial intelligence model algorithms. Traditional evaluation methods take simple utility function method as the core and realize the resilience quantification by establishing performance loss function1,2 such as the resilience triangle function proposed by Bruneau et al. [15] and the road network toughness evaluation method based on the factor model by Aydin et al. [16]. Although this method is simple in calculation, it is difficult to accurately reflect the nonlinear change in complex disaster scenes. The classical statistical model mainly adopts the multiple linear regression equation [1] and probability evaluation method [2], but there are some shortcomings, such as insufficient consideration of the interaction between indicators, low accuracy of the model, and poor adaptability to complex data [3]. In recent years, the artificial intelligence method has made a breakthrough in the field of toughness evaluation, which mainly includes the following: (1) evaluation models based on machine learning, such as support vector machine [4], random forest [7] and neural network [9], mining the potential association between toughness indicators through the data-driven mode; (2) intelligent optimization algorithms, such as the genetic algorithm [10] and particle swarm optimization [5], are used for decision optimization of the multi-objective toughness improvement scheme; (3) digital information technology [6], through the construction of the entity-virtual two-way mapping model to achieve dynamic evaluation of system resilience; in addition, probability, simulation model, dynamic Bayesian network, and other methods have also been used for quantitative evaluation of system resilience, but the research on expressways is relatively scarce. The existing research provides an important reference for expressway system toughness evaluation, but there are still some shortcomings: First, most of the research studies focus on the impact of specific scenarios, such as bad weather and extreme disasters, on expressway toughness, lacking cross-domain applicability, and it is difficult to comprehensively cover the expressway toughness performance in daily operation and emergency response [5, 9, 10]. Second, although many advanced theories and methods are used in the construction of evaluation models, these models rely on much specific data, which have poor universality and reproducibility in expressway systems in different regions and are difficult to be widely used in actual expressway operation and maintenance management [6, 11–14]. The extreme learning machine (ELM) model optimized by the dung beetle optimization algorithm (DBO) shows remarkable cross-domain applicability by combining the global search ability of the intelligent optimization algorithm with the efficient learning characteristics of ELM [13, 16–22]. Compared with the stability limitation caused by the random initialization parameters of traditional ELM, DBO-ELM can effectively improve the convergence speed and generalization accuracy of the model by dynamically adjusting the network weight threshold, especially when dealing with high-noise and nonlinear data, and improve the repeatability of the evaluation data [23–31]. Therefore, in this study, the toughness theory is introduced into the safety management of the expressway system, and the ELM algorithm model optimized by the improved DBO is combined to evaluate the toughness of the expressway section system, taking into account the correlation between the actual pavement and the surrounding economic and environmental conditions. We put forward a feasible safety promotion path in the operation and maintenance stage of the expressway system and proposed new ideas and methods for ensuring the safe and stable operation of expressway Article types.
2 Method selection
2.1 Theoretical basis
2.1.1 Resilience theory
Based on the scenario of highway operation and maintenance, the resilience of highway system operation and maintenance refers to the anti-interference ability of the highway system to maintain basic traffic functions, the response ability to quickly identify faults, and the repair ability to restore normal operation after disasters in the face of sudden traffic events (such as road collapse and multi vehicle rear end collisions) and environmental disturbances (such as meteorological disasters). It is a comprehensive reflection of the combined effects of system stability, redundancy, adaptability, recovery, and external driving forces. This definition differs from traditional single-disaster resistance capabilities, emphasizing the dynamic characteristics of the entire process from interference to response and recovery, and is in line with the operational needs of continuous operation of and sudden risks in highways (Figure 1).
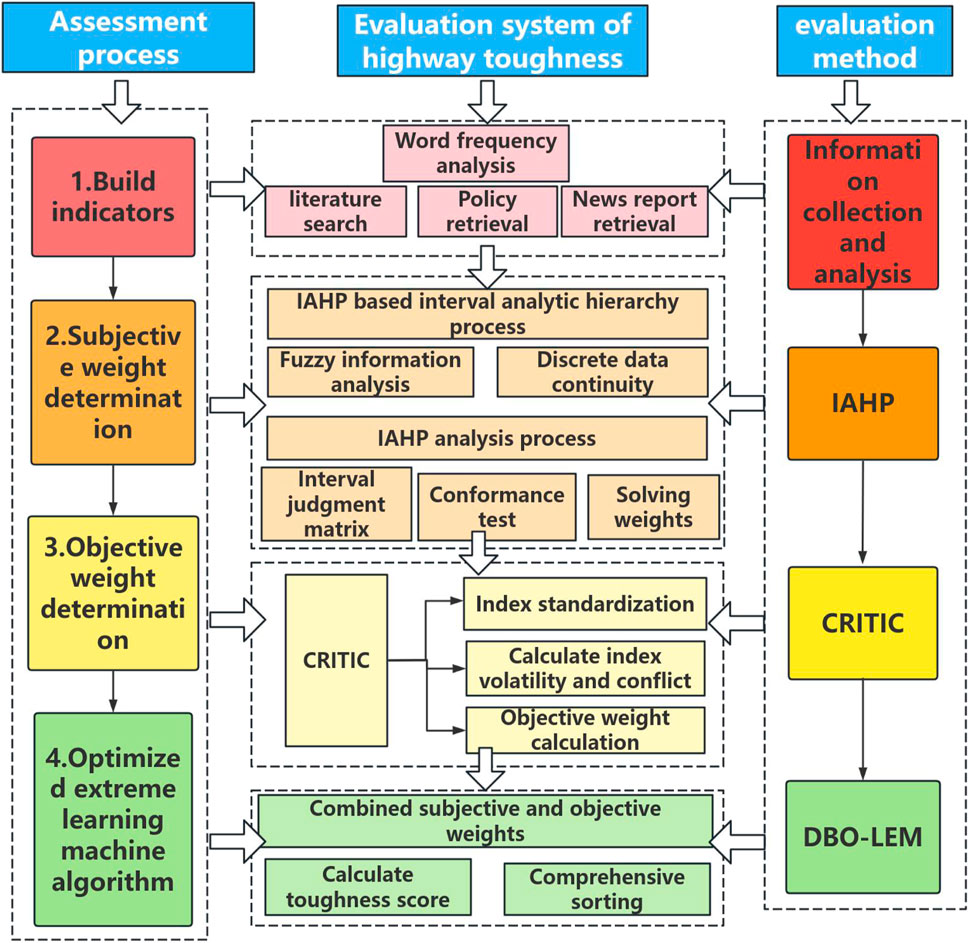
Figure 1. Research technical route.
Based on the core connotation of resilience theory, this study constructs a five-dimensional evaluation framework for stability, redundancy, adaptability, resilience, and driving force by combining the technical characteristics of highway operation and maintenance (such as facility status and traffic flow) with the external environment (such as regional economy). The theoretical basis for each dimension is as follows: Stability: Based on the theory of infrastructure safety monitoring, it focuses on the basic ability of the system to resist interference. By quantifying indicators such as environmental equipment monitoring coverage, entrance and exit density, and facility integrity [15, 16], use of a sound monitoring system and high-quality facilities can reduce the probability of sudden failures, which is the fundamental guarantee for resilience; Redundancy: Based on the theory of system redundancy design, the risk of traffic flow fluctuations and resource shortages is evaluated through indicators such as channel congestion, per capita road area, and peak traffic volume [3, 7]. The theoretical logic is that when a certain passage fails (such as an accident occupying the road), redundant resources (such as emergency lanes and backup road networks) can replace the original functions, reduce service interruption time, and the per capita road area reflects the supporting role of redundant resources in conferring resilience. Adaptability: Based on the theory of organizational management adaptation, it emphasizes the ability of operation and maintenance entities to respond to complex scenarios, quantified through indicators such as security management system, dispatch and command efficiency, and personnel skill quality [32, 33]. The adaptability of personnel and systems determines the flexibility of the system’s response to sudden situations, and the skill quality of dispatchers selected in this article directly affects the efficiency of on-site command after accidents. Resilience: Based on the theory of post-disaster repair efficiency, focusing on the system’s ability to recover from a fault state, evaluated through indicators such as the integrity of communication electromechanical systems, emergency response capabilities, and fire water supply systems [34, 35]. The availability of critical facilities and the completeness of emergency mechanisms determine the time taken for fault repair. Driving force: Based on the theory of economic infrastructure synergy, we innovatively incorporate regional economic factors into resilience assessment [36, 37]. Economic indicators such as regional per capita GDP and urbanization rate determine the investment of operation and maintenance funds, which are external guarantee factors for enhancing overall system resilience. Economic development has a positive driving force on operation and maintenance resilience.
2.1.2 Model theory
ELM is a single hidden layer feedforward neural network (SLFN) learning algorithm that revolutionizes traditional neural networks. The core breakthrough of the ELM model lies in optimizing the inefficient learning mode that relies on the iterative adjustment of all parameters in traditional neural networks and establishing an efficient learning framework based on random mapping and analytical solutions. Compared with traditional methods such as backpropagation (BP) neural networks, ELM models significantly improve learning speed and generalization performance while maintaining nonlinear fitting ability [36, 38–42].
The fast learning characteristics of ELM models stem from a unique parameter determination mechanism. During network training, the weights and biases from the input layer to the hidden layer are randomly initialized and do not require iterative optimization through backpropagation [3, 43, 44]. The weights from the hidden layer to the output layer are directly determined through analytical methods for solving linear systems. This process avoids the local optimal trap and lengthy iterative process brought by traditional gradient descent methods. This mechanism exhibits the advantages of excellent efficiency on large-scale datasets, such as MNIST handwriting recognition and traffic sign recognition.
From a theoretical perspective, the ELM model breaks through the traditional neural network’s dependence on parameter iteration adjustment [45, 46]. Its mathematical essence is to construct a feature space through randomly generated hidden layer nodes and then solve for the optimal output weights through the least squares method. This method not only ensures the universal approximation ability of the model but also significantly reduces the need for human intervention. In engineering applications, the ELM model is particularly suitable for handling high-dimensional, nonlinear, and noisy data in scenarios such as highway operation and maintenance. The randomly initialized hidden layer parameters can capture complex patterns in the data, while the analytical solving process ensures stable learning performance even under small sample conditions. Compared with the BP neural network, the ELM model effectively avoids the shortcomings of slow training speed and easy to fall into local extremum. In empirical research in multiple fields such as runoff prediction and quality monitoring, it has shown better relative error and certainty coefficient [47].
The Dungeon Optimization Algorithm (DBO) is a novel swarm intelligence optimization algorithm proposed in 2022. The core innovation lies in constructing an optimization framework that balances global exploration and local development by simulating the three ecological behaviors of beetles in nature. Compared with traditional methods such as particle swarm optimization (PSO) and genetic algorithm (GA), the DBO algorithm exhibits stronger convergence ability and resolution accuracy when dealing with complex optimization problems [48].
The three behaviors of the DBO algorithm have achieved comprehensive improvement in optimization performance through dynamic collaboration. Global exploration ensures the breadth of search, local development ensures the depth of search, and diversity maintenance ensures the sustainability of search. This collaborative mechanism enables the DBO algorithm to strike a balance between convergence speed and solution quality when dealing with complex engineering problems such as ELM model parameter optimization, providing an efficient and reliable parameter optimization solution for the resilience assessment model of highway operation and maintenance [32, 33, 49, 50].
2.2 Research innovation
Expressway system operation and maintenance not only involves real-time data such as road conditions and traffic flow but also needs to consider the aging degree of facilities, safety management measures, and other historical and current information. Therefore, the measurement of expressway system operation and maintenance resilience involves large data, fuzzy information, diverse indicators, and close correlation.
The existing research often adopts a traditional model and single model to evaluate, which has obvious shortcomings [51] For example, the adaptability and effectiveness of the entropy weight method are limited when dealing with a large number of high-dimensional data; Reasoning-based models, such as cloud models, have advantages in dealing with uncertainties, but the complexity of reasoning programs is high. In addition, it is difficult for a single method to comprehensively cover all aspects such as environment, economy, and climate of expressway system operation and maintenance and safety and toughness, which leads to a single perspective of the evaluation results.
Aiming at the shortcomings, this paper puts forward an innovative solution: to build a comprehensive model of word frequency analysis (WFA), objective weight method based on conflict indicators (CRITIC), interval analytic hierarchy process (IAHP), DBO, and ELM. Fuzzy information in expressway operation and maintenance data is flexibly extracted by WFA, which lays a foundation for evaluation. CRITIC is used to objectively determine the weight of each index to reduce subjective interference. IAHP provides a systematic decision-making framework to help comprehensive consideration. Improved DBO plays a key role in feature selection and extraction of massive data. The ELM realizes efficient prediction and evaluation by virtue of its fast learning and generalization ability. [52–55]. The measurement model of expressway system operation and maintenance constructed in this paper not only overcomes the limitations of traditional methods but also constructs a more comprehensive, concise, and adaptable analysis framework, aiming at improving the comprehensiveness and accuracy of expressway system operation and maintenance toughness evaluation.
3 Construction of the expressway operation and maintenance resilience measurement index system
In order to further study and improve the resilience of expressway operation and maintenance, this study adopts literature retrieval-word frequency analysis-index extraction to build an evaluation index system. With keywords such as “highway traffic,” “toughness theory,” “risk assessment,” “operation and maintenance safety,” and “toughness evaluation,” 71 papers highly related to this research topic were searched on authoritative platforms such as China CNKI and Web of Science. WFA is introduced to make word frequency statistics on key words such as resilience index, evaluation index, and influencing factors, and finally 150 indexes closely related to the resilience of expressway system operation and maintenance are extracted. Screening the index items with frequency more than four times, and merging the similar indexes to eliminate redundancy and improve the refinement and practicability of the index system, and finally determining 30 unique and representative toughness indexes, as shown in Table 1. In the stage of model construction, the multidimensional characteristics of expressway system operation and maintenance toughness are fully considered, including key aspects such as stability, redundancy, adaptability, resilience, and driving.
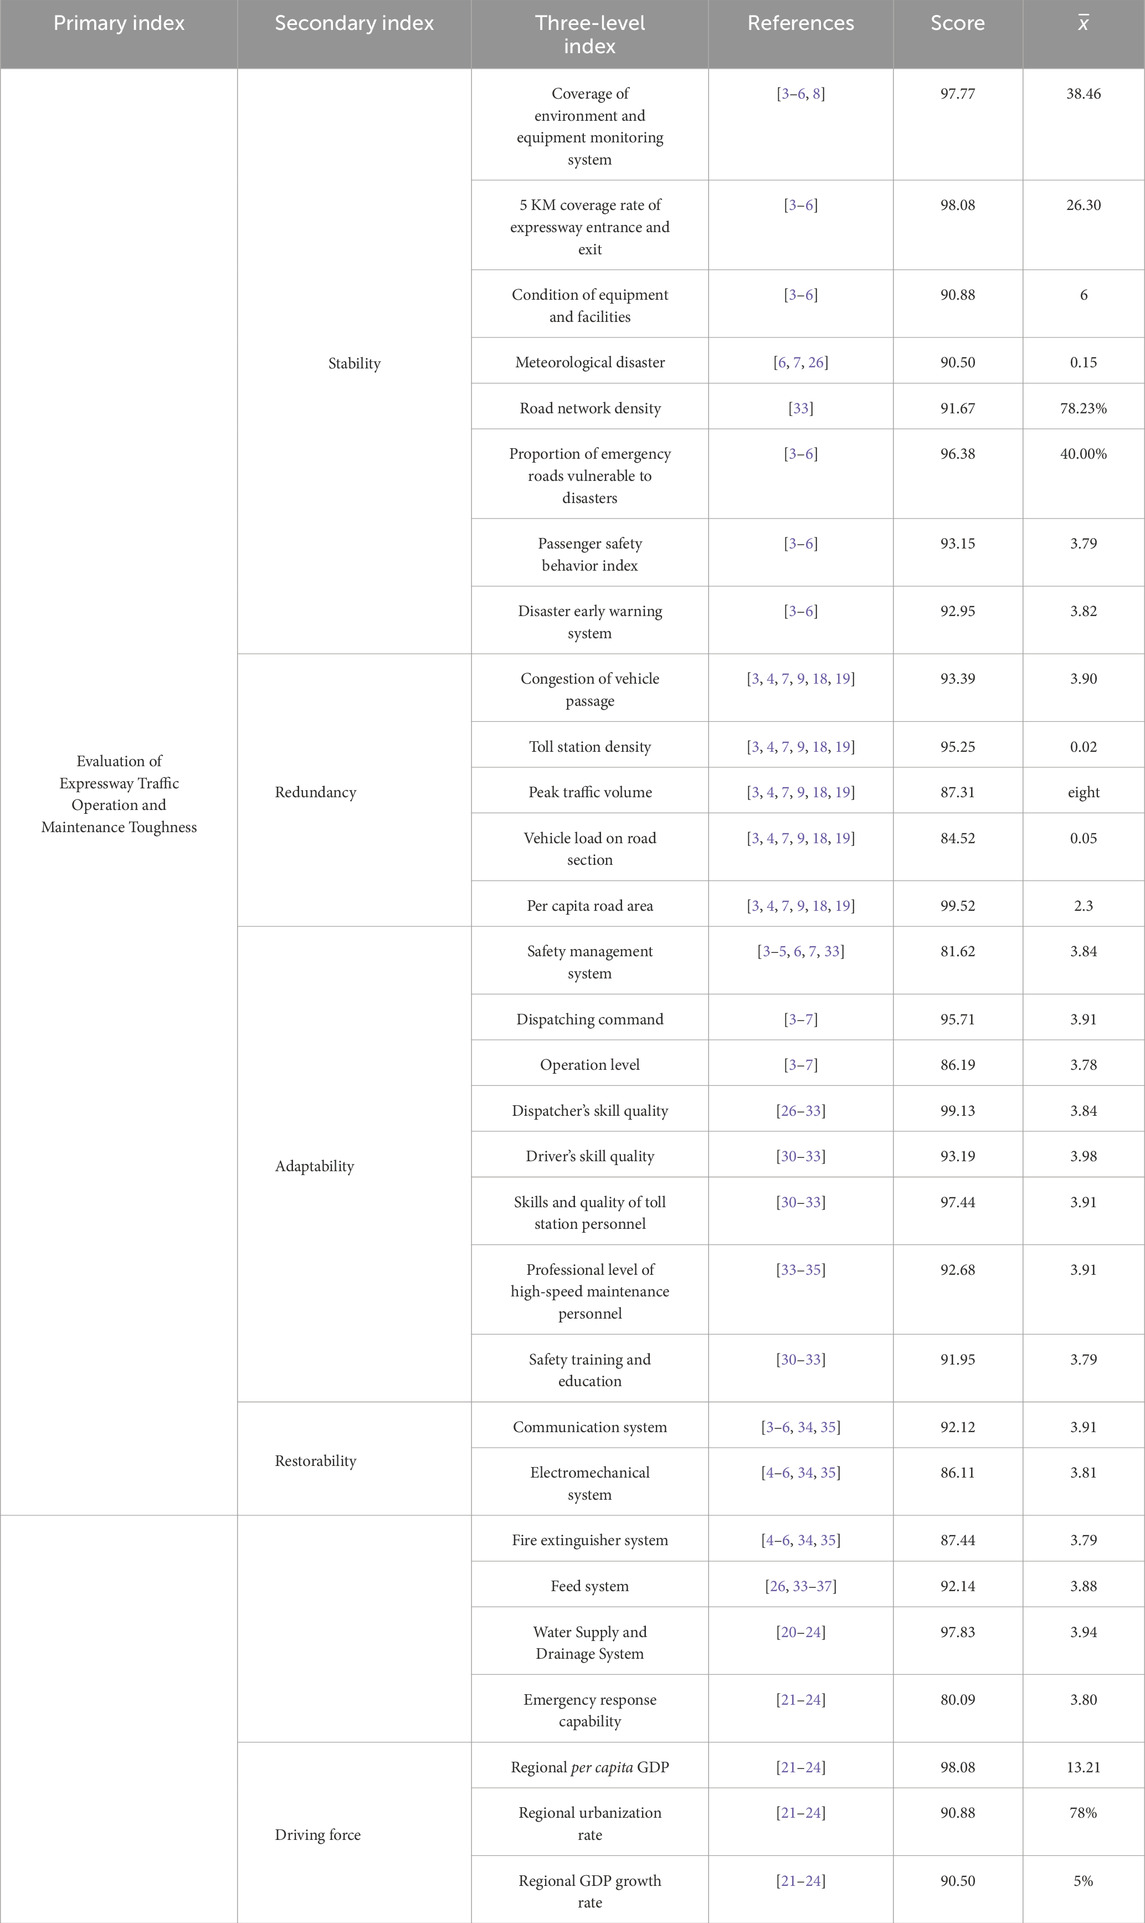
Table 1. Evaluation index system of expressway operation and maintenance toughness.
4 Construction of the expressway operation and maintenance resilience measurement model
In order to ensure the accuracy and reliability of the evaluation results, the combination of subjective weighting and objective weighting is used to determine the index weight. IAHP-CRITIC is used to comprehensively consider expert experience and objective data, and a more scientific and reasonable weight distribution is obtained.
In order to further improve the efficiency and accuracy of the evaluation model, this paper introduces the improved DBO-ELM for evaluation, which can not only quickly process a large number of index data but also find the optimal evaluation model parameters through the optimization algorithm, thus ensuring the stability and reliability of the evaluation results.
4.1 Expressway operation and maintenance toughness measure index combination weighting
In the evaluation of expressway operation and maintenance, it is easy to miss information only by subjective judgment, and the method of combining subjective empowerment with objective empowerment is adopted.
4.1.1 Determination of subjective weight based on IAHP
IAHP is used to deal with fuzzy problems under the condition of insufficient information, which can effectively reflect the uncertainty and fuzziness of things. IAHP [11] Using interval number instead of point value to describe its uncertainty can effectively weaken the subjective tendency in expert evaluation and is more suitable for the evaluation of operation and maintenance toughness of high-speed traffic projects.
4.1.1.1 Constructing the interval judgment matrix
In this paper, the scale method of 1–9 is used to compare the operation and maintenance risk factors of expressway operation and maintenance resilience, and the interval number of the relative importance of expert evaluation is constructed to form the judgment matrix (Equation 1).
4.1.1.2 Consistency test
Calculate k and m as follows:
The interval judgment matrix is in good agreement when k
4.1.1.3 Solving weights
In this paper, the weight vector Wz corresponding to the index is calculated according to the interval characteristic root method, and the calculation formula is as follows (Equations 4–6).
4.1.2 Determination of objective weight based on the CRITIC method
The CRITIC method is a weighting method to calculate the objective weight according to the amount of information in objective data. Compared with the entropy weight method, the CRITIC method is more effective in reflecting the differences and conflicts between indicators. Assuming that there are m schemes and indicators, the steps to determine the objective weight by the CRITIC method are as follows.
4.1.2.1 Index standardization
In order to unify many indexes into the same dimension, it is necessary to standardize them so that all indexes have the same benefit. The processing methods for different types of indicators are as follows (Equations 7, 8).
Benefit index:
Cost indicator:
4.1.2.2 Calculate the volatility and conflict of indicators
The fluctuation of indicators is reflected by standard deviation. The greater the standard deviation, the more useful information it reflects. The conflict of indicators is reflected by the correlation coefficient between indicators. The stronger the correlation between indicators and other indicators, the more repetitive the content, and the less useful the information.
The calculation formulas of standard deviation and correlation coefficient are as follows (Equations 9, 10):
where
4.1.2.3 Objective weight calculation
The information entropy of indicator J can be expressed as
The greater the amount of information, the more useful it is, and the more weight should be taken. The objective weight of indicator J is calculated as follows (Equation 12):
4.1.3 Combination weight
In this paper, the combination weight is determined according to the principle of minimum discriminant information, and the subjective or objective limitations in the selection of index weight are overcome by narrowing the deviation between the combination weight and the subjective and objective weights of indicators [17, 56–59]. The mathematical model for determining the combination weight is as follows (Equation 13):
The combined weights thus obtained are as follows (Equation 14):
4.2 Evaluation model of expressway operation and maintenance toughness based on DBO-ELM
4.2.1 ELM model
Aiming at the problems of low operation efficiency and poor applicability of traditional evaluation methods, and the subjective and nonlinear characteristics of multi-index, multi-factor and evaluation results in high-speed toughness efficiency evaluation, an evaluation model of expressway operation and maintenance toughness efficiency based on extreme learning machine is proposed.
ELM has good generalization performance and extremely fast learning ability. Compared with the traditional neural network algorithm, the ELM does not need iteration or manual adjustment and only needs Moore–Penrose generalized inverse to calculate the weights. The basic structure of ELM significantly reduces the computational complexity and improves the operation speed such as shown in Figures 2–4. See Formula 15 for the evaluation model.
![Diagram of a neural network with input layer X, three hidden layers labeled \(a[1]\), \(a[2]\), \(a[3]\), and an output layer labeled \(a[4]\), connected by arrows. Inputs, hidden, and output layers are interconnected, demonstrating forward propagation.](https://www.frontiersin.org/files/Articles/1647241/fphy-13-1647241-HTML/image_m/fphy-13-1647241-g002.jpg)
Figure 2. ELM model structure diagram.
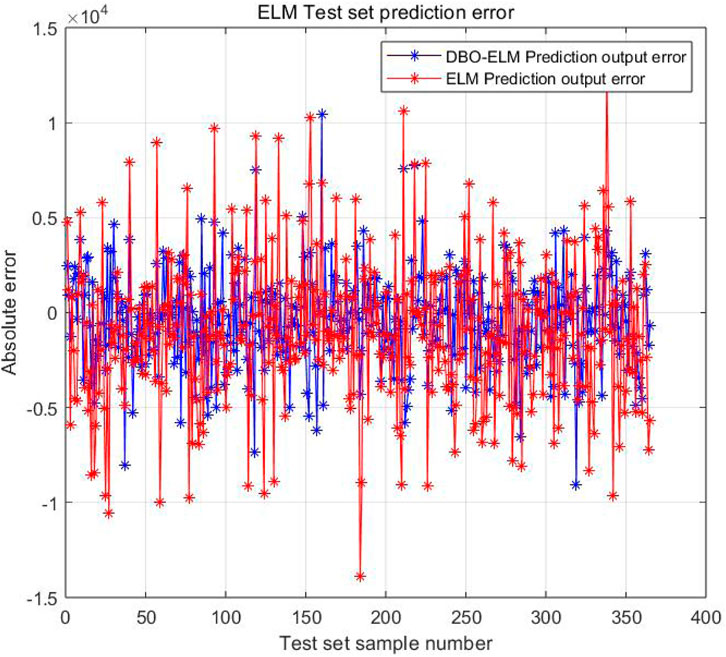
Figure 3. DBO-ELM algorithm flow chart.
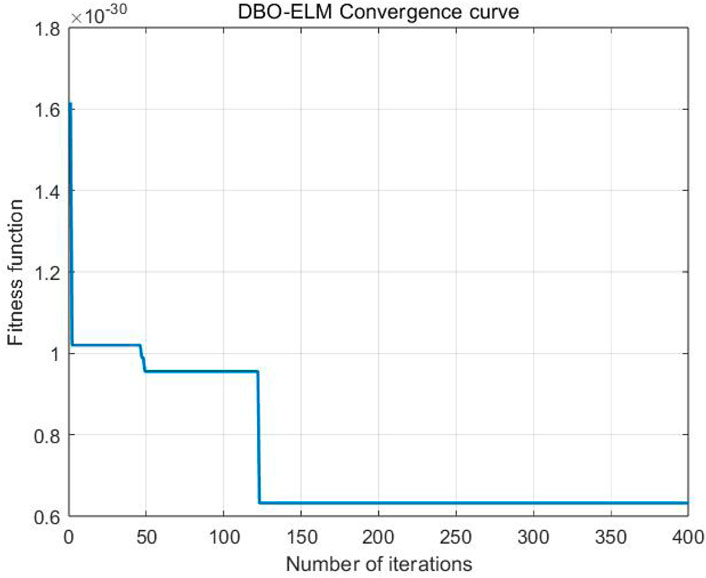
Figure 4. Iterative process.
Where fL is the model function; h(x) Is the response of the hidden layer about x; G(α1, b1, x): Is a hidden layer function; β is the least square solution of the minimum norm of the loss function.
4.2.2 Dung beetle optimization algorithm
The selection of ELM model parameters has a great influence on the accuracy of efficiency evaluation. Based on DBO, the hidden layer activation function, number of hidden layer neurons, and regularization coefficient of ELM are optimized by simulating dung beetle behaviors (such as rolling dung balls, breeding, foraging, and stealing) [60–62]. In order to improve the convergence accuracy of the algorithm and avoid local optimization problems, piecewise chaotic mapping is used to initialize the population and control the individual distribution. At the same time, the variable spiral search strategy is introduced to improve the breeding and foraging process and enhance the global search ability; Levy flight random walk is used to optimize the stealing behavior (Table 2), increase the disturbance of the solution, and enrich the population diversity [63–65]. The formula of the DBO optimization algorithm is (Equations 16–21).
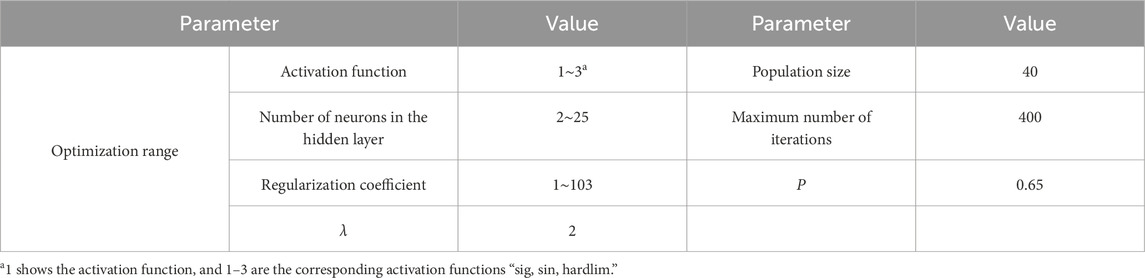
Table 2. Evaluationmodel training parameters.
4.2.2.1 Population initialization (piecewise chaotic mapping)
Chaotic sequence generation formula:
4.2.2.2 Behavior simulation of dung beetles
1. Rolling behavior (global search)
2. The individual pushes the dung ball in a straight line:
3. Reproductive behavior (local search)
4. Female dung beetles lay eggs in safe areas;
5. Variable spiral search strategy
6. Adaptive adjustment of the spiral path radius:
7. Theft (Levy flight disturbance)
8. Using Levy flight to enhance diversity;
Levy flight step generation (Equations 22, 23):
4.2.3 DBO-ELM model
The improved DBO algorithm is used to optimize the evaluation model of the extreme learning machine’s expressway operation and maintenance toughness, and a rapid evaluation model of expressway operation and maintenance toughness safety, applicability, durability, protection, green economy, and efficiency is constructed [66–71]. The algorithm flow of the DBO-ELM model is as follows Figure 5.
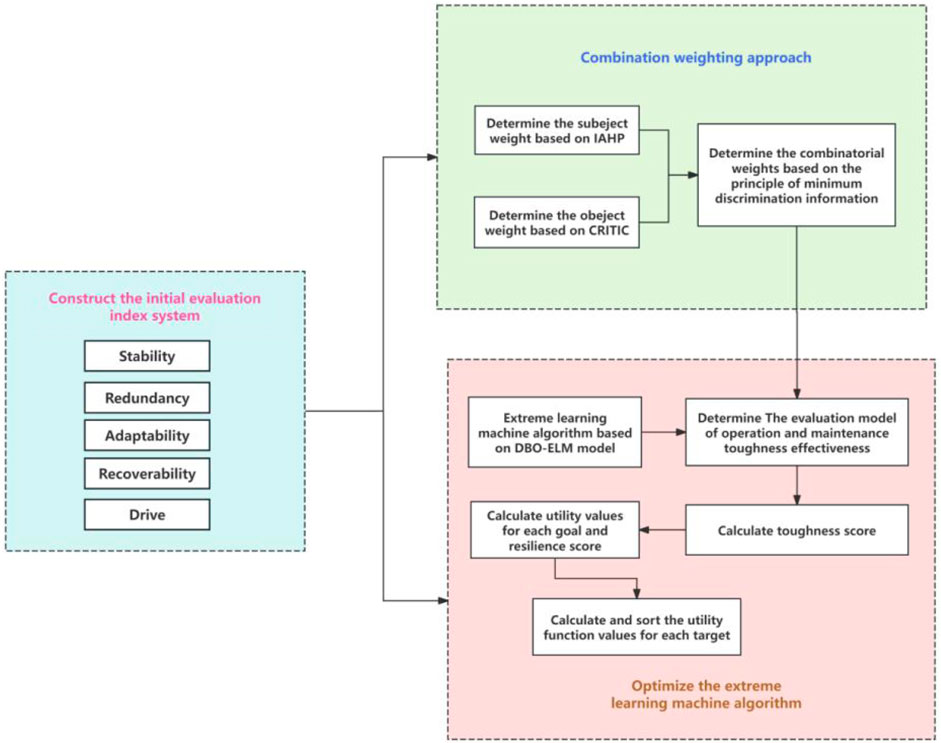
Figure 5. Comparison of model output errors.
5 Case analysis of expressway system operation and maintenance toughness measurement
5.1 Case overview
The case selects an accident-prone place in Changsha–Zhangjiajie (Changzhang Expressway) to evaluate the operation and maintenance resilience (Figure 6). As an important traffic trunk line in Hunan Province, this section carries a large number of passenger and cargo transportation tasks, and its operation and maintenance safety and toughness are of great significance to ensure smooth traffic and reduce the accident rate. The accident-prone area is located in a mountainous area of Chang–Zhang Expressway. Due to the complex terrain, changeable climatic conditions, and large traffic volume, traffic accidents occur frequently in this area, which poses a severe challenge to the operation and maintenance management of expressways. On 9 March 2025, a multi-vehicle rear-end collision occurred at K68 east of Yiyang Toll Station in the Changyi section of Changzhang Expressway, and one of the trucks rolled over, resulting in slow traffic and returning to normal at 12: 07 PM on the same day; on the evening of the same day, a multivehicle rear-end collision occurred in the west–east direction at K18 near Youren Toll Station, which triggered traffic control and resumed at 21: 40 PM. Frequent accidents and disasters in this section and the time lag of operation and maintenance recovery pose challenges to traffic operation. In order to comprehensively evaluate the operation and maintenance resilience of this accident-prone area, this paper adopts various data collection methods to understand the topography, climatic conditions, and traffic facilities of this section through on-site investigation. Through the analysis of historical accident data, we master the accident types, frequency, and reasons of this section; through expert interviews, professional opinions and suggestions on expressway operation and maintenance management were obtained.
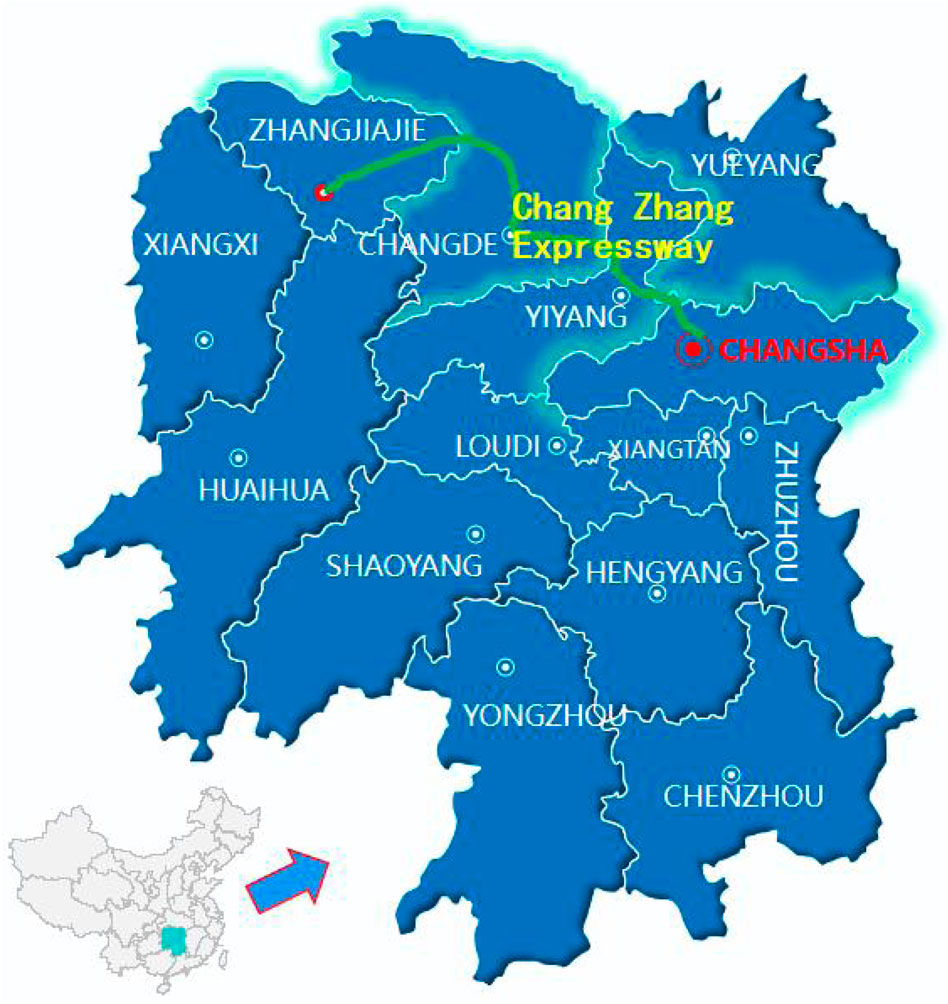
Figure 6. Chang–zhang expressway schematic diagram.
5.2 Expressway system operation and maintenance and safety and toughness measurement evaluation weight calculation
5.2.1 Index weight
Invite five experts and scholars who are familiar with expressway traffic operation and maintenance projects and have in-depth research on toughness theory, compare the identified operation and maintenance safety and toughness system sampling 1–9 scale method in the form of interval numbers, and give the judgment matrix Table 5. Take stability as an example to give the comparison result of the first expert:
Expert weight3
Calculate the weight of the consistency matrix, and combine the interval judgment matrix and the consistency matrix to obtain the range matrix at both ends. The consistency matrix and the range matrix at both ends are as follows, and the interval weight is refined by SPA method, the IAHP weight and CRITIC weight are obtained, and the comprehensive weight of combination weighting is determined according to the principle of minimum discriminant information as follows:
Stability: 1 (0.171, 0.183, 0.105, 0.120, 0.100, 0.132, 0.102, 0.087); redundancy: 2: (0.480, 0.104, 0.134, 0.179, 0.103).
5.3 Model evaluation
5.3.1 Source of indicator data
In this paper, the qualitative indicators are mainly eight indicators of the adaptability dimension. The questionnaire survey is used as a data collection method, and the data are collected by directional questionnaire to the actual dispatchers and commanders of the expressway. The measured data are obtained through on-the-spot investigation and monitoring, and the driving indicators are Statistical Yearbook data4, and the county data near the expressway are used instead.
5.3.2 Model parameter setting
Based on the model algorithm of expressway operation and maintenance toughness efficiency evaluation established in this paper, the model training parameters and sample database in Table 3 are input, and the sequential relationship of discrete index eigenvalues is eliminated by using single heat coding. And standardize the sample database to eliminate the dimensions of different indicators. See Tables 3, 4 for parameters of the expressway operation and maintenance toughness efficiency evaluation model.
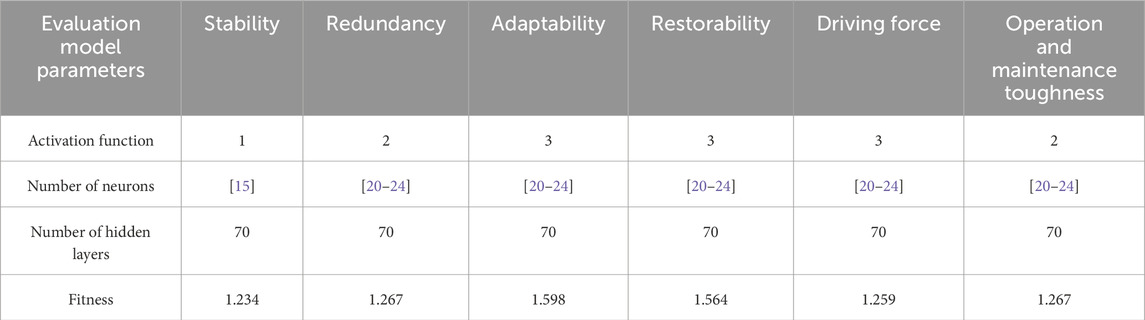
Table 3. Evaluation model parameters.
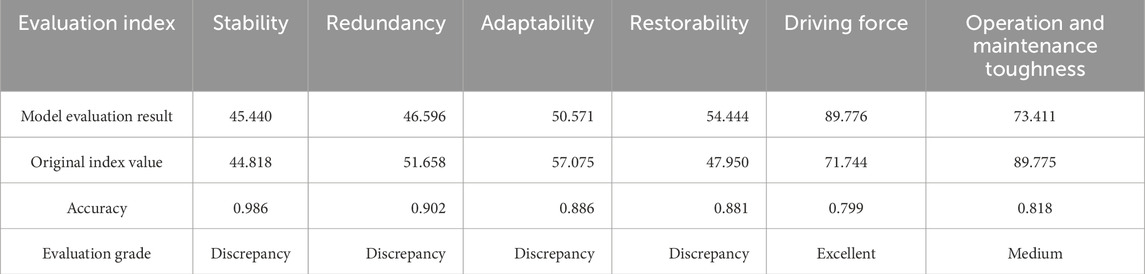
Table 4. Summary table of evaluation index results.
Type of hidden layer activation function (discrete variables are coded as integers); number of hidden layer neurons; regularization coefficient (Equations 24, 25). To minimize the mean square error (MSE):
5.3.3 Training process
Iterative training for 400 times, the fitness and iteration times of expressway operation and maintenance toughness efficiency evaluation model are as follows Figure 4. In the 125th generation, it tends to be stable, and the minimum fitness is 0.65.
5.3.4 Evaluation results
In this study, the safety and toughness of expressway operation and maintenance are quantitatively analyzed through the comprehensive evaluation model. The results in Table 5 show that (1) the overall operation and maintenance toughness (73.411) has been moderate, and there is room for improvement. (2) Among the indicators, the driving (89.776) evaluation result is excellent, while the adaptability, redundancy, and recoverability are in a poor evaluation level. Redundancy and recoverability become shortcomings in operation and maintenance, reflecting the shortage of emergency resource reserve (for example, the weight of per capita road area B5 is only 0.103) and accident response efficiency (the score of D6 indicator is low), which is different from the 12-h recovery time limit in the K68 section of Changsha–Zhangjiakou Expressway in 2024. The driving force is close to the excellent threshold, indicating that economic factors have a significant leverage effect on toughness improvement, and operation and maintenance management should be carried out according to local conditions.
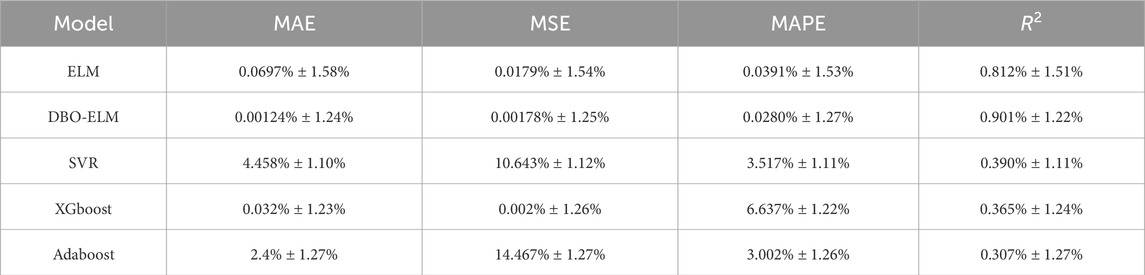
Table 5. Model performance comparison parameters Note: For fivefold cross validation, the model metrics are reported as mean ± standard deviation.
5.4 Model verification and performance comparison
5.4.1 Introduction of the comparison model
In order to verify the validity of the model, this paper selects the XGBOOST model, Adaboost model, and other models for comparative testing. The Adaboost model trains several weak classifiers (such as decision stumps) iteratively and adjusts the sample weights according to the previous round of classification errors so that subsequent classifiers pay more attention to difficult samples and finally integrates all weak classifiers to form a strong classifier. The XGBOOST model is based on the improved version of gradient lifting tree (GBDT), which supports the regularization term and parallel computation by minimizing the negative gradient direction of loss function.
5.4.2 Advantage and disadvantage indicators of the model
The goodness of fit refers to the fitting degree of the model algorithm to the observed values. The statistic to measure the goodness of fit is to determine the coefficient r, which belongs to the range of 0–1, and the greater the r, the better the degree of fit. The accuracy of the algorithm is measured by goodness of fit. By calculating the total sum of squares (SST), the regression sum of squares (SSR) and the residual sum of squares (SSE), the determination coefficient R2 is obtained, and the goodness of fit of each algorithm is calculated (Table 5).
5.4.3 Comparison of each model’s performance
By introducing the improved DBO, the model can optimize the key parameters of ELM, such as hidden layer activation function, number of hidden layer neurons, and regularization coefficient, thus further improving the efficiency and accuracy of operation (Figure 7). It can be seen that in practical application, the mean square error of the DBO-ELM model is greatly reduced compared with the traditional single ELM model, DBO-ELM improved R2 by 12.5% over ELM, showing excellent performance. Compared with XGboost, Adaboost, and SVR models, R2 is increased by 147%, 193%, and 131%, respectively. Therefore, the DBO-ELM model has strong evaluation adaptability and strong robustness.
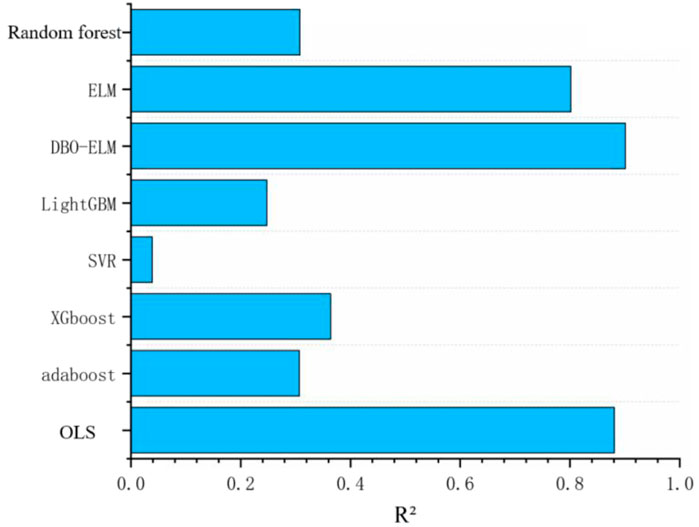
Figure 7. Comparison chart of model fitting goodness.
5.5 Results and discussion
In terms of model performance, DBO-ELM has obvious advantages compared with traditional ELM: the MSE is reduced by 89.7% (from 0.0179 to 0.00178, P = 0.01**), and the goodness of fit (R) is increased by 10.98 percentage points (from 0.802 to 0.901), which verifies the effectiveness of the improved dung beetle algorithm in parameter optimization (Table 4). In the comparative experiment, DBO-ELM is superior to XGBoost and Adaboost models in MAE (0.00124), MAPE (0.0280), and other indicators (Table 5 and Figure 8), indicating its advantages in dealing with high-noise and nonlinear data.
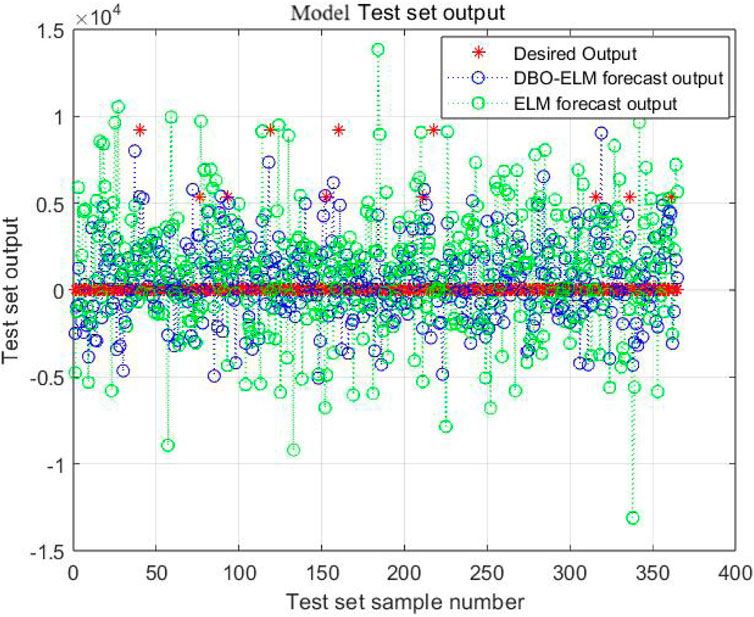
Figure 8. Model test set output.
6 Research conclusion and significance
6.1 Research conclusion
In this study, the comprehensive evaluation model of WFA-Critical-IAHP-DBO-ELM is constructed, and the operational safety and toughness of an accident-prone section of Chang–Zhang Expressway are systematically measured.
1. Construct the measurement system of expressway system operation and maintenance toughness. This study combines the five characteristics of toughness theory and uses the WFA method to identify the driving factors of safety and toughness of expressway system operation and maintenance. At the same time, considering the nonlinear mapping relationship between system classification and toughness characteristics, an evaluation system of expressway traffic project operation and maintenance toughness is established, aiming at measuring the safety and toughness of the expressway system in operation and maintenance stage and then improving the on-site safety of expressway traffic project operation and maintenance.
2. Establish the evaluation model of expressway system operation and maintenance toughness. In this study, the IAHP–Critical method is used to solve the fuzzy problem of the traditional interval analytic hierarchy process in calculating weights, which makes the evaluation results more accurate and reliable. The DBO-ELM is constructed for evaluation. The case analysis and model performance comparison prove that the DBO-ELM model has the advantages of high robustness and fitting performance and is suitable for processing complex operation and maintenance index data.
3. Example verification. Through the evaluation of a practical application case of an accident-prone area in Changsha–Zhangjiajie Expressway, the results show that the evaluation of the safety and toughness of Changzhang Expressway in terms of channel congestion and peak passenger flow indicates high toughness, while others are medium toughness. The feasibility and effectiveness of the evaluation model proposed in this paper are verified. The model can not only effectively shorten the accident recovery time and avoid the occurrence of secondary disasters but also reduce the occurrence of safety accidents in the operation and maintenance site, which is of great significance to improve the overall safety level of the expressway system.
This paper provides an “evaluation-diagnosis-optimization” solution for expressway toughness improvement, which has portability and repeatability, provides method selection for high-speed operation and maintenance, and provides engineering practice reference.
6.2 Research conclusion
This study provides key support for the deepening of the resilience assessment theory of transportation infrastructure. From the perspective of the application expansion of resilience theory, existing research mostly focuses on the structural performance of highways or single-disaster scenarios, often ignoring the impact of external economic drivers and multisystem collaboration on resilience. This study is based on the core connotation of resilience theory, innovatively incorporating the dimension of “driving force” into the evaluation framework, forming a five-dimensional evaluation system together with stability, redundancy, adaptability, and resilience. It reveals the inherent correlation between regional economic development and highway operation and maintenance resilience. Economic investment enhances the system’s anti-interference ability through facility updates, personnel training, and other paths. This dimension supplements the application of resilience theory in the transportation field to better fit the reality of economic and technological coordinated development and fills the theoretical gap of resilience theory in the transportation operation and maintenance field.
From the perspective of methodological innovation, existing evaluation methods suffer from subjective indicator selection, one-sided weight determination, and weak model generalization ability. Traditional indicator construction relies on expert experience and is prone to overlooking key factors; The single weighting method may lean toward objective data or subjective judgments, making it difficult to balance the scientific and practical aspects of evaluation; Traditional intelligent models (such as unoptimized ELM and random forest) have limited accuracy in handling high noise and nonlinear features of operation and maintenance data due to insufficient parameter random initialization or local search capabilities. The WFA-CRITIC-IAHP-DBO-ELM combination method proposed in this study extracts high-frequency indicators from literature, news, and policies through WFA, solving the problem of unfounded indicator screening; by integrating IAHP (subjective weighting) and CRITIC (objective weighting), the adaptability of expert experience to operation and maintenance scenarios and the information value of data itself are taken into account, avoiding the bias of single weighting; by using the DBO to optimize the parameters of ELM, the problem of weak generalization ability caused by random parameters in traditional ELM has been solved. This method system not only breaks through the application limitations of a single method but also provides a replicable methodological reference for the resilience assessment of similar complex systems such as railways and urban rail transit.
Data availability statement
The raw data supporting the conclusions of this article will be made available by the authors, without undue reservation.
Ethics statement
The studies involving humans were approved by Ethics Committee on Human Experimentation Hunan University of Finance and Economics. The studies were conducted in accordance with the local legislation and institutional requirements. The ethics committee/institutional review board waived the requirement of written informed consent for participation from the participants or the participants' legal guardians/next of kin because we explained the purpose, process, risks, and benefits of the study to all participants orally and obtained their informed consent. Participants have the right to know that their participation is voluntary and can withdraw from the study at any time. The reason why the oral form is adopted is that more participants are involved and the oral form is more convenient. At the same time, this has been supported by the ethics committee of Hunan Institute of Finance and economics.
Author contributions
SZ: Conceptualization, Formal Analysis, Validation, Visualization, Writing – original draft, Writing – review and editing. JY: Data curation, Methodology, Supervision, Software, Writing – original draft, Writing – review and editing. HD: Data curation, Methodology, Writing – original draft, Writing – review and editing. XH: Writing – original draft, Writing – review and editing. RX: Writing – original draft, Writing – review and editing. XL: Writing – original draft, Writing – review and editing. MG: Data curation, Methodology, Writing – original draft, Writing – review and editing.
Funding
The author(s) declare that financial support was received for the research and/or publication of this article. National College Students’ Innovation and Entrepreneurship Training Program (S202411532005). Key Fund Project of Hunan Provincial Department of Education: “Study on Dynamic Evolution Mechanism of Train-Track-Subgrade in intensive Transition Sections” (23A0678).
Conflict of interest
The authors declare that the research was conducted in the absence of any commercial or financial relationships that could be construed as a potential conflict of interest.
Generative AI statement
The author(s) declare that no Generative AI was used in the creation of this manuscript.
Any alternative text (alt text) provided alongside figures in this article has been generated by Frontiers with the support of artificial intelligence and reasonable efforts have been made to ensure accuracy, including review by the authors wherever possible. If you identify any issues, please contact us.
Publisher’s note
All claims expressed in this article are solely those of the authors and do not necessarily represent those of their affiliated organizations, or those of the publisher, the editors and the reviewers. Any product that may be evaluated in this article, or claim that may be made by its manufacturer, is not guaranteed or endorsed by the publisher.
Footnotes
1In 2024, the main development goals of steady economic operation were successfully achieved, National Bureau of Statistics, [ol], https://www.stats.gov.cn/SJ/zxfb/202501/T20250117_1958332.html [2025-4-10]
2The State Council Information Office’s “Achievements of High-quality Economic Development in China” series of press conferences: introducing the high-quality development of transportation service economy, China Government Network., https://www.gov.cn/lianbo/fabu/202412/content_6994943.htm
3After quantifying the qualifications of experts using the Likert scale, weight allocation is carried out based on the comprehensive evaluation of the total score of comprehensive qualifications
4Hunan Statistical Yearbook 2024,https://tjj.hunan.gov.cn/hntj/tjfx/hntjnj/hntjnjwlb/202503/t20250331_33627676.html
References
1. Lin P, Liu Z. Yan mingyueStudy on the toughness of expressway network based on multivariate weighted center characteristics. J Chongqing Jiaotong Univ (Natural Sci Edition) (2023) 42(10).
2. Xiumei W, Xiang Y, Cai W. Evaluation method of safety and toughness of expressway bridge engineering based on entropy weight-improved TOPSIS method. Traffic Inf Saf (2024) 42(03).
3. Zhang X, Zhang N, Chao Z, Yu H, Xiaopeng D. Identification of influencing variables on improving resilience of high-speed railway system. SystemJournal Adv Transportation (2022) 2022(Issue):1–15. doi:10.1155/2022/3013243
4. Han F, Zhang S. Evaluation of spatial resilience of highway networks in response to adverse weather conditions. ISPRS Int J Geo-Information (2020) 9:480. doi:10.3390/ijgi9080480
5. Chen J, Liang C, Liu J, Du B, Yin Y, Peng Q. Resilience assessment of a highway–railway complementary network under rainstorms. Transportation Res D: transport Environ (2023) 121:103841. doi:10.1016/j.trd.2023.103841
6. Zhou Y, Wang J, Yang H. Resilience of transportation systems: concepts and comprehensive review. IEEE Trans Intell Transportation Syst (2019) 20(12):4262–76. doi:10.1109/tits.2018.2883766
7. Alderson DL, Brown GG, Matthew Carlyle W, Kevin Wood R. Assessing and improving the operational resilience of a large highway infrastructure system to worst-case losses. Transportation Sci (2017) 4.
8. Hou G, Wang J, Fan Y, Zhang J, Huang C. A novel wind power deterministic and interval prediction framework based on the critic weight method, improved northern goshawk optimization, and kernel density estimation. Renew Energ (2024) 226:120360. doi:10.1016/j.renene.2024.120360
9. Wang HW, Peng ZR, Wang D, Meng Y, Wu T, Sun W, et al. Evaluation and prediction of transportation resilience under extreme weather events: a diffusion graph convolutional approach. Transportation Res C: emerging Tech (2020) 115:102619. doi:10.1016/j.trc.2020.102619
10. Dey KC, Mishra A, Chowdhury M. Potential of intelligent transportation systems in mitigating adverse weather impacts on road mobility: a review. IEEE Trans Intell Transportation Syst (2014) 16(3):1107–19. doi:10.1109/tits.2014.2371455
11. Argyroudis SA, Mitoulis SΑ, Winter MG, Kaynia AM. Fragility of transport assets exposed to multiple hazards: state-of-the-art review toward infrastructural resilience. Reliability Eng and Syst Saf (2019) 191:106567. doi:10.1016/j.ress.2019.106567
12. Kim KS, Hwang K. An application of road pricing schemes to urban expressways in Seoul. Cities (2005) 22(1):43–53. doi:10.1016/j.cities.2004.10.005
13. Yuan D, Wang zhiR, Lian W. Zhang JiansheEvaluation of application maturity of intelligent construction based on combination weighting-cloud model. Sci Technol Eng (2024) 24(19).
14. Gao Y, Wang J, Gao J, Kongyang J, Liu Y. GaoliEvaluation method of urban flood disaster resilience based on combined weighting-cloud model. Prog Water conservancy hydropower Sci Technol (2024) 44:2.
15. Jie L, Liu Q, Zhang X, Yuanyuan W, Zhang J. Evaluation of traffic resilience of expressway network based on combined weighting-cloud model. J Hunan Univ (Natural Sci Edition) (2023) 50(11).
16. Xu P, Lu Q, Jing L, Wang S, Ren Y. Analysis of congestion characteristics of expressway network from the perspective of resilience. China J Highw transport (2024) 37(10).
17. Guo J, Zhang Z, Sun Q. Research and application of analytic hierarchy process. China Saf Sci J (2008)(05) 148–53. doi:10.16265/j.cnki.issn1003-3033.2008.05.018
18. Huang Y, Qin G, Yang M, Nogal M. Dynamic quantitative assessment of service resilience for long-distance energy pipelines under corrosion. Reliability Eng Syst Saf (2025) 256:256110792–2. doi:10.1016/j.ress.2024.110792
19. Liu W, Chen L, Luo F, Zhao Y, Li X, Zeng X. Novel assessment of China's cobalt supply chain resilience based on DPSIR model and machine learning. Resour Conservation and Recycling (2025) 215:215108107–7. doi:10.1016/j.resconrec.2024.108107
20. Shouchuang Z, Lanyue Z, Jiayi W, Yang Y, Chen Z, Jian W. PP23 machine-learning-based evaluation of community resilience through social media during the first post-COVID-19 reopening in China. Int J Technol Assess Health Care (2025) 40(S1):S63. doi:10.1017/s026646232400196x
21. Chen X, Lv X, Tiejie X Study on the inversion of slope creep parameters by improved kernel limit learning machine. J Civil Eng (2025) 1-10. doi:10.15951/j.tmgcxb.20011.10000001616
22. Luan X, Tang J, Yundong S. Fault diagnosis method for intermediate bearing of depth limit learning machine based on dung beetle algorithm. Vibration and shock (2024) 43(21):96–106+127. doi:10.13465/j.cnki.jvs.2024
23. Chen J, Liu X, Pengcheng Z. Study on prediction method of reactor neutron flux and keff based on optimized extreme learning machine model. Nucl Technol (2024) 47(10):181–90.
24. Sun S, Wu Y, Jiang H. Nonlinear decoupling of FBG three-dimensional vibration acceleration sensor based on WOA-ELM. Chin J scientific instrument (2024) 45(07):139–47. doi:10.19650/j.cnki.cjsi.j2412783
25. Ding P, Fei ZH, Lin Y. Product quality prediction method based on multi-hidden extreme learning machine. Computer integrated manufacturing Syst (2025) 1–21. Available online at: http://kns.cnki.net/kcms/detail/11.5946.tp (Accessed April 02, 2025).
26. Sun S, Pang K, Yu J. Nonlinear decoupling of three-dimensional force sensor based on white shark optimization extreme learning machine. Opt Precision Eng (2023) 31(18):2664–74.
27. Yang X, Hu S, Zhang M. Overview of the development of intelligent expressway traffic application technology. china J Highw transport (2023) 36(10):142–64. doi:10.19721/j.cnki.1001-7372.2023.10.013
28. Zhi-Chao Z, Yi-Kun SU. Overview of expressway intelligent construction technology. Sci Technol Eng (2022) 22(13):5106–15.
29. Zhu S, Cai J, Xiong R, Zheng L, Ma D. Singular pooling: a spectral pooling paradigm for second-trimester prenatal level II ultrasound standard fetal plane identification. IEEE Trans Circuits Syst Video Technol (2025) 1. doi:10.1109/tcsvt.2025.3588395
30. Cai J, Li Y, Liu B, Wu Z, Zhu S, Chen Q, et al. Developing deep LSTMs with later temporal attention for predicting COVID-19 severity, clinical outcome, and antibody level by screening serological indicators over time. IEEE J Biomed Health Inform (2024) 28(7):4204–15. doi:10.1109/jbhi.2024.3384333
31. Zhao S, Li Z, Deng H, You X, Tong J, Yuan B, et al. Spatial-temporal evolution characteristics and driving factors of carbon emission prediction in China-research on ARIMA-BP neural network algorithm. Front Environ Sci (2024) 12:1497941. doi:10.3389/fenvs.2024.1497941
32. Guo Y, Chen B, Zeng H, Qing G, Guo B. Research on wear state identification of ordered grinding wheel for c/sic composites based on dbo-elm. Wear (2024) 556:205529. doi:10.1016/j.wear.2024.205529
33. Yan H, Ninghai XY. Evaluation of urban rail transit project operation and maintenance toughness based on Delphi-IAHP-SPA-GCM. J Railway Sci Eng (2025) 1-11. doi:10.19713/j.cnki.43
34. Yang T, Xing W, Cheng S, Wang Z. Precise interception flight targets by image-based visual servoing of multicopter. Syst Eng Electron (2025) 1–11. doi:10.1109/tie.2025.3559951
35. Hu T, Liu H, Chen T. Toughness evaluation of ship power system based on IAHP-CRITIC two-dimensional cloud model. Syst Eng Electron (2025) 1-15. Available online at: http://kns.cnki.net/kcms/detail/11.2422.tn (Accessed January 15, 2025).
36. Zhang C, Liu T, Bai G, Tao J, Zhu W. A dynamic resilience evaluation method for cross-domain swarms in confrontation. Reliability Eng and Syst Saf (2024) 244:109904. doi:10.1016/j.ress.2023.109904
37. Diakoulaki D, Mavrotas G, Papayannakis L. Determining objective weights in multiple criteria problems: the critic method. Comput and Operations Res (1995) 22(7):763–70. doi:10.1016/0305-0548(94)00059-h
38. Cox A, Prager F, Rose A. Transportation security and the role of resilience: a foundation for operational metrics. Transport policy (2011) 18(2):307–17. doi:10.1016/j.tranpol.2010.09.004
39. Mishra DK, Eskandari M, Abbasi MH, Sanjeevikumar P, Zhang J, Li L. A detailed review of power system resilience enhancement pillars. Electric Power Syst Res (2024) 230:110223. doi:10.1016/j.epsr.2024.110223
40. Hou J, Hu C, Lei S, Hou Y. Cyber resilience of power electronics-enabled power systems: a review. Renew Sustain Energ Rev (2024) 189:114036. doi:10.1016/j.rser.2023.114036
41. Wang Z, Chen PTL. Brain-inspired chaotic spiking backpropagation. Natl Sci Rev (2024) 11(06):169–79.
42. Shi L, Yang Y, Zhai D, Peng L. Rapid detection of food quality indicators using ELM and near-infrared spectroscopy. Spectrochimica Acta A, Mol Biomol Spectrosc (2025) 345:126766. doi:10.1016/j.saa.2025.126766
43. Chen X, Mu J, Shang Z, Gao X. The prediction of civil building energy consumption using a hybrid model combining wavelet transform with SVR and ELM: a case study of jiangsu Province. Mathematics (2025) 13(14):2293. doi:10.3390/math13142293
44. Ouafa B, Ahmed R, Aizi K, Abdelouahed L, Laidi M, Abdelhafid T, et al. Prediction of barite scale formation and inhibition in hydrocarbon reservoirs using AI modeling: focus on different optimization algorithms. Results Eng (2025) 26:105222. doi:10.1016/j.rineng.2025.105222
45. Liang J, lv Q, Wang Z, Hu Y, Xue H, Wang B, et al. A Novel hybrid Multi-Objective optimization framework based on ELM-NSGA-II-TOPSIS: case study of rare earth electrolytic cell. Chem Eng Sci (2025) 312:121669. doi:10.1016/j.ces.2025.121669
46. Ge D, Jin G, Wang J, Zhang Z. A novel BA-ABC-ELM model for estimating state of health of lithium-ion batteries. Energ Rep (2025) 13:465–76. doi:10.1016/j.egyr.2024.12.036
47. Tang W, Ma C, Zhou S, Zhang S, Wang Q, Wu K, et al. Key parameters prediction of shale reservoir based on deep-learning model: a case study of Jurassic Da’anzhai member in Sichuan Basin. J Earth Sci (2025) 1–48.
48. Song G, Shengbo T, Lang Z, Lianfeng G, Zhai X. Elite-sharing and rank-based learning particle swarm optimizer for complex numerical optimization. The J China Universities Posts Telecommunications (2025) 1–14. doi:10.19682/j.cnki.1005-8885.2025.0023
49. Yildiz SS. Spatial multi-criteria decision making approach for wind farm site selection: a case study in Balıkesir, Turkey. Renew Sustain Energ Rev (2024) 192:114158. doi:10.1016/j.rser.2023.114158
50. Assarkhaniki Z, Rajabifard A, Sabri S. The conceptualisation of resilience dimensions and comprehensive quantification of the associated indicators: a systematic approach. Int J Disaster Risk Reduction (2020) 51:101840. doi:10.1016/j.ijdrr.2020.101840
51. Yang CC, Hsu WL. Evaluating the impact of security management practices on resilience capability in maritime firms—a relational perspective. Transportation Res A: Pol Pract (2018) 110:220–33. doi:10.1016/j.tra.2017.06.005
52. Brysbaert M, Mandera P, Keuleers E. The word frequency effect in word processing: an updated review. Curr Dir Psychol Sci (2018) 27(1):45–50. doi:10.1177/0963721417727521
53. Petrova M, Sutcliffe P, Fulford KWM, Dale J. Search terms and a validated brief search filter to retrieve publications on health-related values in Medline: a word frequency analysis study. J Am Med Inform Assoc (2012) 19(3):479–88. doi:10.1136/amiajnl-2011-000243
54. Piantadosi ST. Zipf’s word frequency law in natural language: a critical review and future directions. Psychon Bull and Rev (2014) 21:1112–30. doi:10.3758/s13423-014-0585-6
55. Brysbaert M, Diependaele K. Dealing with zero word frequencies: a review of the existing rules of thumb and a suggestion for an evidence-based choice. Behav Res Methods (2013) 45:422–30. doi:10.3758/s13428-012-0270-5
56. Zhang J, Xia L, Xu L, Research on comprehensive evaluation technology of photovoltaic power generation unit based on minimum discriminant information combination weighting method. J Power Supply (2025) 1-12. Available online at: http://kns.cnki.net/kcms/detail/12.1420.tm (Accessed January 15, 2025).
57. Jain P, Rogers JW, Pasman JH, Keim KK, Mannan MS. A resilience-based integrated process systems hazard analysis (RIPSHA) approach: Part I plant system layer. Process Saf Environ Prot (2018) 116:11692–105. doi:10.1016/j.psep.2018.01.016
58. Tulio BNMDF, Andre B. Maintenance, monitoring, safety, risk and resilience of bridges and bridge networks. Boca Raton, FL, United States: Taylor and Francis; CRC Press (2016). p. 11–7. doi:10.1201/9781315207681
59. Nathanael D, Tsagkas V, Marmaras N. Trade-offs among factors shaping operators decision-making: the case of aircraft maintenance technicians. Cogn Technol and Work (2016) 18(4):807–20. doi:10.1007/s10111-016-0393-z
60. Liu Y, Zhang X, Liu J, Wang Y, Jia H, Tao S. A flood resilience assessment method of green-grey-blue coupled urban drainage system considering backwater effects. Ecol Indicators (2025) 170:170113032–2. doi:10.1016/j.ecolind.2024.113032
61. Hou Z, You T, Wang W. Seismic resilience assessment-informed UAV task allocation framework for post-earthquake survey. Int J Disaster Risk Reduction (2025) 116:116105160–0. doi:10.1016/j.ijdrr.2024.105160
62. Liang Y, Cheng Y, Ren F, Du Q. Urban resilience assessment framework and spatiotemporal dynamics in Hubei, China. Scientific Rep (2024) 14(1):31391. doi:10.1038/s41598-024-82895-6
63. Deb A, Sultana H. Urban resilience: assessment of performance and science mapping from a climate change perspective. Sustain Environ (2024) 10(1):2388936. doi:10.1080/27658511.2024.2388936
64. Malshani NP, Yingbin F, Kerry L, Framework for measuring resilience of safety management systems in Australian building repair and maintenance companies. J Saf Res (2023) 85405–418.
65. Casas RJ, Frangopol MD, Turmo J. Bridge safety, maintenance, management, life-cycle, resilience and sustainability. In: Proceedings of the eleventh international conference on bridge maintenance, safety and management (IABMAS 2022). Barcelona, Spain: CRC Press (2022).
66. Zhijun L, Xiang J, Tao S, Evaluation of anti-jamming effectiveness of TOPSIS radar based on G1-coefficient of variation -KL. J Beihang Univ (2021) 47(12):2571–8. doi:10.13700/J.BH.1001-5965.2001
67. Aghaeidoost V, Billah MMHA. Life-cycle seismic resilience assessment of isolated bridges equipped with different isolation systems. Struct Infrastructure Eng (2025) 21(2):185–207. doi:10.1080/15732479.2023.2199402
68. Hu J, Wen W, Zhai C, Pei S. Surrogate-based decision-making for post-earthquake recovery scheduling and resilience assessment of subway systems considering the effect of in frastructure interdependency. Reliability Eng Syst Saf (2025) 256:256110781–1. doi:10.1016/j.ress.2024.110781
69. Malshani NP, Yingbin F, Kerry L, Developing resilience for safety management systems in building repair and maintenance: a conceptual model. Saf Sci (2022) 152.
70. Tsagkas V, Nathanael D, Marmaras N. A pragmatic mapping of factors behind deviating acts in aircraft maintenance. Reliability Eng Syst Saf (2014) 130:130106–14. doi:10.1016/j.ress.2014.05.011
Keywords: expressway, operational resilience, DBO-ELM model, interval hierarchy, combination empowerment, word frequency analysis
Citation: Zhao S, Ye J, Deng H, Huang X, Xie R, Long X and Gustaf M (2025) Research on evaluation of expressway system operation and maintenance resilience based on DBO-ELM model. Front. Phys. 13:1647241. doi: 10.3389/fphy.2025.1647241
Received: 15 June 2025; Accepted: 01 September 2025;
Published: 10 October 2025.
Edited by:
Khursheed Alam, Sharda University, IndiaReviewed by:
Abraão Nascimento, Federal University of Pernambuco, BrazilSyahrul Fithry Senin, Universiti Teknologi Teknologi MARA, Cawangan Pulau Pinang, Malaysia
Copyright © 2025 Zhao, Ye, Deng, Huang, Xie, Long and Gustaf. This is an open-access article distributed under the terms of the Creative Commons Attribution License (CC BY). The use, distribution or reproduction in other forums is permitted, provided the original author(s) and the copyright owner(s) are credited and that the original publication in this journal is cited, in accordance with accepted academic practice. No use, distribution or reproduction is permitted which does not comply with these terms.
*Correspondence: Måns Gustaf, Z3VzdGFmZWR1QHllYWgubmV0