 Ammar Armghan1
 Meshari Alsharari1
 Khaled Aliqab1*
 Ibrahim Alrashdi2
 Benish Kanwal3
 Jawad Mirza4,5
 Imran Aziz3,6*
- 1Department of Electrical Engineering, College of Engineering, Jouf University, Sakaka, Saudi Arabia
- 2Department of Computer Science, College of Computer and Information Sciences, Jouf University, Sakaka, Saudi Arabia
- 3Electrical Engineering Department, Mirpur University of Science and Technology, Mirpur (AJK), Pakistan
- 4Electrical Engineering Department, HITEC University Taxila, Taxila, Pakistan
- 5SEECS photonics research group, Islamabad, Pakistan
- 6Department of Physics and Astronomy, Uppsala University, Uppsala, Sweden
Underwater wireless optical sensor networks require high-speed, long-range, and scalable underwater wireless optical communication/ultra-wideband hybrid links to enable real-time data transmission and reliable communication between sensors and surface stations. Such hybrid links can provide seamless connectivity, adaptability to changing underwater environments, and support for various applications including ocean exploration, monitoring, and surveillance. We report an underwater wireless optical communication/ultra-wideband converged transmission link for
1 Introduction
Earth is a water planet having over 70% of its surface area covered by water, yet 95% of the sea remains unexplored [1]. Growing population demands are depleting the land resources through unsustainable practices like deforestation and industrialization [1, 2]. As land resources become inadequate to meet the demands of rapidly growing population, oceans are emerging as vital alternatives for food, energy, and resources [3]. The UN’s 2030 Sustainable Development Goals (SDGs) include SDG-14 which is about“Conserve and sustainably use the oceans and marine resources” [4]. Oceans regulate climate, support biodiversity, and sustain livelihoods but face threats from pollution, overfishing, and climate change. SDG-14 aims to reduce marine pollution, protect ecosystems, regulate fishing, and promote sustainable marine industries through research and international cooperation [4]. The gradual expansion of human activities in oceans, including marine surveys, oceanographic research, offshore oil exploration, underwater oil pipeline monitoring, and tactical surveillance is driving the demand for high-speed underwater communications [5]. Therefore, underwater wireless sensor networks (UWSNs) have attained significant consideration in recent past owing to its potential applications in the challenging area of ocean exploration [6]. Conventionally, underwater acoustic communications (UAC) is widely used to achieve fairly long communication range but extremely low data rates and large communication delays are the main limitations [7]. On the other hand, underwater radio frequency (RF) communication can achieve high data rates and small communication delays at the expense of short range [8]. Keeping in view the pros and cons related with both conventional communication techniques for underwater wireless communication, underwater wireless optical communication (UWOC) has been gaining huge attention in recent years due to its significant advantages, such as high data rates up to Gb/s, low communication delay, low power consumption, and small carbon footprint [7, 8]. These unique characteristics of UWOC play a significant supplementary role in fulfilling the requirements of UWSNs.
The underwater wireless optical communication/single-mode fiber/free space optics (UWOC/SMF/FSO) based hybrid links face a significant challenge due to the different attenuation coefficients of water, fiber, and free space. As each technology operates at distinct wavelengths, the power budget reduces substantially [1]. UWOC operates at visible wavelengths and is affected by water absorption and scattering, while SMF and FSO operate at infrared wavelengths and are affected by fiber and atmospheric attenuation, respectively [1]. A recently proposed solution involved utilizing a photo-detection, remodulation, and forwarding (PRF) relay to perform wavelength translation from visible to infrared at the water-fiber-air interface [1]. However, the main limitation of this approach is increased system cost and complexity due to employment of relays for wavelength translation. An optimal solution is the implementation of an underwater wireless optical communication/ultra-wideband (UWOC/UWB) hybrid system, leveraging the advantages of both technologies to achieve high-speed data transmission for diverse applications including UWSNs. UWOC provides high-speed data transmission in underwater environment, while UWB wireless technology provides reliable and long-range communication through the air or water. The UWOC/UWB hybrid system can operate at a single wavelength, reducing the complexity and power budget issues associated with the UWOC/SMF/FSO hybrid links.
1.1 Related work
Underwater wireless optical communication/radio frequency (UWOC/RF) hybrid links have been extensively explored in the literature, particularly in the context of relay-assisted visible light communication (VLC)/RF link [2], co-operative relaying based UWOC/RF link [9], reconfigurable intelligent surface (RIS) based dual-hop mixed UWOC/RF system [10], RIS enabled UWOC/RF converged link for Internet of underwater Things (IoUT) and terrestrial data centers [11], dual-hop FSO/UWOC/RF hybrid link [12], amplify and forward (AF) relay assisted UWOC/RF mixed transmission system [13], mixed RF/UWOC link without any relay node [14], triple-hop UWOC/FSO/RF mixed link [15], space-division multiplexing (SDM) aided FSO/UWOC hybrid link [16], spatial light modulator (SLM)-based beam-tracking scheme using FSO/HCF/UWOC hybrid link [17], polarization division multiplexing (PDM) based FSO/UWOC convergent link [18], dual-hop mixed UWOC/RF system based on AF relaying [19], unmanned aerial vehicle (UAV) aided dual-hop mixed UWOC/RF system [20], dual-hop UWOC/RF transmission system [21], mixed UWOC/RF link employing a fixed-gain AF relay [22], mixed UWOC/RF link based on UAV as a low-altitude mobile aerial base station transmitting data to an autonomous underwater vehicle (AUV) through a fixed gain AF or decode and forward (DF) relay [23], two hop mixed UWOC/RF link based on DF relay [24], and an uplink hybrid UWOC/RF space-ocean system based on a floating relay [25]. Table 1 further elaborates the literature review and compares the main accomplishments with the proposed work.

Table 1. Detailed analysis of literature and comparison of key parameters with the proposed scheme.
It is clear from detailed literature survey that mixed UWOC/UWB link has not been proposed earlier for the implementation of the high-speed and flexible underwater wireless optical sensor networks (UWOSNs). We propose for the first time a converged UWOC/UWB link for the implementation of
Based on above details, the main achievements of this research are as under:
This work is simulated using OptiSystem 22 software developed by Optiwave Inc [1, 26]. Section 2 provides a theoretical overview of UWOC technology along with the system and channel model, Section 3 presents the proposed architecture, Section 4 describes the simulation results, and lastly, Section 5 concludes the paper.
1.2 Deployment scenario of the proposed transmission link
Figure 1 shows an overview of the application scenario of UWOC/UWB integrated network architecture supporting high-speed data transmission among different sensors and surface stations for a variety of applications, such as ocean exploration, ocean monitoring, marine life protection, marine defence systems, and underwater research. The underwater sensors collect data and transmit it over UWOC links towards FOBS where multiple UWB wireless signals tuned at different frequencies are generated in optical domain. Multiple UWB wireless signals tuned at different frequencies are received by the respective mobile stations (MSs), thus enabling an UWOSN for high-speed and long-range data transmission between sensors and surface stations.

Figure 1. Application scenario of the proposed architecture; UWOC, Underwater wireless optical communication link; UWB, Ultra-wideband; AUV, Autonmous underwater vehicle; FSO, Free space optical link; FOBS, Floating optical base station.
1.3 UWB wireless technology
UWB radio technology has emerged as a promising solution for short-range, high-data rate wireless communications and wireless sensor networks. Its key benefits include: low power consumption, low transmit power spectral density (PSD), immunity to multipath fading, enhanced penetration through obstacles, and seamless coexistence with conventional wireless communication systems [27, 28]. These advantages make UWB an attractive technology for various applications. U.S. Federal Communications Commission (FCC) in 2002 authorized the unlicensed use of the UWB spectrum within the 3.1–10.6 GHz range, imposing a PSD limit of −41.3 dBm/MHz [27, 28]. Therefore, according to FCC’s definition, UWB signals have to fulfill three conditions called UWB spectral mask, i.e., (I) Bandwidth exceeding 500 MHz or a fractional bandwidth greater than 20%, (II) Equivalent isotropic radiated power (EIRP)
UWB technology has been globally regulated in the 60 GHz band, with varying frequency allocations across different regions. Specifically, the allocated frequencies range from 57 to 64 GHz in Canada and the U.S., 57–66 GHz in Australia and Europe, and 59–66 GHz in Japan and Korea [30]. 60 GHz band offers a unique advantage in mitigating coexistence issues with other wireless communication systems, such as IEEE 802.11 at 5 GHz and IEEE 802.16 at 3.5 GHz, while providing a remarkably high bandwidth of 7.5 GHz [30]. Furthermore, 60 GHz UWB technology has advanced to the point where it can be integrated into a single chip, making it suitable for handheld devices [30]. Moreover, the mean EIRP in the 60 GHz band can be increased from −41.3 dBm/MHz, as currently regulated, to 13 dBm/MHz [30]. This significant boost in transmission power can extend the UWB transmission range, assuming that free-space path loss is adequately minimized [30].
UWB technology is accessible in two primary variants: multi-band orthogonal frequency division multiplexing (MB-OFDM) and impulse radio UWB (IR-UWB) [31]. MB-OFDM enables optimal utilization of spectrum, supporting a data rate of 480 Mb/s per 528 MHz band [30]. FCC defines the MB-OFDM spectrum, slicing the 3.1–10.6 GHz range into 14 bands, each with a bandwidth of 528 MHz [30]. Each band serves as a carrier frequency for an OFDM baseband signal and is further subdivided into 128 orthogonal subcarriers. Of these, 122 are utilized for data transmission, while six are designated as null subcarriers to minimize interference [30, 31]. On the other hand, IR-UWB employs ultra-short pulses, typically in the picosecond range simultaneously supporting communication and localization [32]. IR-UWB pulses can be modulated in amplitude, position, or shape. Therefore, Gaussian monocycle, duplet, and triplet pulses are commonly used to implement different modulation schemes in IR-UWB systems which are generated by taking
A major challenge in UWB systems is generating the UWB pulses compliant with FCC spectral mask. Several methods based upon electronic techniques for UWB pulse generation have been proposed [27]. Recently, generation of UWB pulses in the optical domain has gained significant attention. All-optical approaches offer greater flexibility, tunability, vast bandwidth, and better occupancy of spectrum as specified by FCC. Several methods for all-optical UWB pulse generation have been proposed and demonstrated recently [33]. Among these methods, ODL technique is considered one of the simplest and most efficient which is being used for generating UWB pulses in this work.
2 UWOC system and channel model
Channel modeling is a critical step in optical wireless communication (OWC) which helps the system designers to estimate various OWC channel’s impairments that directly affect the signal quality, such as intensity scintillation and attenuation. Additionally, efficient channel modeling supports network planners to optimize different performance metrics such as BER, quality factor (Q-factor), power budget, throughput, and latency. There are different channel models proposed to estimate the turbulence and attenuation of an OWC link, such as the Log-normal, K-distribution, Negative-exponential, Gamma-Gamma, and most recently proposed Malaga model [28]. The Log-normal is applicable only to weak turbulence conditions while strong turbulence conditions are characterized using K-distribution and the Negative-exponential model [28]. The Gamma-Gamma channel model is a versatile model that can efficiently be used to characterize any turbulence from weak to strong [28]. This channel model is employed in this work to evaluate the sensors’ performance over a wide range of oceanic turbulence including bubble-induced turbulence.
The total received power in a line-of-sight UWOC system can be mathematically formulated as [1, 34].
In Equation 1,
In Equation 2, c

Table 2. Optical properties of different water bodies at 532 nm wavelength: Absorption, scattering, and extinction coefficients.
Similarly, the optical signals transmitted over UWOC links may be subjected to oceanic turbulence. Oceanic turbulence in UWOC links is primarily caused by fluctuation in the refractive index of water due to variations in temperature, salinity, and pressure [35]. Intensity scintillation, also known as oceanic turbulence, refers to the random fluctuations in intensity of the received signal caused by variations in the refractive index of the water [35]. The Gamma-Gamma distribution is utilized to model the random fluctuations in the intensity of the received signal [35] whose probability density function (PDF) is mathematically represented as [1, 34].
In Equation 3,
In Equation 3, the parameters
In Equation 7, the
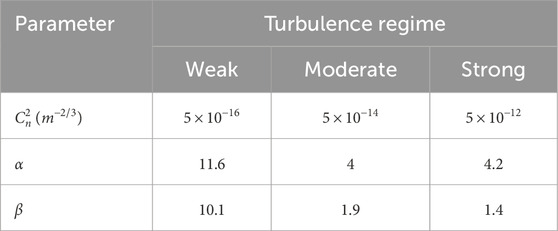
Table 3. Different turbulence regimes and their values.
3 Proposed architecture
As illustrated in the block diagram of the proposed architecture, in practical underwater sensing applications, sensors typically generate analog signals. These analog signals are then converted into bit streams using analog-to-digital converters (ADCs), enabling further processing and transmission [36]. The binary signals are used to directly or externally modulate a DML or continuous-wave (CW) laser, respectively and then the modulated optical carriers are transmitted over optical link. It may be observed that baseband data signals, each composed of Gaussian shaped pulses having full-width at half maximum (FWHM) of 50 ps at the rate of 1.5 Gb/s are used to directly modulate five lasers with emission wavelengths of

Figure 2. Illustration of the proposed architecture, DML: Directly modulated laser, DEMUX: Demultiplexer, S1, S2, S3, S4, S5: Five underwater sensors, PS: Power splitter, UWOC: Underwater wireless optical communication channel, OD: Optical delay, VOA: Variable optical attenuator, PD: Photodetector, SUB: Subtractor, EBPF: Electrical bandpass filter, ES: Electrical splitter, MIX: Mixer, ELPF: Electrical lowpass filter, BER: Bit-error rate estimator.
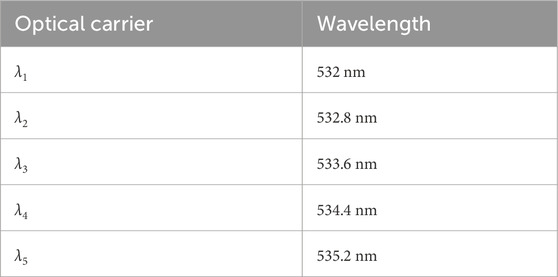
Table 4. Assignment of wavelengths.
It is pertinent to mention here that optical power of each laser is 30 dBm and wavelength spacing between adjacent channels is 0.8 nm as per wavelength division multiplexing (WDM) spectral grid defined by ITU-T. The on-off keying (OOK) modulated Gaussian shaped optical pulses produced by DMLs are transmitted through a line-of-sight UWOC link. The transmitted pulses are then collected by a receiver telescope that is connected with FOBS, where multiple radio access units (RAUs) are installed as depicted in Figure 2. The receiver telescope simply works here as power combiner which combines the multiple input optical signals and then passed on to
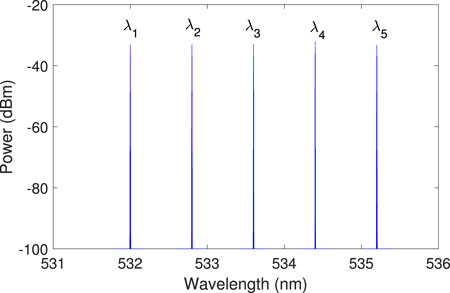
Figure 3. Spectral plot of combined optical signal at receiver telescope connected with FOBS. This plot is taken considering pure sea and weak turbulence regime.
The difference equation for Gaussian monocycle pulses approximated by
Where g(t) represents the Gaussian pulse in time-domain, m(t) is the Gaussain monocyle pulse in time-domain, and
At each RAU, the incoming signal is divided into two branches using a power splitter (PS), as illustrated in Figure 2. In one path, the signal undergoes a controlled delay, while in the other path, a variable optical attenuator (VOA) is employed to ensure equalized path losses. Subsequently, both delayed and attenuated optical signals are converted into electrical signals through photodetection. Finally, the resulting electrical signals are combined using a subtractor. The optical delay is carefully adjusted so that the tail of a Gaussian pulse in one path aligns with the front of the same Gaussian pulse in the other path. Due to the subtraction process at the output of the photodetectors, the two Gaussian shaped pulses acquire opposite polarities, thereby forming a Gaussian monocycle pulse. The UWB signals at the subtractor outputs are then filtered using electrical bandpass filters (EBPFs), each with a bandwidth of 10.6 GHz and transmitted to the MSs as illustrated in Figure 2. To prevent electromagnetic interference among the RAUs installed at FOBS, each RAU employs an EBPF tuned at different frequency, such as RAU-1 at 4 GHz, RAU-2 at 4.5 GHz, RAU-3 at 5 GHz, RAU-4 at 5.5 GHz, and RAU-5 at 6 GHz. The time-domain and frequency-domain traces of the generated Gaussian monocycle pulses for randomly selected sensors-1, 3, and 5 are shown in Figure 4.
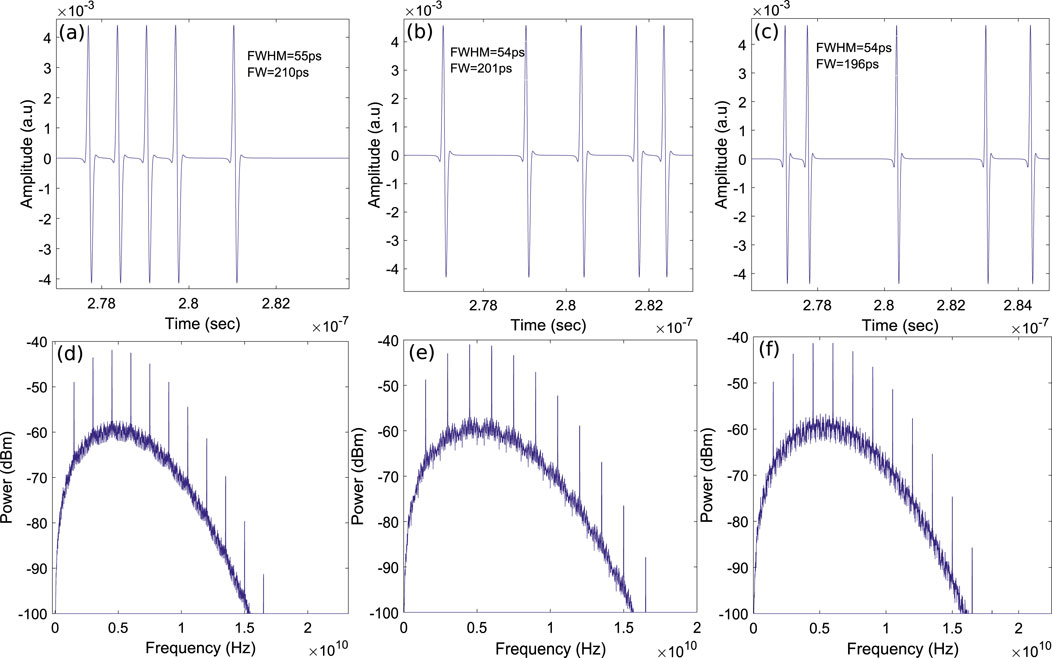
Figure 4. (a–c) Time-domain traces of the UWB monocycle pulses at the output of the RAUs for sensors-1, 3, and 5, respectively and (d–f) Frequency-domain traces of the UWB monocycle pulses at the output of the RAUs for sensors-1, 3, and 5, respectively. These plots are obtained considering pure sea and weak turbulence regime.
It is evident that generated UWB signals are perfectly compatible to FCC spectral mask. Moreover, the positive half cycles of UWB monocycle pulses for sensor-1, 3, and 5 have FWHM of 55 ps, 54 ps, and 54 ps, respectively. Similarly, UWB monocycle pulses for sensor-1, 3, and 5 have full-width (FW) of 210 ps, 201 ps, and 196 ps, respectively.
In real-world applications, the UWB signals modulated in amplitude, position, or shape as discussed in Section 1.3, are transmitted over wireless channels towards MSs. In this work, the MS is responsible for extracting the baseband data from the UWB signal and performing the BER analysis. Since the primary focus of this work is generation of UWB signals in optical domain, each UWB signal generated at the output of respective RAU is not transmitted over a wireless channel. Instead, it is directly connected to the MS’s input as shown in Figure 2. The signal received at the MS undergoes bandpass filtering to eliminate out-of-band noise. It is then split into two paths via an electrical splitter (ES). To implement self-mixing, the signals in both branches are combined using an electrical mixer [28, 29]. Multiplication through mixer results into removal of the negative half cycle of monocyle pulse, hence yielding Gaussian shaped pulses. The mixer output is then filtered using an electrical lowpass filter (ELPF) to reject high frequency harmonics and extract the baseband data. Finally, the baseband data signal is fed into a BER analyzer, which measures the BER values. The key simulation parameters used in this study are summarized in Table 5.
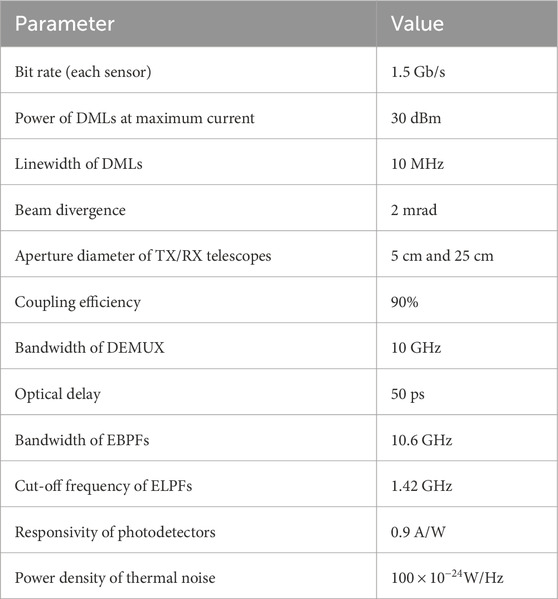
Table 5. Main simulation parameters.
4 Results and discussion
The following assumptions are considered to facilitate the analysis and evaluation of sensor performance in this study:
The sensors’ performance is evaluated using metrics of BER, Quality factor (Q-factor), and Error-vector magnitude (EVM). BER and Q-factor values are obtained exploiting OptiSystem’s internal statistical algorithm based on monitoring the eye diagrams of the signals at the electrical lowpass filter (ELPF) output. The Q-factor is related with BER by the Equation 9 [37].
where,
where,
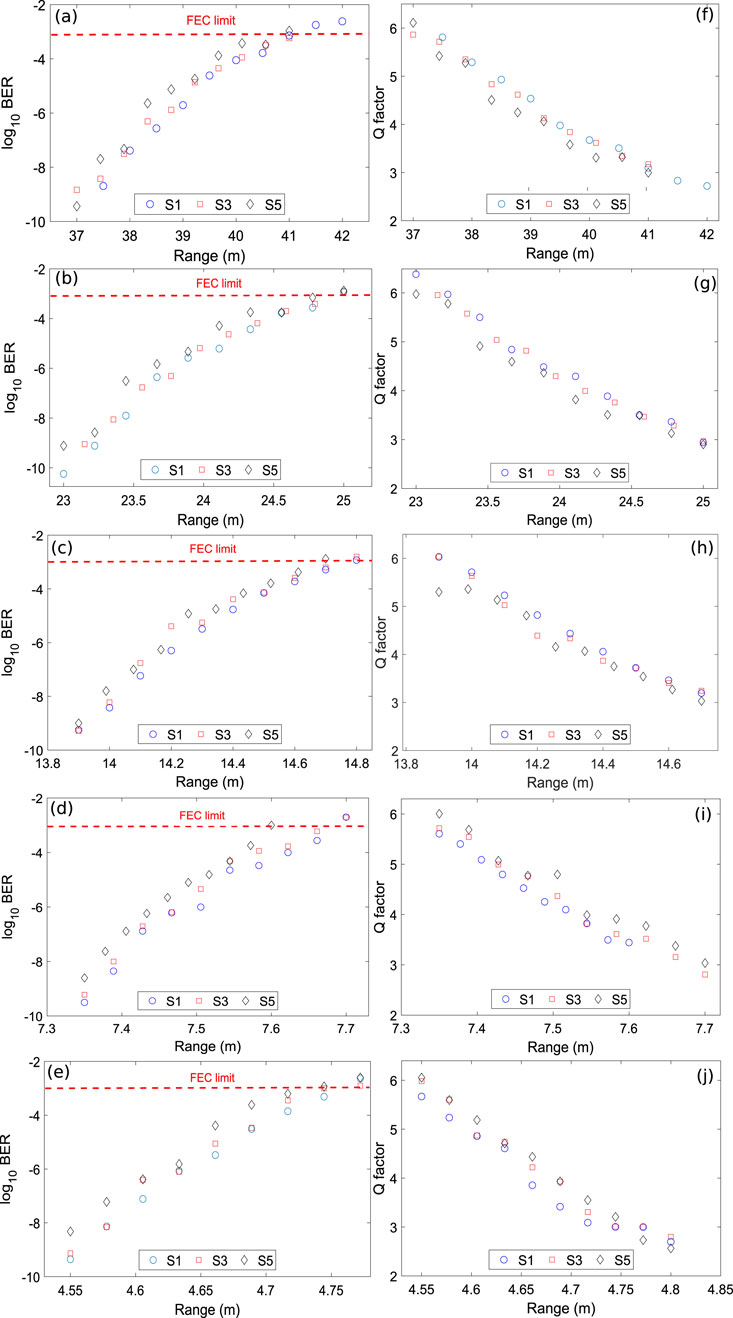
Figure 5. UWOC channel range versus (a–e) BER plots for pure sea, clear ocean, coastal ocean, harbor-I, and harbor-II, respectively (f–j) Q factor plots for pure sea, clear ocean, coastal ocean, harbor-I, and harbor-II, respectively. All results are obtained under weak turbulence conditions.
Error-vector magnitude (EVM) is a widely adopted system-level performance metric defined in various telecommunication standards to quantify the difference between the measured signal and the ideal reference signal [39]. It is frequently expressed as a percentage and it essentially measures how far received symbols are from their ideal constellation points. For OOK modulation, the BER is related to SNR by the following formula [39, 40].
Where Q(x) and
Finally, the EVM can be related with SNR as [39, 40].
In this study, Equations 11–13 are employed to numerically calculate the EVM values using BER results that were already obtained exploiting OptiSystem’s internal statistical algorithm. Figure 6 presents the EVM versus UWOC link range plots for various water bodies, such as pure sea, clear ocean, coastal ocean, harbor-I, and harbor-II considering weak turbulence regime.

Figure 6. EVM versus UWOC channel range plots for (a) Pure sea (b) Clear ocean (c) Coastal ocean (d) Harbor-I (e) Harbor-II. These plots are obtained considering weak turbulence regime.
It may be noticed that, for a given value of EVM, the range of the UWOC link decreases as water attenuation increases considering different water bodies. Higher attenuation in different water bodies results significant degradation of the optical signal’s power as it propagates through the UWOC link. In pure sea water where attenuation is relatively low, the signal can travel longer distances while maintaining acceptable BER value. However, in more turbid coastal or harbor waters with higher attenuation coefficients, the same signal quality can only be maintained over much shorter distances. The fundamental reason is that increased absorption and scattering in these water types leads to greater power loss along the UWOC link, which directly impacts the received signal strength. As the signal weakens, the noise becomes more significant relative to the signal, resulting in a lower SNR that manifests as higher EVM values. For additional evaluation of sensors’ performance, the normalized eye diagrams of sensor-2 and 4 as shown in Figures 7, 8 respectively, are obtained at the output of the ELPF for different water bodies. The results clearly demonstrate that the eye diagrams of sensor-2 and 4 are well open, facilitating easy detection of zeros and ones at the receiver.
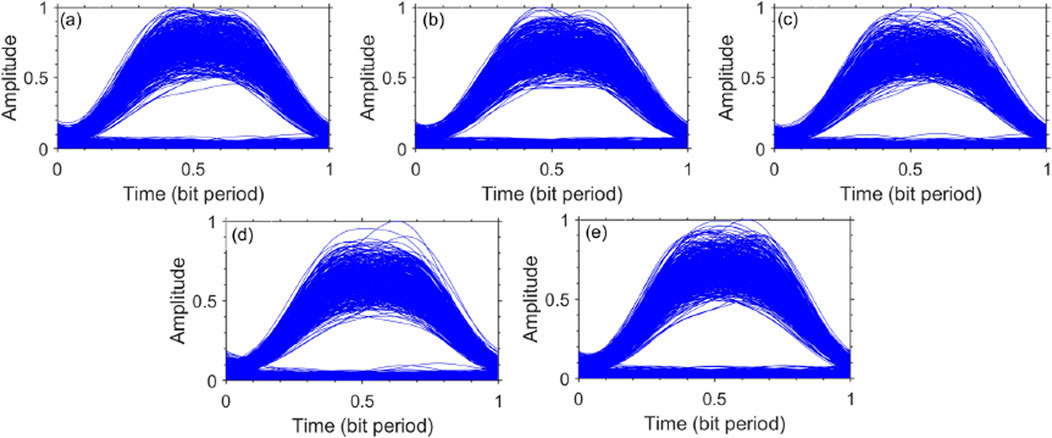
Figure 7. Normalized eye diagrams of sensor-2 for different water bodies (a) Pure sea (b) Clean ocean (c) Coastal ocean (d) Harbor-I (e) Harbor-II. The eye patterns are obtained considering weak turbulence regime at BER of
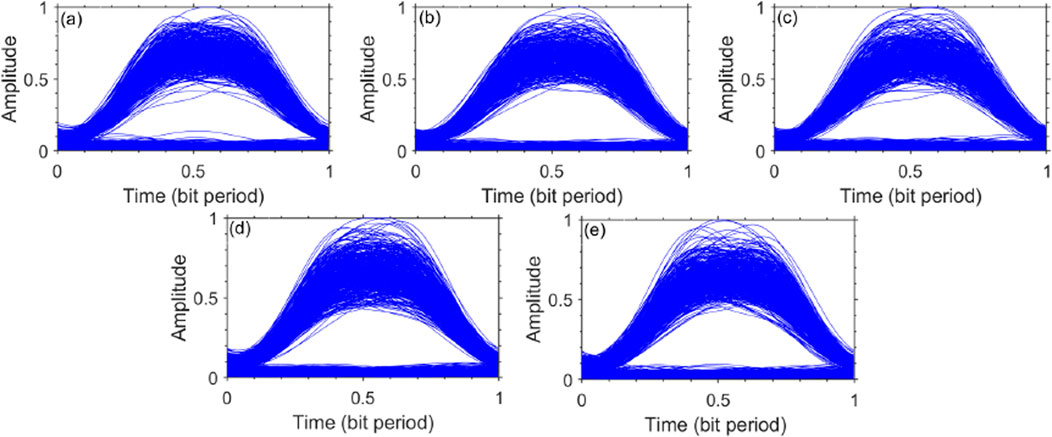
Figure 8. Normalized eye diagrams of sensor-4 for different water bodies (a) Pure sea (b) Clean ocean (c) Coastal ocean (d) Harbor-I (e) Harbor-II. The eye patterns are obtained considering weak turbulence regime at BER of
Figure 9 shows the BER and Q-factor versus UWOC link range plots for different turbulence regimes. It is evident from Figures 9a–c that maximum UWOC link range of 41.2 m, 41 m, and 37.8 m is attained at FEC target BER of

Figure 9. BER versus (a–c) UWOC channel range plots for weak, medium, and strong turbulence regime, respectively and Q factor versus (d–f) UWOC channel range plots for weak, medium, and strong turbulence regimes, respectively. These plots are obtained considering pure sea.
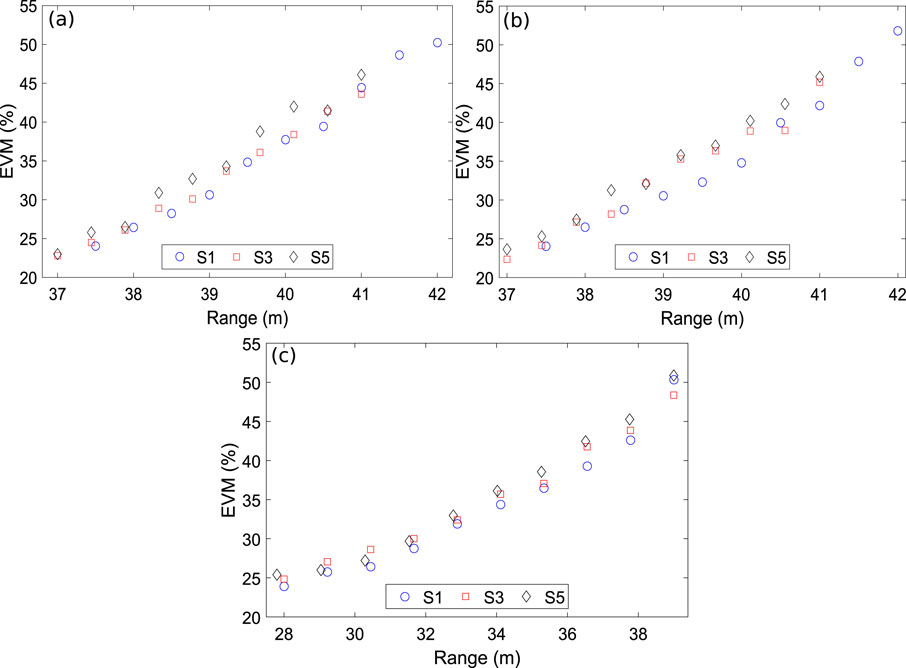
Figure 10. EVM versus UWOC channel range plots for (a) Weak turbulence (b) Medium turbulence (c) Strong turbulence. These plots are obtained considering pure sea.
It can be observed that, for a given value of EVM, the range of the UWOC link decreases as the value of
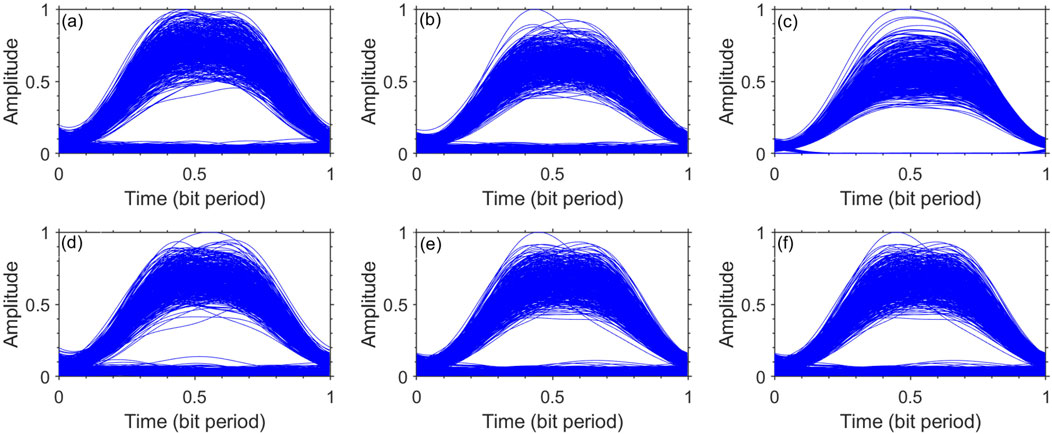
Figure 11. Normalized eye diagrams of sensor-2 (a–c) for weak, medium, and strong turbulence regime, respectively and sensor-4 (d–f) for weak, medium, and strong turbulence regime, respectively. The eye patterns are obtained considering pure sea at BER of
The results clearly demonstrate that the eye diagrams of sensor-2 and 4 are well open, facilitating easy detection of zeros and ones at the receiver.
The proposed system is highly scalable in terms of the number of sensors and data rates. By incorporating additional DMLs and optimizing the optical delay, more UWB signals can be generated and processed efficiently. Furthermore, the system can support higher data rates keeping in view the application requirement. This scalability makes the proposed UWOC/UWB integration a promising solution for future large-scale UWOSNs with diverse communication demands.
5 Conclusion
In this work, we have presented a converged underwater wireless optical communication and ultra-wideband transmission system for
Data availability statement
The raw data supporting the conclusions of this article will be made available by the authors, without undue reservation.
Author contributions
AA: Writing – review and editing, Writing – original draft, Methodology, Validation, Conceptualization. MA: Data curation, Writing – original draft, Conceptualization, Writing – review and editing, Methodology. KA: Data curation, Writing – original draft, Methodology, Formal Analysis, Writing – review and editing. IA: Validation, Visualization, Writing – review and editing, Formal Analysis, Writing – original draft. BK: Investigation, Writing – original draft, Visualization, Software, Conceptualization, Writing – review and editing. JM: Software, Conceptualization, Investigation, Writing – review and editing. IA: Methodology, Funding acquisition, Writing – original draft, Resources, Writing – review and editing.
Funding
The author(s) declare that financial support was received for the research and/or publication of this article. This work was funded by the Deanship of Graduate Studies and Scientific Research at Jouf University under grant No (DGSSR-2025-FC-01040).
Conflict of interest
The authors declare that the research was conducted in the absence of any commercial or financial relationships that could be construed as a potential conflict of interest.
Generative AI statement
The author(s) declare that no Generative AI was used in the creation of this manuscript.
Any alternative text (alt text) provided alongside figures in this article has been generated by Frontiers with the support of artificial intelligence and reasonable efforts have been made to ensure accuracy, including review by the authors wherever possible. If you identify any issues, please contact us.
Publisher’s note
All claims expressed in this article are solely those of the authors and do not necessarily represent those of their affiliated organizations, or those of the publisher, the editors and the reviewers. Any product that may be evaluated in this article, or claim that may be made by its manufacturer, is not guaranteed or endorsed by the publisher.
References
1. Mirza J, Atieh A, Kanwal B, Ghafoor S, Almogren A, Kanwal F, et al. Relay aided UWOC-SMF-FSO based hybrid link for underwater wireless optical sensor network. Opt Fiber Technology (2025) 89:104045. doi:10.1016/j.yofte.2024.104045
2. Ali MF, Jayakody DNK, Ribeiro MV. A hybrid UVLC-RF and optical cooperative relay communication system. In: Proc. 2021 10th int. Conf. Information and automation for sustainability (ICIAfS). IEEE (2021). p. 13–8.
3. Du Z, Ge W, Cai C, Wang H, Song G, Xiong J, et al. 90-m/660-Mbps underwater wireless optical communication enabled by interleaved single-carrier FDM scheme combined with sparse weight-initiated DNN equalizer. J Lightwave Technology (2023) 41(16):5310–20. doi:10.1109/jlt.2023.3262352
4. United Nations, Sustainable development goals (2025) Available online at: https://sdgs.un.org/goals.
5. Du J, Hong X, Wang Y, Xu Z, Zhao W, Lv N, et al. A comprehensive performance comparison of DFT-S DMT and QAM-DMT in UOWC system in different water environments. IEEE Photon J (2020) 13(1):1–11. doi:10.1109/jphot.2020.3044905
6. Deng H, Du Z, Xiong J, Yang X, Hua Y, Xu J. Security enhancement for OFDM-UWOC system using three-layer chaotic encryption and chaotic DFT precoding. Chin Opt Lett (2022) 20(11):110601. doi:10.3788/col202220.110601
7. Chen Z, Tang X, Sun C, Li Z, Shi W, Wang H, et al. Experimental demonstration of over 14 AL underwater wireless optical communication. IEEE Photon Technology Lett (2021) 33(4):173–6. doi:10.1109/lpt.2020.3048786
8. Guo Y, Kong M, Alkhazragi O, Sun X, Sait M, Ng TK, et al. Diffused-line-of-sight communication for Mobile and fixed underwater nodes. IEEE Photon J (2020) 12(6):1–13. doi:10.1109/jphot.2020.3030544
9. Ramavath PN, Udupi SA, Krishnan P. Co-operative RF-UWOC link performance over hyperbolic tangent log-normal distribution channel with pointing errors. Opt Commun (2020) 469:125774. doi:10.1016/j.optcom.2020.125774
10. Li S, Yang L, da Costa DB, Di Renzo M, Alouini MS. On the performance of RIS-assisted dual-hop mixed RF-UWOC systems. IEEE Trans Cogn Commun Networking (2021) 7(2):340–53. doi:10.1109/tccn.2021.3058670
11. Zhou B, Wang P, Cao T, Li G, Li S, Yang P. Performance analysis of AUV-carried RISs-aided multihop UWOC convergent with RF MRC systems over WGG oceanic turbulence. Vehicular Commun (2024) 45:100722. doi:10.1016/j.vehcom.2023.100722
12. Payal N, Gurjar DS. Hybrid FSO/RF and UWOC system for enabling terrestrial–underwater communication: performance analysis. Phys Commun (2025) 68:102540. doi:10.1016/j.phycom.2024.102540
13. Zhang J, Liu H, Feng L, Pan G. Performance analysis for wireless-powered relaying UWOC-RF systems. J Franklin Inst (2024) 361(2):1115–26. doi:10.1016/j.jfranklin.2023.12.052
14. Pei Q, Zhang Y, Liu F, Lian W, Fu X, Li J. Unified performance analysis of direct air-to-underwater RF/UWOC systems. Photonics (2023) 11(1):21–9. doi:10.3390/photonics11010021
15. Agheli P, Beyranvand H, Emadi MJ. UAV-assisted underwater sensor networks using RF and optical wireless links. J Lightwave Technology (2021) 39(22):7070–82. doi:10.1109/jlt.2021.3114163
16. Tsai W-S, Li C-Y, Lu H-H, Lu Y-F, Tu S-C, Huang Y-C. 256 Gb/s four-channel SDM-Based PAM4 FSO-UWOC convergent System. IEEE Photon J (2019) 11(2):1–8. doi:10.1109/jphot.2019.2900994
17. Hayle ST, Lu H-H, Lin H-M, Wang C-P, Li C-Y, Wu T-M, et al. Two-way 5G NR FSO-HCF-UWOC converged systems with R/G/B 3-wavelength and SLM-based beam-tracking scheme. Scientific Rep (2024) 14(1):22252. doi:10.1038/s41598-024-73651-x
18. Tsai W-S, Lu H-H, Wu H-W, Tu S-C, Huang Y-C, Xie J-Y, et al. 500 Gb/s PAM4 FSO-UWOC convergent System with a R/G/B five-wavelength polarization-multiplexing scheme. IEEE Access (2020) 8:16913–21. doi:10.1109/access.2020.2967856
19. Pei Q, Zhang Y, Liu F, Fu X. Performance analysis of the dual-hop mixed RF/UWOC system with fog channel and turbulence based on diversity. J Electromagn Waves Appl (2024) 38(13):1495–513. doi:10.1080/09205071.2024.2380379
20. Yadav S, Vats A, Aggarwal M, Ahuja S. Performance analysis and altitude optimization of UAV-enabled dual-hop mixed RF-UWOC system. IEEE Trans Vehicular Technology (2021) 70(12):12651–61. doi:10.1109/tvt.2021.3118569
21. Lei H, Zhang Y, Park KH, Ansari IS, Pan G, Alouini MS. Performance analysis of dual-hop RF-UWOC systems. IEEE Photon J (2020) 12(2):1–15. doi:10.1109/jphot.2020.2983016
22. Li S, Yang L, da Costa DB, Zhang J, Alouini MS. Performance analysis of mixed RF-UWOC dual-hop transmission systems. IEEE Trans Vehicular Technology (2020) 69(11):14043–8. doi:10.1109/tvt.2020.3029529
23. Li S, Yang L, da Costa DB, Yu S. Performance analysis of UAV-Based mixed RF-UWOC transmission systems. IEEE Trans Commun (2021) 69(8):5559–72. doi:10.1109/tcomm.2021.3076790
24. Lou Y, Sun R, Cheng J, Nie D, Qiao G. Secrecy outage analysis of two-hop decode-and-forward mixed RF/UWOC systems. IEEE Commun Lett (2021) 26(5):989–93. doi:10.1109/lcomm.2021.3058988
25. Deng H, Fu Z, Miao X, Wang S, Pan G, An J. Secure uplink transmissions in hybrid RF-UWOC space-ocean systems. IEEE Trans Wireless Commun (2023) 23:7816–32. doi:10.1109/twc.2023.3344888
26. Optiwave. OptiSystem (2025) Available online at: https://optiwave.com/products/optisystem/(Accessed August 11, 2025)
27. Wang Q, Yao J. Switchable optical UWB monocycle and doublet generation using a reconfigurable photonic microwave delay-line filter. Opt Express (2007) 15(22):14667–72. doi:10.1364/oe.15.014667
28. Mirza J, Ghafoor S, Hussain A. All-optical generation and transmission of multiple ultrawideband signals over free space optical link. Opt Eng (2019) 58(5):1–056103. doi:10.1117/1.oe.58.5.056103
29. Mirza J, Ghafoor S, Hussain A. A full-duplex ultra-wideband over multimode fiber link for internet of things based smart home applications. Trans Emerg Telecommun Technol (2020) 31(10):e4050. doi:10.1002/ett.4050
30. Beltran M, Llorente R. Dual photonic generation ultrawideband impulse radio by frequency shifting in remote-connectivity fiber. J Lightwave Technol (2011) 29(24):3645–53. doi:10.1109/jlt.2011.2173656
31. Pan S, Yao J. IR-UWB-over-fiber systems compatible with WDM-PON networks. J Lightwave Technol (2011) 29(20):3025–34. doi:10.1109/jlt.2011.2165275
32. Yao J, Zeng F, Wang Q. Photonic generation of ultrawideband signals. J Lightwave Technol (2007) 25(11):3219–35. doi:10.1109/JLT.2007.906820
33. Mirza J, Ghafoor S, Hussain A. All-Optical regenerative technique for width-tunable ultra-wideband signal generation. Photonic Netw Commun (2019) 38:98–107. doi:10.1007/s11107-018-0818-0
34. Mirza J, Kanwal F, Salaria UA, Ghafoor S, Aziz I, Atieh A, et al. Underwater temperature and pressure monitoring for deep-sea SCUBA divers using optical techniques. Front Phys (2024) 12:1417293. doi:10.3389/fphy.2024.1417293
35. Singh P, Bohara VA, Srivastava A. On the optimization of integrated terrestrial-air-underwater architecture using optical wireless communication for future 6G network. IEEE Photon J (2022) 14(6):1–12. doi:10.1109/jphot.2022.3210481
36. Proakis JG, Manolakis DG. Digital signal processing: principles, algorithms, and applications. India: Pearson (2013).
38. Zhang L, Wang K, Wang C, Chen M, Ding J, Sang B, et al. Real-time demonstration of a low-complexity PS scheme for 16QAM-DMT signals in an IM-DD system. Opt Express (2023) 31(7):11447–56. doi:10.1364/oe.480741
Keywords: UWOC/UWB converged transmission link underwater wireless optical sensor network, underwater wireless optical communication, ultra-wideband, Gaussian monocycle pulse, floating optical base station, gamma-gamma distribution, optical delay line, error-vector magnitude
Citation: Armghan A, Alsharari M, Aliqab K, Alrashdi I, Kanwal B, Mirza J and Aziz I (2025) High-speed and potentially scalable UWOC/UWB converged transmission link for underwater wireless optical sensor networks. Front. Phys. 13:1650284. doi: 10.3389/fphy.2025.1650284
Received: 19 June 2025; Accepted: 12 August 2025;
Published: 09 September 2025.
Edited by:
Rajib Biswas, Tezpur University, IndiaReviewed by:
Jinjia Li, Harbin University of Science and Technology, ChinaShreyas Jain, Defence Institute of Advanced Technology (DIAT), India
Copyright © 2025 Armghan, Alsharari, Aliqab, Alrashdi, Kanwal, Mirza and Aziz. This is an open-access article distributed under the terms of the Creative Commons Attribution License (CC BY). The use, distribution or reproduction in other forums is permitted, provided the original author(s) and the copyright owner(s) are credited and that the original publication in this journal is cited, in accordance with accepted academic practice. No use, distribution or reproduction is permitted which does not comply with these terms.
*Correspondence: Imran Aziz, aW1yYW4uYXppekBwaHlzaWNzLnV1LnNl; Khaled Aliqab, a21hbGlxYWJAanUuZWR1LnNh