 Xuemei Zhang
 Jianfeng Guo2,3*
 Siyao Liu
- 1College of Humanities and Social Sciences, Nanjing University of Aeronautics and Astronautics, Nanjing, China
- 2Institutes of Science and Development, Chinese Academy of Sciences, Beijing, China
- 3School of Public Policy and Management, University of Chinese Academy of Sciences, Beijing, China
Introduction: The rapid growth of the unmanned aerial vehicle (UAV) market has surged enterprises, exposing them to systemic risks from business homogeneity. This issue has spread not only within the same level of the industrial chain but also across different segments. Despite China’s enterprises spanning the entire chain as the largest market, their business structure and regional differences remain largely unexplored.
Method: This study constructs a three-tier UAV enterprise network based on overlapping business scopes among firms, forming upstream, midstream, and downstream layers, and examines its national and provincial structural robustness through topological characteristics and network dismantling experiments.
Results: The results reveal that national- and provincial-level UAV enterprise networks follow a power-law distribution, reflecting a “rich-get-richer” pattern. The national network is less robust than the provincial average, with downstream segments in delivery, agriculture, and other applications particularly vulnerable. Provincial networks exhibit strong regional heterogeneity; economically developed provinces demonstrate stronger internal coordination but are more fragile due to high centralization. Furthermore, provincial networks fall into four structural types with differing levels of efficiency and robustness.
Discussion: The study highlights how business similarity fosters local coordination but increases systemic risk through structural homogeneity. To enhance network resilience, especially in downstream and centralized regions, strategies such as modular design and region-specific coordination are essential.
1 Introduction
In recent years, the global unmanned aerial vehicle (UAV), commonly known as the drone industry, has expanded rapidly, reaching $31.66 billion in 2023 and projected to grow at a compound annual growth rate (CAGR) of 18.2% in 2024 [1]. The rapid growth has spurred in UAV-related enterprises [2, 3], many of which pursue economies of scale through shared resources, labor pools, and knowledge spillovers [4–6]. This has resulted in industrial clusters with high business homogeneity [7], which draws from institutional isomorphism theory. According to this theory, organizations operating within the same domain tend to become increasingly similar over time due to coercive, mimetic, and normative pressures, resulting in convergence in structure, strategy, and service offerings [8]. While such homogeneity may support upgrading in traditional industries [9, 10], it can pose systemic risk under external shocks in high-tech industries such as UAVs [10, 11]. Given China’s dominant position in the global UAV market [12, 13], similar vulnerabilities are expected to emerge. However, the network structure and risk resilience of China’ UAV enterprise network at both national and provincial levels remain unclear, as existing literature has yet to examine these aspects in detail.
Moreover, the risks brought by business homogeneity are not limited to a single stage of the industry chain but span across multiple levels [11, 14]. The UAV industry, like many manufacturing sectors, can be divided into upstream, midstream, and downstream segments, referring to suppliers, manufacturers, and distributors, respectively [15, 16]. The convergence of suppliers toward single-source materials introduces systemic risk [17]. When environmental or geopolitical disruptions exceed a certain threshold, failures can rapidly cascade from manufacturers to end users through downstream applications [17, 18]. Such cascade vulnerability was evident in the 2011 Japan earthquake, where the disruption of a single key supplier halted Toyota’s production nationwide and impacted global end users [18]. Therefore, it is essential to systematically assess the structural robustness of China’s UAV market to mitigate risks from a multi-level industry chain perspective.
The structural robustness, a concept originally developed in the field of structural engineering [19–21], has been widely adopted in network analysis [22–24]. Architectural literature defines robustness as a structure’s insensitivity to local failure [19, 21], which is determined by both internal deterioration and external shocks [21, 25, 26]. Such vulnerability is often influenced by material properties and spatial arrangement [21, 26]. Similarly, in the enterprise network, structural robustness is shaped by business scopes and the positions of key business clusters. Previous research has shown that enterprises with similar business activities are more likely to cluster together [7, 27, 28]. Despite the potential significance of this relationship, existing research in both network structure and industrial value chain literature has yet to explore how business similarity influences structural robustness.
Methodologically, we employ a multi-layer complex network approach, which is increasingly applied to analyze trade flows [29–32]. In this study, we are the first to construct a three-layer complex network for UAV enterprise operations, segmented into upstream, midstream, and downstream tiers, a division consistent with the most widely recognized industrial chain structure. All 2,120 listed UAV-related enterprises comes from Qichacha, a professional business database that provides comprehensive firm-level information. Based on their registered business scope, enterprises were assigned to different stages of the industry chain. Details are recorded in Section 2.1. Data sources. The analysis focuses on China, given its dominant position in the global UAV market. To examine regional differences, we selected six key provinces in China. The six provinces are Guangdong, Jiangsu, Beijing, Zhejiang, Shandong, and Henan, accounting for approximately 60% of the sampled enterprise. A key concept in our analysis is business homogeneity, which we define as the semantic similarity between the business scope. This operationalization reflects the degree to which firms engage in similar activities or serve related functions along the industry chain.
In principle, our work renders three major contributions. First, We pioneer highlight the examination of business homogeneity in industrial network. Unlike previous studies that typically focus on trade flows [29–32], our research investigates the relationship between enterprises’ business scopes. It reveals the importance of industrial clusters composed of similar businesses in the robustness of network structure, thereby significantly extending the research perspective and the boundaries of network analysis. Second, we adopt a multi-scale spatial framework to assess the structural robustness of UAV network at national and provincial levels, examining both normal topology and response to simulated attacks. Our results show that provincial networks are more robust than the national network, suggesting that cross-regional collaboration fosters industrial clustering but also increases vulnerability to external shocks. Finally, we design a composite node importance ranking method that integrates multiple indicators for high accuracy. Furthermore, based on our findings, we offer policy implications to improve risk management. For example, to enhance network robustness, governments may consider promoting regional differentiation by encouraging diverse business roles across provinces. While our analysis focuses on China’s UAV industry, the framework linking business similarity, multi-layer networks, and robustness can be applied to other interdependent high-tech industries, providing a basis for comparative studies.
The remainder of this article proceeds as follows. Section 2 elaborates data and models used in this work. Section 3 presents the main results. Section 4 discusses the findings, and Section 5 concludes.
2 Data and methods
2.1 Data sources
The primary dataset utilized in this study was obtained from Qichacha (https://www.qichacha.com/), a commercial data platform providing detailed firm-level information on Chinese enterprises. Our sample includes 2,120 listed UAV enterprises, with data covering corporate names, registered provinces, industrial classifications, business scopes, and other relevant operational characteristics. Non-listed and smaller-scale enterprises were systematically excluded due to the often limited availability and lower accuracy of operational data. Moreover, these enterprises generally contribute less to the core UAV industrial chain dynamics. Six provinces, namely, Guangdong, Jiangsu, Beijing, Zhejiang, Shandong, and Henan, were selected as representative regions, collectively constituting 60% of the total sample, as shown in Table 1. The remaining 40% of UAV enterprises are distributed across 28 other provincial-level administrative regions, which were not included in the regional comparison due to their smaller sample sizes. In this study, we use business similarity among UAV enterprises as a proxy for inter-firm connectivity instead of traditional trade data, as the latter reflects only short-term realized transactional activities rather than potential structural connections.
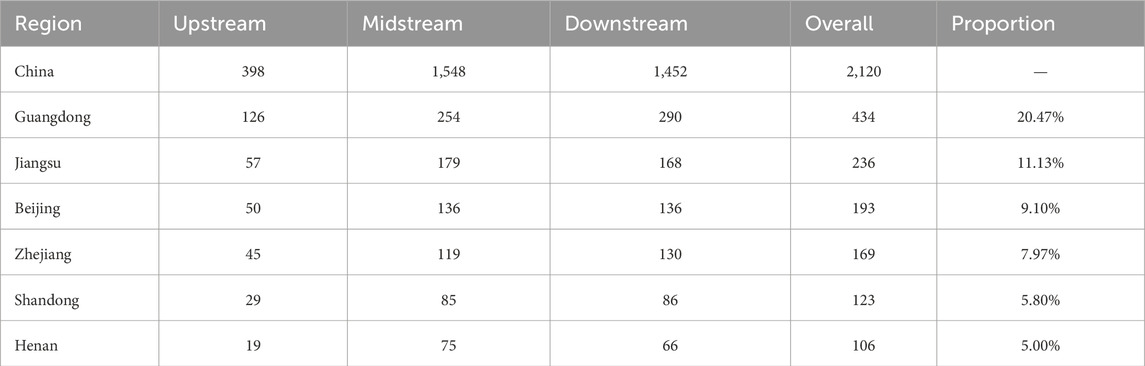
Table 1. Distribution of UAV enterprises by industry chain tier and region.
All observed UAV enterprises were manually classified into distinct segments of the industrial chain based on their business scopes. The UAV industry in China encompasses research and development, manufacturing, assembly, and distribution [33, 34]. The upstream segment primarily consists of raw materials, including metals and composites. The midstream involves the manufacturing of components such as engines, sensors, and avionics, while the downstream focuses on the assembly of UAVs and their distribution to end-users [35]. Notably, certain enterprises exhibit cross-tier operations spanning the entire industrial chain. Table 1 presents the national and provincial-level data for the UAV enterprise network.
2.2 Methodology
2.2.1 Construction of multi-layer UAV enterprise network model
The UAV enterprise network is modeled as a three-layer adjacency matrix S = (A, O), where A = {A[1], A[2], A[3]} denotes intra-layer adjacency matrices representing connections within each industrial segment, while O captures inter-layer relationships. Specifically, A[1] represents the upstream network of the UAV industry chain, A[2] denotes the midstream network, and A[3] corresponds to the downstream network. Enterprises serve as network nodes, and each enterprise may appear in one or more layers, depending on whether its business scope includes activities related to that stage. Edges between enterprises within the same layer are established based on business similarity, quantified using the cosine similarity between their full registered business scope texts. This text-based measure emphasizes functional similarities that drive structural patterns within the network, independent of firm-level attributes such as ownership, location, or size. Prior to computation, all texts are first standardized by removing punctuation and stopwords, and vectorized using the term frequency-inverse document frequency (TF-IDF) method. The cosine similarity between enterprise i and j is calculated in Equation 1:
where
Formally, the intra-layer connectivity within the
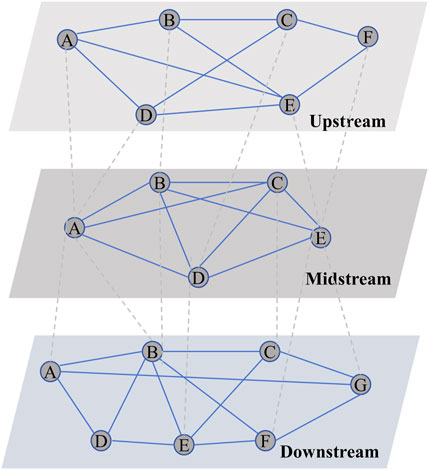
Figure 1. Three-tier UAV industry chain network based on business similarity. The circles represent nodes reflecting UAV enterprises, while the blue solid lines represent intra-layer edges derived from the similarity of business scopes. The gray dashed lines represent inter-layer edges, which exist when enterprises operate across layers or exhibit business similarity with enterprises in other layers.
2.2.2 Measurement of structural robustness under normal conditions
The UAV enterprise network is defined by its nodes and edges, whose structural features are key to revealing business homogeneity among enterprises. The network’s internal robustness is assessed through topological properties such as node connectivity and connection distribution, calculated using Gephi 0.10.1.
Degree is a fundamental parameter characterizing the local connectivity of nodes in the networks [36]. It quantifies the number of edges directly connected to a node, denoted as ki. As formalized in Equation 4, for nodes i and j within a network of total size N, the adjacency matrix element aij indicates the presence (aij = 1) or absence (aij = 0) of a direct connection. Nodes with higher degrees are more central, thus reflecting their enhanced influence on structural robustness [36]. It is calculated by
Degree distribution represents the probability distribution of node degrees across the entire network. Defined as P(k), the degree distribution reflects the fraction of nodes Nk with degree k relative to the network size N, as shown in Equation 5. The distribution of nodes can be determined based on the variation in the P(k) function, and provides insights into the connectivity and structural prominence within the UAV enterprise networks.
The clustering coefficient characterizes the transitivity of a network, representing the average likelihood that two neighboring nodes of a given local node are also interconnected [37]. Originally proposed by Watts and Strogatz, this metric gauges the tendency of nodes to form clusters within a network [37]. A high clustering coefficient indicates a strong clustering structure, whereas a low clustering coefficient suggests the absence or weakness of such a structure. Denoted as C, it is computed in Equation 6:
Where Ni denotes the number of edges associated with node i, and ki is the degree of node i. The clustering coefficient satisfies 0 ≤ C ≤ 1. When C = 0, nodes remain unconnected, whereas C = 1 indicates a fully interconnected network.
The average path length is a global property representing the average value of all shortest paths between any two pairs of nodes [37]. It quantifies the overall efficiency and connectivity in complex networks, particularly in small-world networks and scale-free networks [37]. For a network with N nodes, the shortest path length between node i and j is denoted as dij. The average path length L is defined in Equation 7.
2.2.3 Evaluation of structural robustness under targeted attacks
2.2.3.1 Methods of node importance ranking
To assess the structural robustness of the network under targeted attacks, it is essential to determine the node removal sequence by ranking node importance. Prior studies have typically employed single-index centrality measures such as degree centrality, betweenness centrality, closeness centrality, and eigenvector centrality, each capturing a different aspect of node importance.
Degree centrality represents the most straightforward method for quantifying node centrality in network analysis [38]. Nodes with a high degree of centrality are deemed influential due to their extensive network connections, enabling efficient information propagation and substantial systemic influence. However, it overlooks a node’s global impact in the network. It is calculated as Equation 8.
Betweenness centrality identifies nodes that frequently lie on the shortest paths between other nodes, reflecting control over information flow [39]. As shown in Equation 9. The betweenness centrality BCi of node i is defined as the ratio of the number of shortest paths between any pair of nodes j and l that pass through node i (Njl(i)) to the total number of all shortest paths between nodes j and nodes l (Njl).
Closeness centrality quantifies a node’ centrality by measuring the average shortest path distance from the node to all other nodes [40]. Nodes with higher values are more central. The formula is presented as Equation 10, where CCi denotes the closeness centrality of node i, and dij represents the shortest path distance between nodes i and j.
Eigenvector centrality considers not only the quantity but also the importance of a node’s neighbors, emphasizing influence within high-status neighborhoods [41]. This recursive relationship ensures that a node gains higher centrality if it is connected to other highly central nodes, as formalized in Equation 11, where c is a proportionality constant, and xj denotes the eigenvector centrality of node j.
While widely adopted, single centrality metrics may fail to capture the multidimensional nature of node influence in complex networks. To address this limitation, we propose a composite node importance index that incorporate richer structural information based on information-weighted assignment. Traditional weighting methods often rely on correlation-based ranking or similarity to ideal solution, which may overlook data complexity. In contrast, the information-weighted method is grounded in mathematical derivation, and quantifies variability and informational content across criteria. Specifically, we integrates three objective approaches: the CRITIC for contrast analysis, the Entropy Method for uncertainty, and Entropy-Weighted TOPSIS for ideal solution evaluation. To address scale and dimensionality disparities among indicator values, we implement min-max normalization to standardize these metrics within a unified range of 0–1. The normalized value x* is calculated in Equation 12:
where x is the actual value, and xmax, xmin are the maximum and minimum value, respectively. Each method produces a weight vector for the four centrality indicators. These are assembled into a method-indicator matrix wij, where i = 1,2,3 denotes the method and j = 1,2,3,4 denotes the indicator. To quantify the informational contribution of each method, we apply an entropy-based fusion strategy. For each method i, the normalized weight distribution Ei across indicators in Equation 13:
The diversification degree, di = 1-Ei, is used to compute method-level weights in Equation 14, where Ei represents the entropy value associated with each method. Final indicator weight allocations are then determined as specified in Equation 15. Subsequently, the overall node importance score is then given by Equation 16.
where NRi denotes the comprehensive index of node importance, wj represents the information weight derived from the three methods. DCi*, BCi*, CCi*, and ECi* represent the values of degree, betweenness, closeness, and eigenvector centrality for node i, respectively. The workflow of the proposed multi-indicators and multi-weight node ranking methodology is presented in Figure 2.
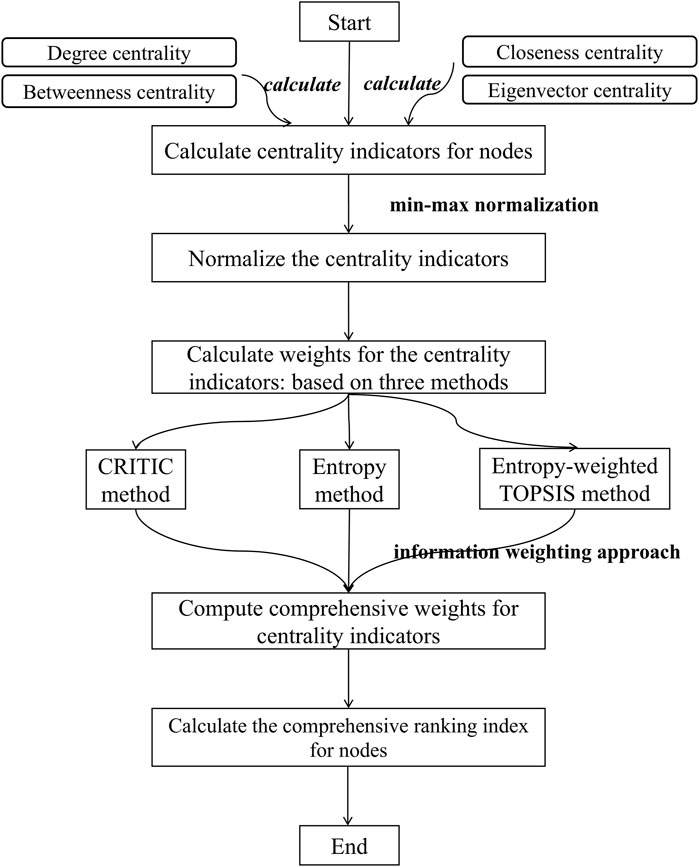
Figure 2. Workflow of the multi-indicators and multi-weight ranking method for node importance. The pipeline integrates four centrality metrics (degree, betweenness, closeness, and eigenvector centrality) through normalization, multi-method weight allocation (CRITIC, entropy, and entropy-weighted TOPSIS), and comprehensive weighted aggregation. The final ranking index synthesizes topological and information-theoretic perspectives to quantify node significance in complex networks.
2.2.3.2 Network disintegration experiment
We conducted disintegration simulations on the three-layer UAV enterprise networks at both the national and six provincial levels to evaluate structural robustness. Specifically, nodes were removed according to the composite ranking method introduced earlier, in descending order of calculated importance. The simulations were performed with node removal rates from 0 to 1 in 0.1 increments. As the process was non-stochastic, repeated iterations were unnecessary. At each step, we calculated accessibility, connectivity, and efficiency to assess structural degradation. All simulations and visualizations, covering eight regions and six structural indicators, were implemented using Python 3.0.
Accessibility serves as an efficiency-oriented metric for industrial chain networks, quantifying the likelihood or ease with which any two nodes can communicate via alternative paths [42, 43]. It is measured by the average shortest path length within the maximum connected subgraph of the network, and the shorter the path, the higher the accessibility. The average value of the shortest path of the industrial chain network determines the transmission speed of business information between enterprises. It can be quantified as the ratio of the average value of the shortest path of the maximum connected subgraph after the network is attacked to the average shortest path length of the original system.
Connectivity evaluates the stability of industrial chain networks, particularly the connectivity density among enterprises [43]. It is quantified by the remaining capacity of the network after node failures. The proportion of the number of nodes retained in the surviving connected subgraph relative to the number of nodes in the original network size constitutes a direct indicator of the network’s vulnerability.
Network efficiency serves as a metric to evaluate resource allocation and operational effectiveness in industry chain networks, particularly reflecting the collaborative performance among nodes [42]. It can be conceptualized as the ratio of the global efficiency of the network post-attack to the global efficiency of the original system.
3 Results
3.1 The ranks of node importance in UAV network
To ensure the objectivity of node importance ranking, we first employed the CRITIC method, Entropy Method, and Entropy-weighting TOPSIS Method to assign weights to the four centrality metrics. Subsequently, we applied the information weighting method, a quantitative analysis approach suitable for complex systems and large-scale datasets, to reassign the weights. All the final information is presented in Table 2. Finally, based on the calculated weights, we ranked the importance of nodes at both the national and provincial levels. The detailed rankings can be found in Supplementary Table S1, with the top 30 nodes displayed due to space limitations. This distribution method enables a comprehensive evaluation of each node’s importance within the network. By incorporating multiple centrality metrics, our approach achieves more objective, precise, and robust rankings for node importance in the UAV industry chain network.
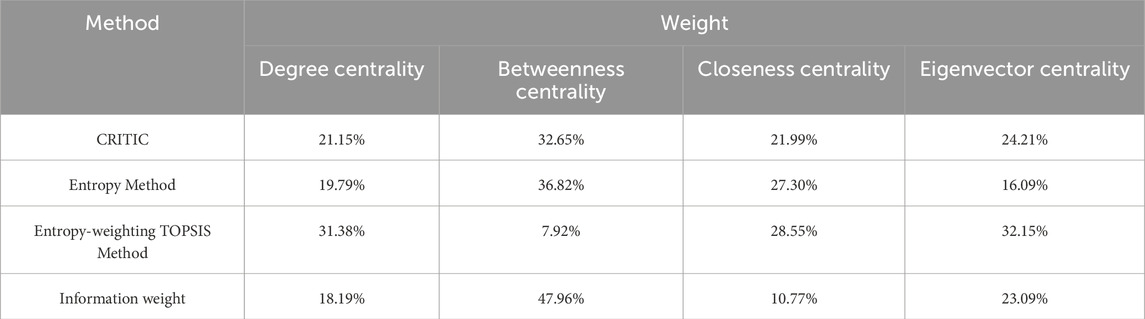
Table 2. Weight allocation of centrality indicators by different objective methods.
To validate the methodology proposed in Section 2.2.3.2, we calculated node importance rankings in the UAV enterprise network and selected the top 30 nodes for further verification. Node information is provided in Supplementary Table S2, while network metrics are presented in Table 3. Compared to single-metric approaches, our method demonstrated significantly lower APL and variance, indicating higher connectivity and minimal structural changes under risk disturbances. It also exhibits the highest cohesion (0.94), resistance (0.92), and resilience (0.97), with relative improvements of 9.17%, 9.26%, and 4.29%, respectively. Although the absolute differences among the five metrics are not large, the overall performance consistently favors the information weight method. This trend is further supported by the resilience degradation curves (Figure 3), which show slower connectivity loss during progressive node removals. These findings confirm its enhanced robustness, superior ranking stability, and imporved network resilience under risk scenarios.
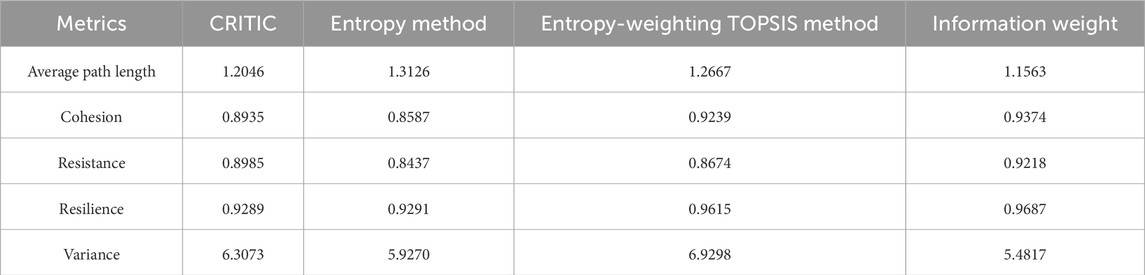
Table 3. Robustness test of node ranking methods based on network metrics.
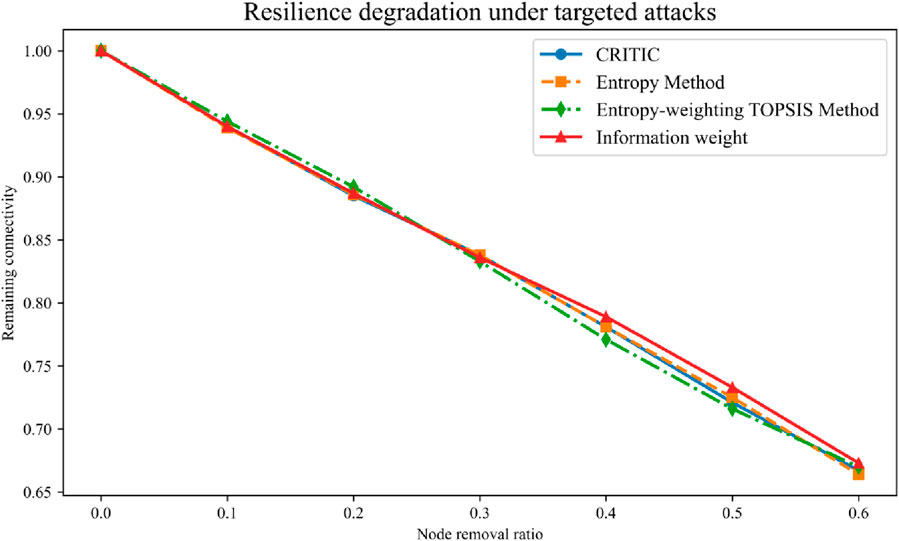
Figure 3. Resilience degradation of the UAV enterprise network under targeted attacks. The y-axis represents remaining connectivity (i.e., the largest connected component relative to the original network), and the x-axis indicates the node removal rate. Blue, orange, and green lines represent CRITIC, Entropy, and TOPSIS methods, while the red line is the proposed information weight method, which shows superior robustness beyond a 0.2 removal rate.
3.2 Structural robustness at the national-level
3.2.1 Systemic topological characteristics
Figure 4 presents the topological characteristics of the national-level UAV enterprise operation network, including node-level (i.e., degree distribution) and edge-level (i.e., clustering coefficient) indicators. The results show that the overall structural robustness at the national level is consistently below the provincial average, as evidenced by its higher average degree and clustering coefficient, along with a shorter average path length. This suggests that interprovincial collaboration enhances connectivity but may also increase systemic risk due to greater business homogeneity.
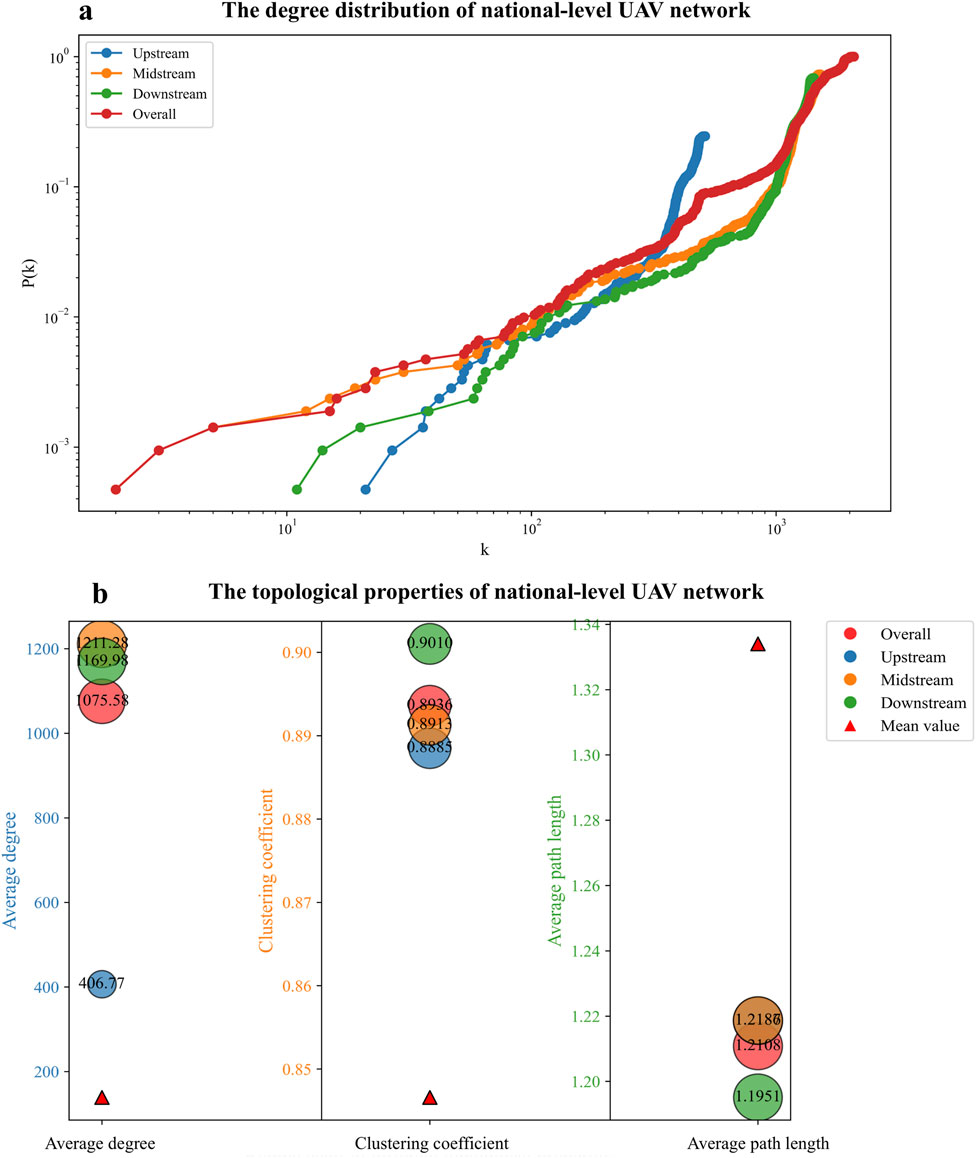
Figure 4. Topological characteristics of the national-level UAV enterprise network. Results are shown for upstream (blue), midstream (orange), downstream (green), and overall (red) segments. (a) The line chart presents the cumulative degree distribution. The horizontal axis (K) represents node degree, spanning 101 to 105, while the vertical axis (P(K ≥ (K)) shows the probability of nodes with degrees ≥ k, scaled from 10−3 to 103. (b) The bubble chart displays three structural indicators: degree, clustering coefficient, and average path length. Bubble colors represent industrial chain stages, and bubble sizes reflect the magnitude of the indicators. Red triangles denote the provincial average for each metric.
Figure 4A illustrates the cumulative degree distributions of UAV enterprise operations at the national level. The results reveal that the national UAV network follows a power-law distribution, with linear trends in log-log coordinates [44]. This implies a “rich-get-richer” structure, dominated by a few highly connected core enterprises, driven by preferential attachment [45, 46]. A similar pattern is observed across different industrial chain segments, where internal resources become increasingly concentrated among leading enterprises [47, 48]. This concentration may weaken the innovation capacity of small and medium-sized enterprises (SMEs) and raise systemic risk. Such a pattern likely stems from the high technological barriers inherent in the UAV industry, consistent with evidence that Matthew effects are more prominent in high-tech sectors [49, 50]. This self-reinforcing process suggests that enterprises with existing advantages are more likely to attract new collaborations, further amplifying their centrality and influence in the network.
Additional topological results, shown in Figure 4B, reveal uneven structural robustness across the UAV industry chain at the national level. The upstream UAV enterprise network exhibits the highest robustness, while the downstream segment is the most fragile. The downstream segment has a high average degree, strong clustering, and short average path length, indicating broad business reach and dense clusters of similar enterprises. This may be due to the downstream UAV sector’s greater maturity, with widespread applications in agriculture, tourism, emergency services, and logistics. However, such diversification may intensify long-term systemic risk due to business homogenization. Despite its apparent structural density, the downstream network is more prone to rapid collapse under targeted attacks.
3.2.2 Simulation of targeted attack scenarios
The simulation results of the structural robustness of the national-level UAV enterprise network under targeted attacks are presented in Figure 5, with detailed data available in Supplementary Table S3. As nodes are progressively removed, the UAV enterprise network maintains fundamental structural robustness during the initial phase but undergoes rapid deterioration beyond a critical threshold (node removal rate >60%). This phenomenon is attributed to business homogeneity. Similarity-driven clustering enhances communication density within clusters but also increases systemic risk by fostering dependency on a limited number of key nodes with overlapping business characteristics. These findings align with previous studies; business similarity exacerbates systemic vulnerability by concentrating risks within core clusters [7, 10, 11].
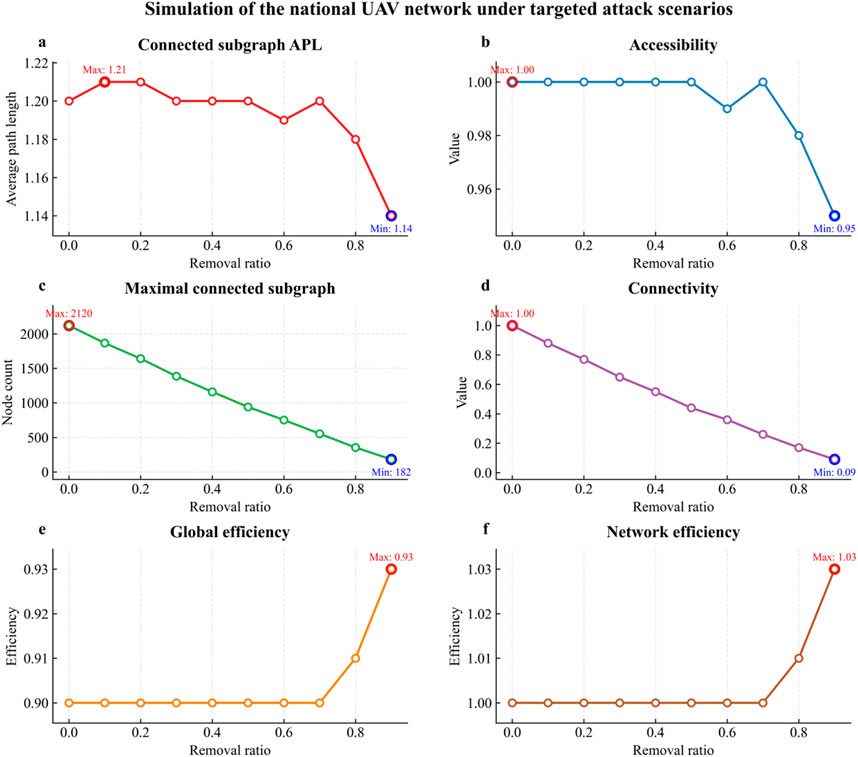
Figure 5. Simulation of the national UAV enterprise network under targeted attack scenarios. Nodes were sequentially removed based on the ranks of node importance in increments of 0.1 (from 0 to 0.9); results at the full removal ratio (1.0), where all indicators drop to zero, are omitted for clarity. Red circles mark peak values, and blue circles indicate minima. Evaluated metrics include: (a) average path length (APL) of the largest connected subgraph, (b) accessibility, (c) size of the maximal connected subgraph, (d) connectivity, (e) global efficiency, and (f) network efficiency.
Specifically, as depicted in Figures 5a,b, APL remains relatively constant throughout most of the node removal process, while the accessibility of the national UAV network declines after approximately 60% node removal. This implies that while path lengths among connected nodes remain short, the overall connectedness decreases, isolating clusters of similar businesses. Furthermore, the sharp shrinkage of the maximal connected subgraph (Figure 5c) and the sharp decline in connectivity (Figure 5d) indicate the fragmentation and vulnerability arising from interdependencies of enterprises with overlapping business activities. Such fragmentation is considered to threaten the information and resource flows critical for maintaining network functionality. Nevertheless, global efficiency stays stable or slightly increases under high node removal (Figure 5e), while network efficiency in Figure 5f even exceeds 1 (up to 1.03). This unexpected trend is likely driven by tighter local clustering among surviving firms. To verify this, we compared network efficiency and clustering coefficients before and after node removal (Figure 6). Both metrics exhibit a nearly parallel upward trend, suggesting that the efficiency gain stems from denser intra-cluster ties rather than enhanced overall robustness.
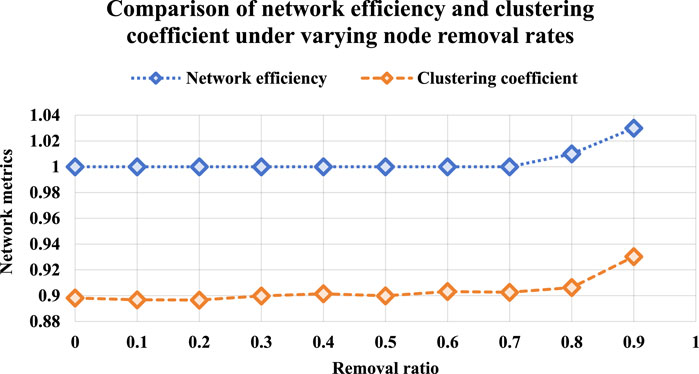
Figure 6. Comparison of network efficiency and clustering coefficient under varying node removal rates. In the figure, the network efficiency is depicted by the blue line, whereas the clustering coefficient is shown by the orange line.
3.3 Structural robustness at the provincial-level
3.3.1 Systemic topological characteristics
The cumulative degree distributions of provincial-level UAV enterprise networks are presented in Figure 7. Similar to the national network, all six provincial networks exhibit a power-law distribution, a hallmark of scale-free networks. This implies the presence of a few hub enterprises with extensive business overlaps, reinforcing the existence of hierarchical structures with uneven inter-firm connectivity. Such a pattern indicates that once an enterprise becomes central in a provincial network, its likelihood of forming new connections increases, consolidating its dominant position and reinforcing structural inequality across firms.
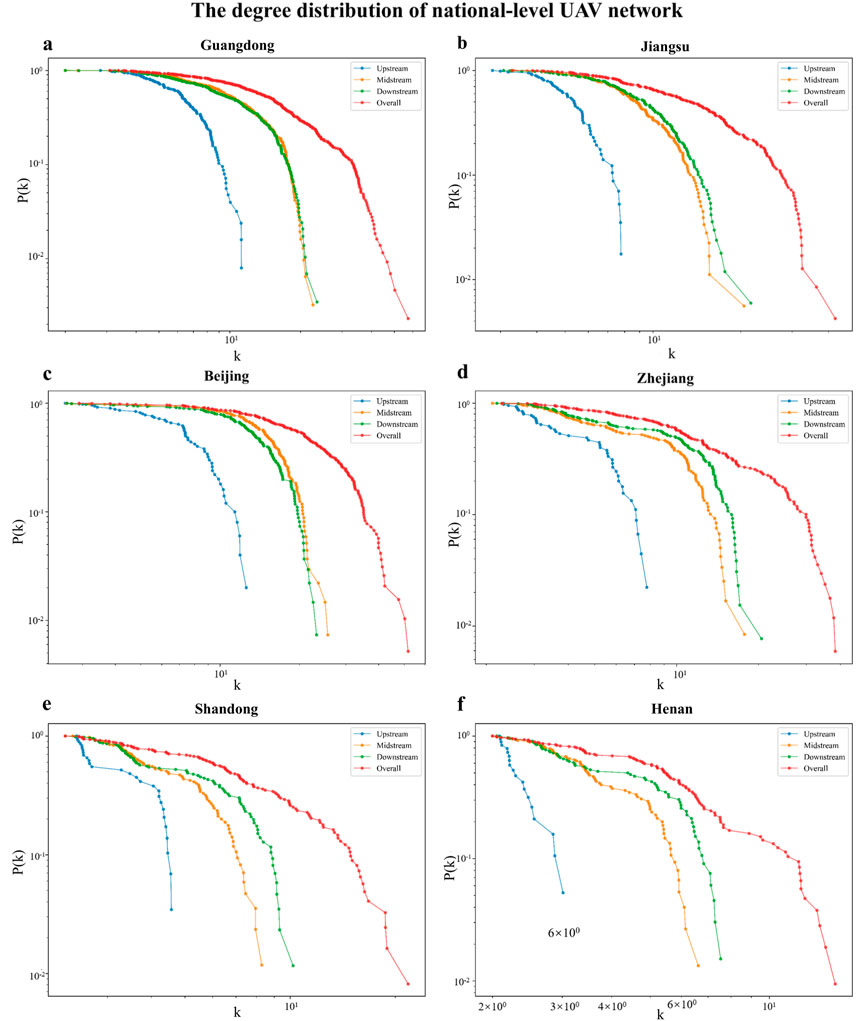
Figure 7. The cumulative degree distribution of provincial-level UAV enterprise network. Six sub-figures compare the cumulative degree distributions of (a) Guangdong, (b) Jiangsu, (c) Beijing, (d) Zhejiang, (e) Shandong, and (f) Henan provinces across upstream (blue), midstream (green), downstream (orange), and overall (red) segments. The horizontal axis (k) represents node degree, while the vertical axis (P(K ≥ k)) shows the probability of nodes with degrees greater than or equal to k.
Further topological analysis in Figure 8 reveals pronounced regional differences. As shown in Figure 8a, Jiangsu demonstrates a high clustering coefficient, elevated average degree, and the lowest APL, suggesting a tightly connected structure with high business similarity among UAV enterprises. While this configuration enhances internal collaboration and operational efficiency, it also indicates increased systemic risk due to close interdependence. In contrast, Henan exhibits low clustering and connectivity, implying relatively independent business operations among enterprises, likely reflecting the province’s less developed UAV industry base. Interestingly, although Guangdong holds the highest average degree, its network appears loosely clustered and topologically fragmented, indicating a broader but weaker pattern of inter-firm linkages.
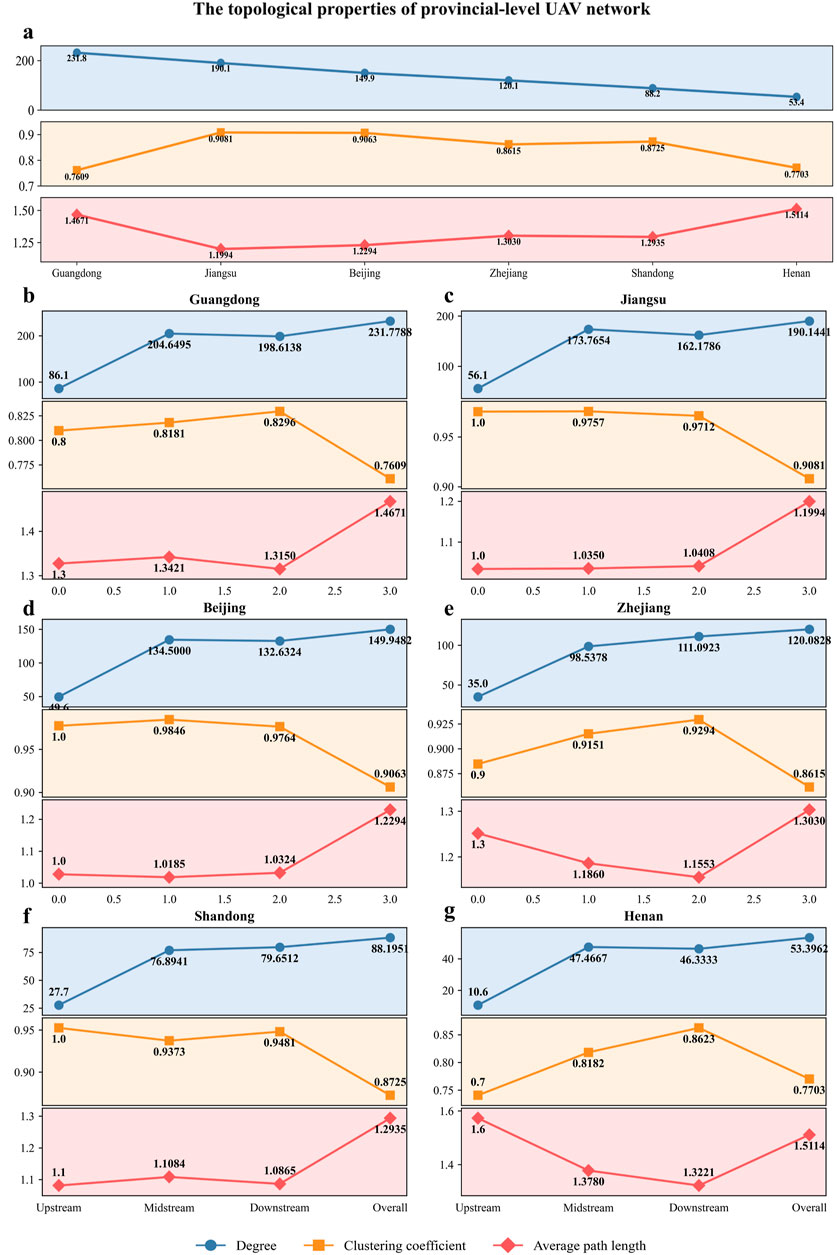
Figure 8. Topological characteristics of the provincial-level UAV enterprise network. The results are presented for the degree (circles), clustering coefficient (squares), and average path length (diamonds). Panels show (a) the overall network across six provinces, and the upstream, midstream, downstream, and overall segments of (b) Guangdong, (c) Jiangsu, (d) Beijing, (e) Zhejiang, (f) Shandong, and (g) Henan.
Subnetwork analysis across different segments of the UAV industrial chain is shown in Figures 8b–g. A consistent pattern emerges; economically developed provinces such as Guangdong, Jiangsu, Beijing, and Zhejiang exhibit stronger industrial collaboration. Their networks show higher average degree and clustering coefficients across upstream, midstream, and downstream segments compared to less developed regions like Henan and Shandong, suggesting broader industrial coverage and tighter inter-enterprise relationships. While such characteristics promote production efficiency and innovation through specialization and cooperation, they also contribute to concentrated vulnerability. Additionally, structural imbalances across industrial chain stages are evident in certain provinces. For instance, Henan’s downstream segment has a significantly lower average degree (53.396) and clustering coefficient (0.7705) compared to its upstream and midstream segments, revealing weak business cohesion in application services. This suggests potential disruptions or fragmentation in the regional UAV value chain.
3.3.2 Simulation of targeted attack scenarios
The simulation results of provincial UAV enterprise operation networks under targeted node removal are illustrated in Figure 9, with detailed numerical results available in Supplementary Table S4. The simulations reveal a consistent degradation pattern across all six provincial networks, as shown by a reduction in maximal connected subgraph size, network connectivity, and global efficiency. However, up to a 50% removal ratio, APL and accessibility remain relatively stable, indicating preserved local communication and operational buffering capacity despite growing global fragmentation. Based on a comparative evaluation of key robustness metrics, the networks can be categorized into four types, namely, efficiency-robustness coexisting networks (Jiangsu, Beijing), highly centralized but fragile networks (Guangdong), low-efficiency and low-robustness networks (Henan, Shandong), and moderately robust networks (Zhejiang).
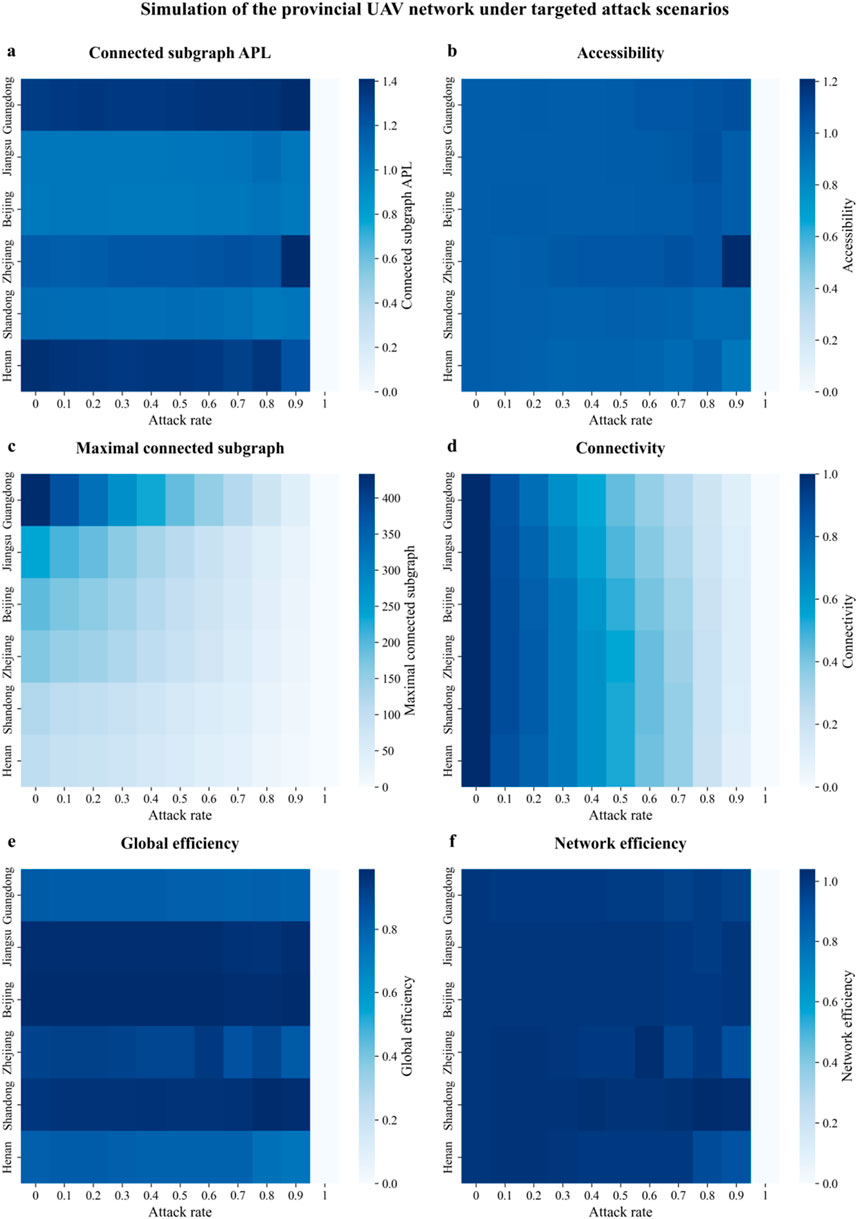
Figure 9. Simulation results of the provincial-level UAV enterprise network under targeted attack. The results cover six representative provinces, including Guangdong, Jiangsu, Beijing, Zhejiang, Shandong, and Henan. The heatmaps represent the values of six topological resilience metrics, where darker shades indicate higher values. Panels show (a) Connected subgraph APL, (b) Accessibility, (c) Max connected subgraph, (d) Connectivity, (e) Global efficiency, and (f) Network efficiency.
In detail, Jiangsu and Beijing exhibit strong efficiency-robustness coexistence. In Jiangsu, APL and accessibility remain virtually unchanged throughout the removal process (see Figures 9a,b), and the maximal connected subgraph retains a substantial size even under 70% node removal (see Figure 9c). Both global and network efficiency remain nearly constant (see Figures 9e,f), indicating an internally cohesive, well-connected structure with sufficient redundancy to withstand external perturbations. Similarly, Beijing shows minimal disruption in local structural indicators and maintains network efficiency close to 1 across all stages, despite a slightly faster degradation in connectivity (see Figures 9d,f). These observations are consistent with the Robustness-efficiency tradeoff framework (RETO) in complex network analysis [51, 52].
Guangdong represents a highly centralized but fragile structure. As shown in Figure 8c, it possesses the most extensive initial connectivity (433 nodes in the maximal subgraph), and its structural integrity deteriorates rapidly once nodes are removed. APL and accessibility rise sharply (see Figures 9a,b), and connectivity drops to nearly zero at a 90% removal rate (see Figure 9d), indicating a lack of sufficient redundancy. Despite its reach, the network’s centralized and loosely clustered structure makes it particularly vulnerable to targeted attacks.
Henan and Shandong display low efficiency and low robustness. Henan begins with the smallest subgraph, the highest APL, and the lowest global efficiency in Figures 9a,c,e, and suffers rapid and near-complete structural collapse at higher attack levels. Shandong shows similar fragility in connectivity (see Figure 9d), although global and network efficiency remain relatively stable or slightly improved (see Figures 9e,f), possibly due to peripheral node elimination and the persistence of a small core cluster. Nonetheless, both networks are characterized by weak inter-firm linkages and fragmented topologies.
Zhejiang occupies an intermediate position in terms of structural robustness. Although its APL and global efficiency begin to decline more noticeably in the later stages of attack (Figures 9a,e), and connectivity drops to 0.12 at the 90% removal level (Figure 9d), the overall network shows better structural stability compared to Henan and Shandong. This suggests that Zhejiang’s network is denser but still partially reliant on central nodes, leading to a moderate level of vulnerability.
4 Discussion
4.1 Result analysis
Industrial clusters are a specific type of industrial organization, where enterprises with similar business scopes tend to co-locate and form tightly-knit networks [7, 27, 28]. Driven by business homogeneity, such clustering not only shapes the internal connectivity patterns of enterprise networks but also increases their vulnerability to external disruptions [7, 53]. While local collaboration within these clusters can improve operational efficiency, it simultaneously heightens systemic risk by concentrating dependencies on a few central enterprises [10, 11]. These risks are particularly pronounced under targeted disruptions, where the failure of key nodes can trigger widespread structural fragmentation [54, 55].
Our study applies a complex network model based on business similarity and network disintegration experiments to investigate the structural robustness of UAV enterprise networks at national and provincial levels. The following observations are obtained from the study. First, both levels exhibit power-law degree distributions, indicating a typical scale-free structure. This suggests that a few enterprises with high business similarity play disproportionately central roles in network connectivity, a pattern consistent with the Matthew effect in industrial development [49, 50]. Second, the national network is less robust than the provincial average, with inter-provincial collaboration increasing systemic risk despite enhancing connectivity. Notably, robustness varies across supply chain stages, with upstream segments being the most resilient and downstream segments the most vulnerable. This discrepancy is likely due to higher business similarity in downstream sectors, which increases mutual dependencies. Third, our simulation experiments indicate that the national UAV enterprise network can tolerate targeted attacks involving up to 60% of central nodes before structural collapse becomes irreversible. Fourth, regional heterogeneity is observed, with economically developed regions such as Guangdong, Jiangsu, Beijing, and Zhejiang demonstrate stronger internal coordination. Finally, based on network disintegration patterns, provincial networks can be categorized into four structural types, namely, resilient and efficient, centralized but fragile, weakly connected and inefficient, and moderately robust. These findings provide insights into how business similarity, clustering, and network topology jointly shape the robustness of emerging industrial systems such as UAVs.
4.2 Policy implications
Building on the insights from our analysis, we reexamine the structural vulnerabilities of China’s UAV enterprise network under both normal conditions and targeted attacks. Accordingly, we propose actionable strategic recommendations at a comprehensive level for policymakers, illustrated as follows.
First and foremost, national policy should prioritize inter-provincial coordination, particularly between midstream and downstream enterprises. Our analysis conenterprises that the national UAV enterprise network, with extensive cross-regional linkages, has higher overall communication efficiency than the average provincial network. This aligns with previous studies suggesting that diversified inter-organizational ties boost adaptive capacity in technological networks [37, 56]. However, we also find that vulnerability concentrates in downstream segments, which are prone to cascading failures under targeted attacks. This fragility stems in part from the high business similarity among downstream enterprises, leading to the emergence of highly central nodes. To address this, the vertical linkages between midstream and downstream enterprises should be promoted to reduce dependency on key nodes. This can be achieved through coordinated industrial planning with cross-segment and cross-regional collaboration, especially by fostering partnerships among enterprises with complementary rather than homogeneous business scopes. Such interventions are in line with modular network design principles [57], which emphasize decentralization and functional compartmentalization. To support the implementation of these recommendations, policy tools such as the publication of industrial chain maps and subsidies for cross-regional collaboration should be considered.
Second, local governments should actively promote diversified and complementary industrial collaboration to enhance resilience against external shocks. Our provincial-level network analysis reveals that economically developed regions such as Guangdong, Jiangsu, Beijing, and Zhejiang exhibit weaker structural robustness. However, this is primarily driven by over-concentration around a few central enterprises, which increases systemic vulnerability. This pattern is consistent with empirical evidence showing that industrial clustering increases dependency on core nodes, thus increasing network fragility [7, 27]. Therefore, local governments in these regions could encourage heterogeneous business linkages that go beyond enterprises with similar scopes to decentralize critical hubs and improve structural robustness. In contrast, less developed provinces like Henan and Shandong tend to have fragmented and inefficient industrial networks, limiting their capacity for coordinated growth. Here, fostering diversified forms of collaboration can accelerate the formation of a resilient industrial ecosystem. This recommendation is grounded in research on regional innovation systems [56, 58, 59], which emphasizes that balanced network topologies improve adaptive capacity and systemic stability.
Third, category-based differentiated regional policies and interventions are essential for addressing the structural heterogeneity of China’s UAV enterprise networks. Our typological analysis classifies provincial networks into four distinct categories based on their efficiency and robustness. This typology provides a valuable foundation for targeted policy intervention, as emphasized in the literature on regional development asymmetry and adaptive industrial policy [60, 61]. In centralized but fragile regions like Guangdong, policy efforts should prioritize decentralization strategies, such as supporting secondary hubs and fostering horizontal collaborations among enterprises with complementary business scopes to reduce similarity-driven clustering. While structural upgrading is critical for inefficient and fragile regions such as Henan and Shandong. Governments in these areas should expedite infrastructure development, enhance innovation capacity, and encourage business diversification. Contrastingly, regions already displaying strong structural robustness should focus on sustaining current advantages while preparing for demand shocks and technological shifts. If well-designed and consistently implemented, these differentiated strategies can significantly enhance the structural robustness of China’s UAV sector by reducing uneven regional development.
5 Conclusion
This study investigates the structural robustness of China’s UAV enterprise operation networks using complex network models based on business similarity. Our analysis reveals that both national- and provincial-level networks exhibit scale-free characteristics, with robustness varying significantly across regions and supply chain segments. Notably, downstream enterprises, often clustered due to high business similarity, are particularly vulnerable to targeted disruptions. At the provincial level, economically developed regions tend to be more fragile due to over-concentration. We further identify four distinct types of provincial network structures, reflecting varying degrees of efficiency and robustness. These findings underscore the dual role of business similarity in fostering local coordination while also amplifying systemic risk through structural homogeneity. Policy implications highlight the importance of inter-provincial coordination, complementary inter-firm linkages, and region-specific strategies in enhancing the robustness of emerging industrial systems.
Admittedly, this work suffers from three notable limitations. First, despite its size, the Qichacha database could leave out new or unregistered UAV enterprises, which may bias the sample and underrepresent informal network users. Second, although excluding non-listed enterprises ensures data reliability, it may overlook peripheral participants that contribute to the system’s redundancy and flexibility in actual networks. Third, the analysis does not further decompose the factors contributing to business similarity or examine their differentiated effects on network robustness. These restrictions might lead to an overestimation of network vulnerability in some regions and an underidentification of adaptive structures. Future research should leverage more comprehensive datasets and investigate the heterogeneous drivers of similarity across regions to support more targeted policy interventions.
Data availability statement
Publicly available datasets were analyzed in this study. This data can be found here: https://www.qichacha.com/.
Author contributions
XZ: Conceptualization, Data curation, Formal Analysis, Investigation, Methodology, Resources, Software, Visualization, Writing – original draft, Writing – review and editing. JG: Data curation, Project administration, Resources, Supervision, Writing – review and editing. SL: Conceptualization, Project administration, Resources, Supervision, Writing – review and editing.
Funding
The author(s) declare that no financial support was received for the research and/or publication of this article.
Conflict of interest
The authors declare that the research was conducted in the absence of any commercial or financial relationships that could be construed as a potential conflict of interest.
Generative AI statement
The author(s) declare that no Generative AI was used in the creation of this manuscript.
Publisher’s note
All claims expressed in this article are solely those of the authors and do not necessarily represent those of their affiliated organizations, or those of the publisher, the editors and the reviewers. Any product that may be evaluated in this article, or claim that may be made by its manufacturer, is not guaranteed or endorsed by the publisher.
Supplementary material
The Supplementary Material for this article can be found online at: https://www.frontiersin.org/articles/10.3389/fphy.2025.1651460/full#supplementary-material
References
1. GLOBE NEWSWIRE. Unmanned aerial Vehicle (UAV) Drones Market Size expected to Reach USD 169.7 Bn by 2033 (2024). Available online at: https://www.globenewswire.com/news-release/2024/08/09/2927741/0/en/Unmanned-Aerial-Vehicle-UAV-Drones-Market-Size-Expected-to-Reach-USD-169-7-Bn-by-2033.html (Accessed March 1, 2025).
2. Magistretti S, Dell’Era C. Unveiling opportunities afforded by emerging technologies: evidences from the drone industry. Technol Anal Strateg Manag (2019) 31(5):606–23. doi:10.1080/09537325.2018.1538497
3. Nex F, Armenakis C, Cramer M, Cucci DA, Gerke M, Honkavaara E, et al. UAV in the advent of the twenties: where we stand and what is next. SPRS J Photogramm Remote Sens (2022) 184:215–42. doi:10.1016/j.isprsjprs.2021.12.006
5. Krugman P. The role of geography in development. Int Reg Sci Rev (1994) 16(1):48–62. doi:10.1177/016001769401600106
7. Becattini G. The Marshallian industrial district as a socio-economic notion. Rev Écon Ind (2017) 157(1):13–32. doi:10.4000/rei.6507
8. DiMaggio PJ, Powell WW. The iron cage revisited: institutional isomorphism and collective rationality in organizational fields. Am Sociol Rev (1983) 48(2):147–60. doi:10.2307/2095101
9. Ye D, Zheng L, He P. Industry cluster innovation upgrading and knowledge evolution: a simulation analysis based on small-world networks. SAGE Open (2021) 11(4):21582440211031604. doi:10.1177/21582440211031604
10. Humphrey J, Schmitz H. How does insertion in global value chains affect upgrading in industrial clusters? Reg Stud (2002) 36(10):1017–27. doi:10.1080/0034340022000022198
11. Gao J, Zhang W, Guan T, Feng Q, Mardani A. The effect of manufacturing agent heterogeneity on enterprise innovation performance and competitive advantage in the era of digital transformation. J Bus Res (2023) 155:113387. doi:10.1016/j.jbusres.2022.113387
12. Markets and Data. China unmanned aerial vehicle market assessment, opportunities and forecast, 2017-2031F (2024). Available online at: https://www.marketsandata.com/industry-reports/china-unmanned-aerial-vehicle-market (Accessed March 1, 2025).
13. Civil Aviation Administration of China. China civil unmanned aerial vehicle development report 2023-2024 (2024).
14. Zhou F, Wen H. Trade policy uncertainty, development strategy, and export behavior: evidence from listed industrial companies in China. J Asian Econ (2022) 82:101528. doi:10.1016/j.asieco.2022.101528
15. Jahani H, Khosravi Y, Kargar B, Ong KL, Arisian S. Exploring the role of drones and UAVs in logistics and supply chain management: a novel text-based literature review. Int J Prod Res (2024) 63:1873–97. doi:10.1080/00207543.2024.2373425
16. Al-Dosari K, Deif AM, Kucukvar M, Onat N, Fetais N. Security supply chain using UAVS: validation and development of a UAV-based model for Qatar’s mega sporting events. Drones (2023) 7(9):555. doi:10.3390/drones7090555
17. Cheng AL, Fuchs ERH, Karplus VJ, Michalek JJ. Electric vehicle battery chemistry affects supply chain disruption vulnerabilities. Nat Commun (2024) 15:2143. doi:10.1038/s41467-024-46418-1
18. Scholten K, Sharkey Scott P, Fynes B. Benefits and constraints of temporary sourcing diversification in supply chain disruption and recovery. Int J Phys Distrib Logist Manag (2020) 50(9/10):1019–41. doi:10.1108/IJPDLM-02-2020-0054
19. Bhattacharya B. A reliability based measure of structural robustness for coherent systems. Struct Saf (2021) 89:102050. doi:10.1016/j.strusafe.2020.102050
20. Dalton SK, Atamturktur S, Farajpour I, Juang CH. An optimization based approach for structural design considering safety, robustness, and cost. Eng Struct (2013) 57:356–63. doi:10.1016/j.engstruct.2013.09.040
21. Starossek U, Haberland M. Approaches to measures of structural robustness. Struct Infrastruct Eng (2011) 7(7-8):625–31. doi:10.1080/15732479.2010.501562
22. Boccaletti S, Latora V, Moreno Y, Chavez M, Hwang DU. Complex networks: structure and dynamics. Phys Rep (2006) 424(4-5):175–308. doi:10.1016/j.physrep.2005.10.009
23. Xu M, Deng W, Zhu Y, Lü L. Assessing and improving the structural robustness of global liner shipping system: a motif-based network science approach. Reliab Eng Syst Saf (2023) 240:109576. doi:10.1016/j.ress.2023.109576
24. Artime O, Grassia M, De Domenico M, Gleeson JP, Makse HA, Mangioni G, et al. Robustness and resilience of complex networks. Nat Rev Phys (2024) 6(2):114–31. doi:10.1038/s42254-023-00676-y
26. Feng Q, Zhao X, Fan D, Cai B, Liu Y, Ren Y. Resilience design method based on meta-structure: a case study of offshore wind farm. Reliab Eng Syst Saf (2019) 186:232–44. doi:10.1016/j.ress.2019.02.024
27. Delgado M, Porter ME, Stern S. Defining clusters of related industries. J Econ Geogr (2016) 16(1):1–38. doi:10.1093/jeg/lbv017
28. Liu J, Zhou M, Wang S, Liu P. A comparative study of network robustness measures. Front Comput Sci (2017) 11:568–84. doi:10.1007/s11704-016-6108-z
29. Chen Q, Wang K, Zhang Y, Guan Q, Xing J, Long T, et al. Simulation analysis on the evolution driven model of global copper ore trade network. Front Phys (2025) 13:1559799. doi:10.3389/fphy.2025.1559799
30. Xu J, Li J, Charles V, Zhao X. Evolution of the rare earth trade network: a perspective of dependency and competition. Geosci Front (2024) 15(3):101653. doi:10.1016/j.gsf.2023.101653
31. Zhang Y, Wang J, Song Y. Trade networks and corporate ESG performance: evidence from Chinese resource-based enterprises. J Environ Manag (2024) 367:122079. doi:10.1016/j.jenvman.2024.122079
32. Zhang YT, Zhou WX. Structural evolution of international crop trade networks. Front Phys (2022) 10:926764. doi:10.3389/fphy.2022.926764
33. U.S.-China Economic AND Security Review Commission. China's industrial and military robotics development (2016). Available online at: https://www.uscc.gov/sites/default/files/Research/DGI_China's%20Industrial%20and%20Military%20Robotics%20Development.pdf (Accessed March 31, 2025).
34. Chinadaily. Sky's the limit in UAV autonomous push (2024). Available online at: https://www.chinadailyhk.com/hk/article/586479 (Accessed March 31, 2025).
35. Wu Q, Su Y, Tan W, Zhan R, Liu J, Jiang L. UAV path planning trends from 2000 to 2024: a bibliometric analysis and visualization. Drones (2025) 9(2):128. doi:10.3390/drones9020128
36. Barabási AL, Albert R. Emergence of scaling in random networks. Science (1999) 286(5439):509–12. doi:10.1126/science.286.5439.50
37. Watts DJ, Strogatz SH. Collective dynamics of ‘small-world’ networks. Nature (1998) 393(6684):440–2. doi:10.1038/30918
38. Evans TS, Chen B. Linking the network centrality measures closeness and degree. Commun Phys (2022) 5(1):172. doi:10.1038/s42005-022-00949-5
39. Freeman LC. A set of measures of centrality based on betweenness. Sociom (1977) 40(1):35–41. doi:10.2307/3033543
40. Freeman LC. Centrality in social networks: conceptual clarification. Soc Netw (1978) 1:215–39. doi:10.1016/0378-8733(78)90021-7
41. Bonacich P. Some unique properties of eigenvector centrality. Soc Netw (2007) 29(4):555–64. doi:10.1016/j.socnet.2007.04.002
42. Gutiérrez J, Monzon AJMP, Piñero JM. Accessibility, network efficiency, and transport infrastructure planning. Environ Plan A (1998) 30(8):1337–50. doi:10.1068/a30
43. Labi S, Faiz A, Saeed TU, Alabi BNT, Woldemariam W. Connectivity, accessibility, and mobility relationships in the context of low-volume road networks. Transp Res Rec (2019) 2673(12):717–27. doi:10.1177/0361198119854091
44. Newman ME. Power laws, pareto distributions and Zipf’s law. Contemp Phys (2005) 46(5):323–51. doi:10.1080/00107510500052444
45. Powell WW, White DR, Koput KW, Owen-Smith J. Network dynamics and field evolution: the growth of interorganizational collaboration in the life sciences. Am J Sociol (2005) 110(4):1132–205. doi:10.1086/421508
46. Winecoff WK. “The persistent myth of lost hegemony,” revisited: structural power as a complex network phenomenon. Eur J Int Relat (2020) 26(1_Suppl. l):209–52. doi:10.1177/1354066120952876
47. Nair A, Vidal JM. Supply network topology and robustness against Disruptions–An investigation using multi-agent model. Int J Prod Res (2011) 49(5):1391–404. doi:10.1080/00207543.2010.518744
48. Xu J, Zhang B, Lu J, Yu Y, Chen H, Zhou J. Agri-food supply chain concentration and financial growth: configuration and congruence approaches. Int J Phys Distrib Logist Manag (2024) 54(9):936–66. doi:10.1108/IJPDLM-01-2024-0038
49. Chen K, Guan J. Mapping the innovation production process from accumulative advantage to economic outcomes: a path modeling approach. Technovation (2011) 31(7):336–46. doi:10.1016/j.technovation.2011.03.004
50. Santoleri P, Russo E. Spurring subsidy entrepreneurs. Res Pol (2025) 54(1):105128. doi:10.1016/j.respol.2024.105128
51. Carlson JM, Doyle J. Complexity and robustness. Proc Natl Acad Sci (2002) 99(Suppl. 1):2538–45. doi:10.1073/pnas.012582499
53. Vedres B, Stark D. Structural folds: generative disruption in overlapping groups. Am J Sociol (2010) 115(4):1150–90. doi:10.1086/649497
54. Albert R, Jeong H, Barabási A-L. Error and attack tolerance of complex networks. Nature (2000) 406(6794):378–82. doi:10.1038/35019019
55. Chen F, Jiang G, Gu M. Supply chain digitization and energy resilience: evidence from China. Energy Econ (2025) 144:108420. doi:10.1016/j.eneco.2025.108420
56. Lamin A, Dunlap D. Complex technological capabilities in emerging economy firms: the role of organizational relationships. J Int Manag (2011) 17(3):211–28. doi:10.1016/j.intman.2011.05.004
57. Simon HA. The architecture of complexity. Proc Am Philos Soc (1962) 106(6):467–482. Available online at: https://www.jstor.org/stable/985254 (Accessed March 31, 2025)
58. Cooke P, Uranga MG, Etxebarria G. Regional innovation systems: institutional and organizational dimensions. Res Pol (1997) 26(4-5):475–91. doi:10.1016/S0048-7333(97)00025-5
59. Blanco V, Luthe T, Bruley E, Grêt-Regamey A. Aligning social networks and co-designed visions to foster systemic innovation in the alps. Reg Environ Change (2023) 23(3):102. doi:10.1007/s10113-023-02099-y
60. Martin R, Sunley P. On the notion of regional economic resilience: conceptualization and explanation. J Econ Geogr (2015) 15(1):1–42. doi:10.1093/jeg/lbu015
Keywords: unmanned aerial vehicle, multi-layer complex network, targeted attacks, topological characteristics, structural robustness
Citation: Zhang X, Guo J and Liu S (2025) Structural robustness of China’s UAV enterprise network: a national and provincial analysis based on business homogeneity. Front. Phys. 13:1651460. doi: 10.3389/fphy.2025.1651460
Received: 21 June 2025; Accepted: 23 July 2025;
Published: 26 August 2025.
Edited by:
Ze Wang, Capital Normal University, ChinaReviewed by:
Xin Xu, Nanjing University of Finance and Economics, ChinaTiago Novaes Mathias, Port and Airport Research Institute, Japan
Yun Jiang, China Special Vehicle Research Institute, China
Copyright © 2025 Zhang, Guo and Liu. This is an open-access article distributed under the terms of the Creative Commons Attribution License (CC BY). The use, distribution or reproduction in other forums is permitted, provided the original author(s) and the copyright owner(s) are credited and that the original publication in this journal is cited, in accordance with accepted academic practice. No use, distribution or reproduction is permitted which does not comply with these terms.
*Correspondence: Jianfeng Guo, Z3VvamZAY2FzaXBtLmFjLmNu