 Ming Lv1
 Zijing Gao
- 1College of Biochemical Engineering of Beijing Union University, Beijing, China
- 2Global Energy Interconnection Group Co., Ltd., Beijing, China
- 3State Grid Economic and Technological Research Institute Co Ltd., Beijing, China
The construction of the global energy internet is a significant way to develop clean energy and the key to achieving the goal of carbon neutrality. This study aims to the feasibility of trans-national and trans-continental development of energy interconnection. The trend of regional power grid interconnection is accelerating, and the influence of energy interconnection on global economic and social development is increasing. The prior literature is absent on technical issues such as energy transmission, storage, sharing, and system issues such as power trading, overall architecture, and data collection. This paper presents the contribution of an utterly systematic model and method for evaluating the comprehensive benefits of energy interconnection and analyzes the comprehensive benefits of energy interconnection development from multiple dimensions in economics, society, resources, and links. This paper takes the economic and clean energy development system in Southeast Asia as an example to make the system simulation, designs scenarios of quick, steady and slow carbon peaking & neutrality, and evaluates the comprehensive benefits under the three economic development modes using the evaluation model. The result presented that the development of energy interconnection has an apparent positive effect on economic growth, eliminating the people lacking electricity, poverty, and other social problems, improving resource utilization efficiency, and the ecological environment. The method proposed in this paper for evaluating the benefits of solving energy interconnection issues is practical and feasible and offers adaptable policy insights for regions at different development.
1 Introduction
Global energy development is facing severe challenges such as resource shortage, environmental pollution, climate change and unbalanced development, which bring a serious threat to the survival and development for human beings. The Paris Agreement provides a framework for the global response to climate warming after 2020. 178 parties have been implementing carbon emission reductions to promote carbon neutrality and carbon peaks.
In order to achieve the goal of carbon neutrality, the fundamental solution is to accelerate the development of clean energy and the promotion of energy transformation. Building a global energy interconnection is a newly clean and green way to meet the global electricity demand, a global solution to solve the severe challenges of energy development, and a new blueprint for the green and low-carbon development of the world energy. Global energy interconnection is a globally connective, strong and smart grid based on ultra-high voltage backbone network frame, and a basic platform of clean energy for globally large-scale development, transmission, and use. The essence of global energy interconnection is to build up an energy community and human destiny community, which gets strongly supports from United Nations and other relevant parties.
However, in the literature [1], the implementation of the global energy interconnection has faced some resistance and has been questioned in several aspects such as ultra-high voltage long-distance transmission technology, geopolitical resistance and economic and environmental feasibility, which need to be studied systematically and comprehensively. The investment of regional energy interconnection construction is huge. In the short term, the investments are difficult to recoup, but in the middle and long term, regional energy interconnection construction is good to eliminate the population lacking electricity, promote the regional economy and employment, improve the efficiency of energy utilization and reduce the harmful gas emissions. At present, there is no specific and explicit study of the construction effects of energy interconnection on economy, resource, environment and society, and there is also not a set of scientific and systematic model and comprehensive benefit evaluation system of energy interconnection development to make comprehensive study in terms of cross system science, information science and economics.
There are great advantages and feasibility of the System Dynamics theory to analyse the comprehensive benefits of trans-national and trans-continent clean energy transmission channels. First, the System Dynamics theory solves the problem of multi-factor interaction. The trans-national and trans-continent clean energy transmission channels involves subsystems such as economics, environment, resource utilization, scientific and technological innovation, people’s livelihood and social problems, and the variables in each subsystem are interaction with complex relationships. Based on this situation, the System Dynamics theory is a structure model showing the relationship between the variables, making the decision and simulating the state transition process of the system based on state variables as the center and speed variables as the drive. In addition, the System Dynamics theory deals with the qualitative information existed in the analysis. Compared with the traditional analysis with no quantitative research for the problem such as social influence and concepts, the System Dynamics theory is a kind of system thinking, system analysis, quantitative and qualitative combined method and integrated and reasoning combined method, making up for the limitation of the traditional quantitative research methods to simulate the complex and large system easily, in particular, analyze and test problems which are difficult to quantification, so that to analyze and research the system in the case of data insufficient. Finally, the System Dynamics theory can be used for policy analysis and simulation. As a soft science research problem, the comprehensive benefits of trans-national and trans-continent clean energy transmission channels can’t be tested in the laboratory like natural science. The System Dynamics theory as a “lab” of economic and social problems, has the characters of policy experiment and social laboratory, for example, changing policy variable parameters and variable initial values of the model, making the assumption.
The paper builds a comprehensive benefit evaluation model based on the System Dynamics theory for highly nonlinear, high-order, multi-variable and multi-feedback energy interconnection complex systems. First of all, there is a comprehensively analysis about the effects and benefits brought by the regional interconnection construction in terms of economic, social, resource and environmental aspects. Then, the relationship between each factor and the feedback mechanism are analyzed, the weight is determined by combining the analytic hierarchy process, and the comprehensive benefit evaluation model is established. Finally, the typical situation in Southeast Asia is analyzed and verified through the evaluation model, and then the recommended development model is provided. The findings are that the development of energy interconnection plays a positive role in driving economic growth, eliminating social problems such as population lacking electricity and poverty, and improving the efficiency of resource utilization and ecological environment. There should be scientific positioning and systematic planning when choosing the quick carbon peaking & neutrality scenario.
2 Literature review
This section includes the review on energy interconnection and energy system dynamics model.
2.1 Energy interconnection
The development of global energy interconnection is becoming more and more important to the development of global economic and social, which has received attentions increasingly at present. Wang [2] proposed the solutions of realizing the sustainable development of world energy, and analyzed the comprehensive benefits of constructing the global energy Interconnection [3]. put forward a comprehensive benefits assessment method of different new energy generation technologies for global energy Internet development, in order to evaluate the importance of clean energy to the global energy interconnection. Yang et al. [4] divided the development stages of the global energy interconnection and evaluated the indicators of grid interconnection based on analysis of research data and key indicators. According to cluster analysis, there were six development stages of the global energy interconnection. Electric vehicles were one of the most important links between electric power system and transportation system under the power grid development stage. Dai [5] analyzed the development status of electric vehicles and wireless charging technology in China and provided an innovative idea for the integration of electric power system and transportation system under the future unified power grid framework. Zhou et al. [6] systematically studied the energy interconnection from the perspective of business. The four development stages of energy system were decentralized energy system, centralized energy system, distributed energy system and intelligent interconnected energy system, while energy network was the innovative development mode of energy system. Wei et al. [7] analyzed the overall framework model of urban energy interconnection from the aspects of energy supply, consumption form, energy transport, decision management and public service. Cheng et al. [8] solved the problem of uncertainty condition of boundary in the power grid planning by collecting interconnection information and studied the data collection methods in terms of renewable energy, climate, economy and energy network planning.
The technology problem of energy interconnection is also a hot topic of energy interconnection research. Alexander et al. [9] believed that energy storage system can be used for short-term control (such as power grid frequency control), medium-term balance mechanism (transforming daily production to meet demand), or long-term storage (seasonal transfer) and instead of grid expansion. Smart grid was the infrastructure of the modern grid, Kolokotsa [10] integrated buildings and communities into smart grid and solved the technological problem of the smart grid. The future smart grid must realize the vision of sharing energy interconnection by millions of people in their own homes, offices and factories with others. Wu et al. [11] believed that grid interconnection technology can transform the power grid into an external grid for energy sharing. Sun et al. [12] evaluated the accuracy of the routing function design and transmission stability of the energy network and verified the proposed energy function sector through theoretical analysis and experimental simulation. Hao et al. [13] proposed two distributed interaction algorithms for both islanded and grid-connected modes where the price signal motivates aggregators can adjust power consumption and generation: one is Privacy-preserving gossip algorithm which can avoid disclosing local privacy in islanded interaction, another is Perturbation primal-dual sub-gradient method which can optimize distributed demand response (DDR) considering global predetermined unequal constraints. Kwon et al. [14] built a variety of scenarios including renewable energy capacity, interconnection measures and reinforcement measures, and then, database creation and simulation are performed semi-automatically to optimize and reinforce future Korean power systems using Power System Simulator for Engineering (PSS/E) and Python by a dynamic model based on inverter-based resources.
Global energy interconnection solved the problem of asynchronous between renewable resource and load center allocation through intercontinental grid interconnection, Liu, et al. [15] put forward the decision framework of power generation and transmission under the background of global energy interconnection, analyzed the influence factors of investment decision, and proposed the corresponding suggestions and models. In order to improve the efficiency and flexibility of energy interconnection, Zhong et al. [16] proposed an SDEI framework within the SDN methodology of energy interconnection and built a programmable structural system in the energy router grid by using the SDN method, which improved the energy efficiency and the green energy utilization. Xi et al. [17] proposed an equilibrium model containing each energy subsystem objective and maximum social welfare for improving the operation of the electricity, gas and district heating subsystems of a district or urban area. Yang et al. [18] modeled the planning profit models of electricity network and gas network and a dynamic game model for the joint planning of electricity-gas integrated energy system based on the analysis of the game mechanism of different investors, at last, the iterative search method was used to solve the model to propose a joint planning method of electricity-gas integrated energy system. Peng et al. [19] constructed distributed integrated energy system by a hierarchically partitioned structure of urban integrated energy system based on distributed autonomy and centralized coordination and a hierarchically partitioned master-slave game optimization model based on game theory.
Liu [20] found that transnational, transcontinental and long-distance power transmission is an important form of global energy interconnection. The development trend of the current stage is to build transnational and transcontinental grid interconnection projects and to form regional energy interconnection at first. In the literature Liu [21], the feasibility and necessity of intercontinental power grid interconnection was demonstrated. Super Grid plans of Europe is to build a power transmission, carrying and consuming platform in Europe; The DESERTEC power project launched by Germany is to develop solar energy resources in Northern Africa and to carry out inter-continental grid interconnection research between North Africa and Europe. The Australian research institute Grenatec Research [22] also proposes the idea of pan-Asian energy interconnection to realize the joint absorption of Australian clean energy in Southeast Asia and even in the whole East Asia.
Some scholars are evaluating which way of energy interconnection is better [23], pointed out the renewable energy based hybrid systems is more feasible through comparing submarine cable interconnection and renewable energy based on hybrid system development for 132 islands of Philippine. Pavievi et al. [24] constructed two models to evaluate the cost-effective decarbonisation strategy of cross-sectoral linkages: one is a long term planning multisectoral model, another is a unit commitment and optimal dispatch model covering multiple energy sectors such as power, heating & cooling, transportation, etc. At last, the data from Europe-wide energy systems showed that the transport sector provides the highest flexibility potential in terms of power curtailment, load shedding, congestion in the interconnection. Wang et al. [25] believe that transnational power grid interconnection, as a measure of energy Internet, can meet the global power demand in a clean and green way and promote the UN’s concept of “sustainable energy,” but it is very important to build a risk assessment index system including 10 indexes such as national relation, public participation, and available transmission capacity because of the complex and variable risks of transnational power grid interconnection. However, relevant studies only assume a specific case of power interconnection project at present, and there is still lack of systematic evaluation model to quantify the benefits of regional energy interconnection.
The construction of regional energy interconnection brings many comprehensive benefits. In terms of social aspects, in the literature Grenatec Research [22], based on the multi-country and multi-sectoral dynamic conditions, the general equilibrium model is computed, the evaluation index system of economic and social benefits is established, and the quantitative analysis of economic and social benefits of each continent is carried out. In the literature Jin et al. [26], an evaluation system of social benefits is constructed based on the pressure-status-response model, and the impacts of energy interconnection construction on social benefits through clean energy replacement, power grid optimization and power substitution are evaluated by using smart grid construction data of China.
In terms of economic aspects, Xiaoxia et al. [27], Zhang et al. [28] and [29]. identified the factors effecting the transmission cost and the benefit of energy interconnection. Alves et al. [30] modeled the power systems of the islands of Pico and Faial in Azores, the results showed that RES penetration can increase 50 percentage points by 2030 because of using energy plan to interconnect the isolated power systems of islands. Purvins et al. [31] believe that long distance power transmission is an option for reducing carbon footprint in future electricity systems, such as an electricity trading route crossing the interconnected countries: Turkey, Georgia, Azerbaijan and Kazakhstan, the economic benefit may compensate investments between 1598 M€ and 3251 M€ needed for the additional power transmission capacities over a life-cycle period of 40 years. Breyer et al. [32] pointed out that the benefits of a global energy interconnection is popular, energy interconnected globally would be 4% lower than an isolated system if world is divided into 9 major regions and the major regions comprise of 23 regions.
In terms of the environment aspect, in the literature Zong [33], the self-balancing scenario and power interconnection scenario of global power development are set up. By establishing a global energy interconnection environmental benefit index system, the benefits of power interconnection in terms of resource conservation, convention pollutant emission reduction and climate change, etc. are quantitatively evaluated. In terms of relative benefits aspect, in the literature Zhao et al. [34], the costs and benefits of the global energy interconnection construction and the reforming progresses of the China’s power industry marketing characteristics are analyzed and evaluated, and the external effects of the development of energy interconnection are analyzed. IEC [35] analyzes impact of energy interconnection on energy supply, the environment, technologies, policies and standards development. Wang et al. [36] established an optimized model to verify the energy trading interconnection in southern China can yield significant energy, economic, environmental and interconnection benefits. Fan et al. [37] proposed a power gird interconnection model using linear programming techniques to minimize overall system costs due to the difference in the countries’ power system, and four power grid interconnection programs in Northeast Asia is proved that power grid interconnection can bring environment and economic benefits. The object of energy interconnection benefit in current research is limited to a certain aspect of economy, society and environment, and the research method is relatively simple, which is lack of a comprehensively analysis on the development of regional energy interconnection.
Current research on the assessment of transnational energy interconnection typically focuses on single-dimensional analyses in the economic or environmental domains, such as quantifying the cost-effectiveness of carbon emission reduction, conducting research on technical feasibility, or testing the stability of cross-border power transmission. The research methods employed are relatively simplistic, failing to provide a comprehensive analysis of the development of regional energy interconnection. Some models have not decoupled the mutual feedback mechanisms between social factors like employment growth and improvements in people’s livelihoods, which may lead to imbalances in policy design and consequently overlook social benefits. Meanwhile, certain analytical frameworks, due to their rigid setting of parameters related to economic or environmental policies, cannot adapt to the dynamic changes in technology and policies. Therefore, there is an urgent need to construct a comprehensive and dynamic assessment model and methodology that integrates economic, social, and environmental benefits to analyze the complex interactions and nonlinear effects of various factors in the development of regional energy interconnection.
This study constructs a System Dynamics model targeting employment creation, environmental improvement, and energy equity in Southeast Asia. It innovatively proposes a comprehensive benefit evaluation methodology for regional energy interconnection spanning economic, social, resource, and environmental dimensions. The model explicitly elucidates the energy transition mechanism whereby clean energy investments drive employment growth, increase incomes, and enhance environmental quality. Furthermore, it enables dynamic policy simulations—such as carbon taxes and environmental subsidies—capturing their nonlinear effects under varying economic development levels and clean energy adoption scenarios, overcoming the limitations of static policy assumptions in conventional models.
By integrating social equity into the multi-dimensional benefit assessment framework of energy transition, this research advances a coupled theory of economic-social-energy systems. It provides Southeast Asia with sustainable development pathways that simultaneously meet rigid emission constraints and social equity imperatives, thereby resolving the dilemma between decarbonization and poverty alleviation in developing regions.
2.2 Energy system dynamics model
System dynamics (SD) is a methodology and mathematical modeling technique to frame, understand, and discuss complex issues and problems for understand the behavior of complex systems over time. Wang et al. [38] presented a novel approach which integrates object-orientation and systems-dynamics to information modeling of socio-tech systems. In term of the power system aspect, in the literature Vernotte et al. [39], a system dynamics model was developed for simulation of the power system behavior. [40] produced an efficient state prediction method based on system dynamics, utilizing a statistical approach called the M-Estimation to resolve the filtering problem. Besides [41], developed a simulation system for modeling the behavior of the power plant. Moreover, SD can be also used throughout the public and private sector for policy analysis and design. In the literature of Mora et al. [42], the adequacy of using systems dynamics method to complement the knowledge on the designing making support system implementation processes have been proved.
The remarkable characteristic of this method is that it can integrate non-linear causality and feedback among many factors. Therefore, it has obvious advantages in dealing with comprehensive systems affected by many factors. Gu et al. [43] proposed a model by making an organic integration of system dynamics and entropy weight method, a simulation model for the evaluation of the planning scenario is built based on system dynamics, and then technical economic indicators with a time scale could be yielded. In the literature Wu et al. [44], the cost of low-carbon power technology and transaction expenses of the carbon trading mechanism was introduced into the planning of interconnection while considering the emergence of new factors and their impact on the power system interconnection under the condition of low-carbon economy. Khansari et al. [45] provided a comprehensive system model, which is based on the system dynamics approach, to address the issue of global warming, in terms of households’ energy consumption behaviors. Oluic et al. [46] present a system dynamics simulator to illustrate the behavior of various factors related to the three pillars (social, economic, and environmental) and factor relationships associated to a specific problem.
3 Methods
This section includes the proposed method, Energy System Dynamics model, System hypothesis and parameter setting, the construction of regional energy interconnection System Dynamics model, Main equations of System Dynamics, and Evaluation process of regional energy interconnection comprehensive benefit.
3.1 System dynamics modeling theory
Fan and Pan [47], SD is an analytical technology for quantitative simulating study of nonlinear, multiple feedback and complex time-varying system by computer based on feedback control theory proposed by professor J. W. Forrester of the Massachusetts institute of technology (MIT) (see [48] and [49]). This study is to deal with complex system problems in terms of social, economic, ecological and biological, and comprehensively study the large-scale systems with the characters of complex, multi-level, multi-sectoral and non-linear at macro and micro levels.
Broad sense of system includes open loop system and feedback system, and social and economic system belongs to information feedback system, which is influenced by the historical behaviors of the system and gives the consequences of historical behaviors back to the system correspondently to influence the future behaviors.
SD supposes all of the system motions in the world are fluid motions, and represents the structure of the system using causal and system flow diagrams. The causal diagram can clearly express the nonlinear causal relationship within the system. The causal relationship graph takes the feedback loop as its constituent element and the feedback loop are series of closed paths of causes and results.
The flow graph of the system is the basis of the System Dynamics model, which can represent the feedback relationship in the system, and composed of specific symbols to represent the correlation between the variables in the causal relationship loop. The system flow graph consists of three elements: state variable, rate variable and information, and the relationships between variables are defined by formulations. The relationship between state variables and rate variables is a first-order differential equation, and the entire System Dynamics model is a series of nonlinear equations, as shown in Formula 1:
Where x is the state variable vector, p is a set of parameters, and f is a nonlinear vector function. The formula is time lag because the vector x and other parameters are functions with the value at the previous moment.
Figure 1 shows the typical flow diagram of a feedback loop system. As shown in the figure, there should be explicit arithmetic expressions of the influx and outflux of substances, energy and information, etc. These expressions form the right term of Equation 2 and the relationships can be shown as integral equal:
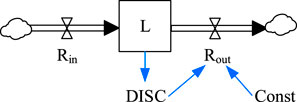
Figure 1. Feedback system flow diagram.
Where L(t) represents the state variable Lat the moment of t, L0 represents the initial value of L, Rin represents the input flow of the state variable and Rout represents the output flow of the state variable. The integral equation above shows that the value of the state variable at time t is equal to the initial value of the state variable plus the integral of the net flow changing over time [0, t].
3.2 Applicability analysis
Hou [50] analyzed the regional energy interconnection, which involves various factors of economic and social development, and its benefit evaluation is a complex system problem of highly non-linear, high-order, multi-variable and multi-feedback. The System Dynamics can deal with the problem well and explore the problem at both macro and micro levels. The main expresses are:
Solving the problem of multi-factor interaction - Fan and Pan [47], regional energy interconnection involves the subsystems of economic, environment, resource utilization, scientific and technological innovation, the people’s livelihood and society. There are interactions between various factors in the subsystems and the relationships between factors in the subsystems are complex. The structural model of System Dynamics takes state variables as the center and speed variables as the drive, clearly shows the effects and relationships between the factors and applies decision to simulate the state transition process of the system.
Qualitative information in the process and analysis - [51] explored the advantages of System Dynamics. In the traditional analysis, quantitative research of social influence and concept cannot be implemented, but System Dynamics makes up for the limitations of the traditional quantitative research method through system thought, system analysis, quantitative and qualitative combined, integration and inference combined. It is easy for the System Dynamics to simulate the complex and large system, especially involving the problems which cannot be quantified easily into the system structure to do analysis and test. Besides, the system analysis and research can be implemented in the case of insufficient data.
Policy analysis and simulation - Zuo and Chen [52] discussed comprehensive benefit of regional energy interconnection is a soft science research problem, which cannot be tested in the laboratory like natural science, but System Dynamics as the “laboratory” of economic and social problems, can change the policy variable parameters of the model and the initial value of variables, to carry out the policy environment condition assumption, policy planning, scenario analysis, sensitivity analysis and policy comparison under different conditions. In addition, System Dynamics carries out the dynamic simulation experiment to accurately reflect the system affected by internal and external environment, and the problem solving is straight, vivid, strongly man-machine dialogue functional. It’s easily and directly to dialogue with policymakers, which has the characters of policy experiment and social laboratory.
3.3 System hypothesis and parameter setting
3.3.1 Model boundaries
The general steps of System Dynamics model studied by Zhong et al. [16], the boundary of the system should be first determined,The time boundary of the system dynamics model in this study is set as 2005–2050, covering the critical stages of carbon peaking and carbon neutrality in Southeast Asia. The geographical boundary focuses on the 10 Southeast Asian countries. Because the regional energy interconnection is affected by many factors and to highlight the major benefits of the regional energy interconnection, the System Dynamics model can be divided into economic benefit subsystem, environment benefit subsystem, resources benefit subsystem and social benefit subsystem, within them, the four subsystems respectively depict the comprehensive benefits of regional energy interconnection in four aspects of economy, environment, resources, and society. The basic assumptions of the model include:
Assuming that the region’s economic development is stable without major social fluctuations, severe economic crisis and other emergencies, multiple regressions can be carried out through the situations of recent 15 years to predict the comprehensive benefits of regional energy interconnection.
Assuming that local governments, power departments and enterprise managers are all “rational brokers” and all of them follow the general laws of economic market development.
Assuming that the government will impose environmental tax and carbon tax in appropriate years in order to protect the local environment and tackle the climate change.
3.3.2 Parameter setting
The basic parameters of the model include: The data about generation capacity of clean energy comes from Southeast Asia Energy Interconnection Planning Research Report (GEIDCO); The data about current situation and forecast of GDP comes from the ASEAN energy center; The data about population status and prediction comes from the United Nations; Trend of Levelized Cost of Energy (LCOE), detailed information is shown in Figure 2. Data come from the Southeast Asia Energy Interconnection Planning Research Report (GEIDCO).
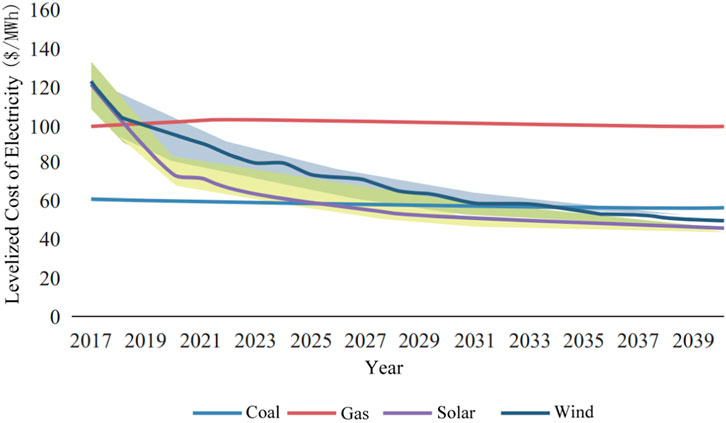
Figure 2. Trend of LCOE.
Detailed data information on other model parameters can be found in Supplementary Appendix 1.
3.4 The construction of regional energy interconnection system dynamics model
The benefit analysis of regional energy interconnection is mainly divided into four aspects: economic benefit, social benefit, resource benefit and environmental benefit. The detailed feedback relationships of the four subsystems are shown in the Supplementary Appendix.
3.4.1 Economic benefit subsystem
The construction and development of regional energy interconnection first generates economic benefits and has a strong relationship with local GDP and infrastructure investment. The main feedback relationships in the economic subsystem include:
1. Economic efficiency index → + regional GDP annual growth rate → + regional GDP total amount → + electric power growth GDP → + economic benefit index
2. Carbon dioxide emission quota → + benefits of carbon emission right→ + total profit → + economic benefit index
3. The proportion of clean energy in power infrastructure investment → + the proportion of clean energy generation in total power generation → + clean energy generation → + unit power supply cost of clean energy → + economic benefit index
4. The proportion of clean energy in power infrastructure investment → + the proportion of clean energy generation in total power generation → + the investment of power infrastructure → + the amount of clean energy investment → + unit power supply cost of clean energy → + economic benefit index
3.4.2 Environmental benefit subsystem
Regional energy interconnection development plays an important role in reducing pollutant emissions and protecting the local ecological environment.
The environmental benefit subsystem reflects the overall situation of energy interconnection development in reducing regional pollutant emissions and measures the improvement of regional environment. The main feedback relations in the system include:
1. The proportion of clean energy generation in total power generation → + clean energy generation → + carbon dioxide emissions reduction from alternative clean energy generation → + total carbon dioxide emission reduction → + environmental benefit index
2. The proportion of clean energy generation in total power generation → + clean energy generation → + sulfur dioxide emissions reduction from alternative clean energy generation → + environmental benefit index
3. The proportion of clean energy generation in total power generation → + clean energy generation → + nitrogen oxides emissions reduction from alternative clean energy generation →+ environmental benefit index
4. The proportion of clean energy generation in total power generation → + clean energy generation → + solid waste emissions reduction from alternative clean energy generation → + environmental benefit index
3.4.3 Resource benefit subsystem
The development of energy interconnection has a significant effect on the regional resource utilization efficiency. By developing clean energy, reducing local fossil energy consumption and water consumption, the local resource utilization efficiency is improves. The main feedback relationships in the resource benefit subsystem include:
1. The primary energy transformation efficiency of clean energy → + primary energy transformation efficiency → + resource benefit index
2. Electric vehicle ownership → + total mileage of electric vehicles → + fuel saving by electric vehicles → + fossil energy consumption reduction by electric vehicles → + resource benefit index
3. The proportion of clean energy generation in total power generation →- the proportion of coal power generation in total power generation → + total resource utilization efficiency → + resource benefit index
4. The increasing amount of electricity consumption in the whole society → + newly power generation → + total power generation → + clean power generation → + fossil energy consumption reduction → + resource benefit index
3.4.4 Social benefit subsystem
The construction of power infrastructure requires a large number of labor forces and technology talents. At the same time, the development of power grid plays an important role in promoting local employment, poverty reduction and resident’s livelihood, besides that, it also eliminates the population lacking electricity and improves the living and medical level of the local resident.
The social benefit subsystem is mainly affected by the number of newly employment, the number of people lacking electricity and the proportion of science and research inputs in the total profits. The main feedback relations in the system include:
1. Population growth rate → + regional population → + per capita GDP → + newly employment → + social benefit index
2. The proportion of clean energy in power infrastructure investment → + the proportion of clean energy generation in total power generation → + the newly installed capacity → + the newly employment number → + social benefit index
3. Government levy coefficient → + power public welfare fund → + population lacking electricity → + social benefit index
4. Network loss rate → - total power generation → + the newly installed capacity → + the newly employment number → + social benefit index
As an index to evaluate the comprehensive benefits of establishing the regional energy interconnection, the comprehensive benefit index of regional energy interconnection is affected by economic benefit index, environmental benefit index, resource benefit index and social benefit index and the four benefit indexes are obtained by weighted average. Finally, the System Dynamics causal model can be constructed, and Figure 3 showed a simplified representation of the above relationships from four subsystems.
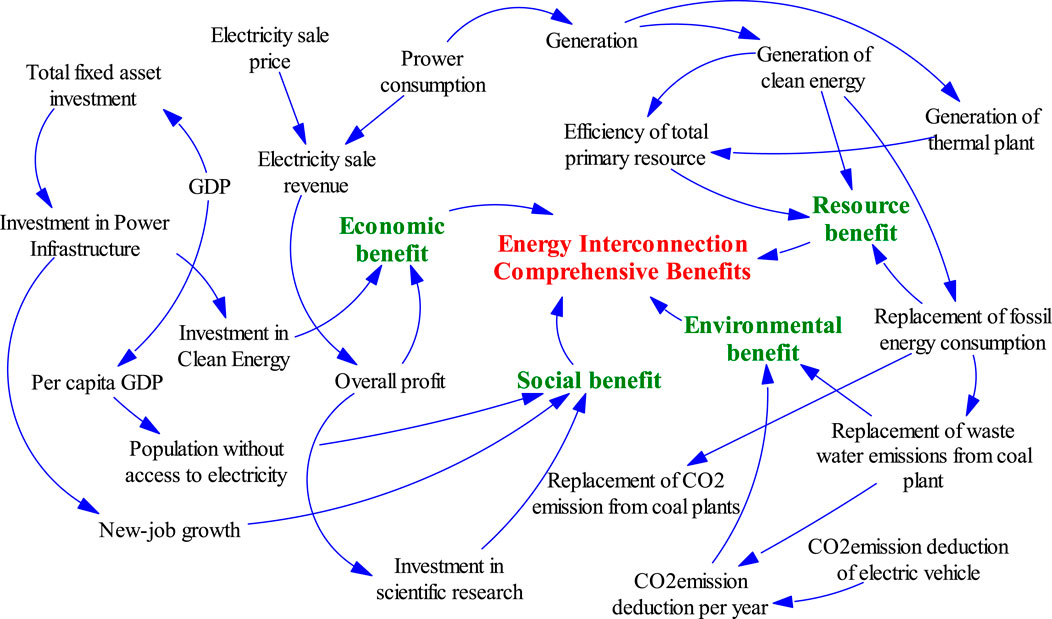
Figure 3. System dynamics causal model.
3.5 Main equations of system dynamics
3.5.1 Economic subsystem
The increasing of electricity consumption GDPe can be calculated by the whole society electricity consumption increasement, total electricity consumption and total GDP, as shown in Formula 3:
Among them, GDPe is the growth GDP of electricity consumption, Cnew is the increase of social electricity consumption, Call is the total electricity consumption and GDP is the regional total GDP.
Benefits of carbon emission right Bc is determined by the unit price of carbon tax, carbon dioxide emissions and carbon dioxide emission quota. The Formula 4 is as follows:
Among them,
3.5.2 Environment subsystem
Carbon dioxide emissions reduction can be calculated from clean energy generation, as shown in Formula 5:
Among them,
The reduction of sulfur dioxide emissions is mainly determined by the alterative clean energy generation. The calculation Formula 6 can be expressed as:
Among them,
3.5.3 Resource subsystem
The primary energy conversion efficiency Tr can be calculated by the proportion of clean energy generation and the proportion of fossil energy generation, as shown in Formula 7:
Among them, Pc is the proportion of clean energy generation and Pth is the proportion of fossil energy generation. Pth can be further subdivided into two sub-items: the proportion of coal-fired power generation and the proportion of gas-fired power generation, i.e., Pth = Pcoal + Pgas. The relevant data are all obtained from the Data & Statistics database under the International Energy Agency (IEA). The primary energy conversion efficiency of clean energy
Fuel saving of electric vehicles OEV can be calculated by the unit fuel consumption of vehicles and the annual mileage of electric vehicles, as shown in Formulas 8, 9:
Among them,
3.5.4 Social subsystem
Research investment is calculated by the total income of the power industry and the research input factors, as shown in Formulas 10, 11:
Among them,
The newly employment in the power industry is determined by the annual increase of various types of installed power facilities and the production, construction, operation, maintenance and fuel supply factors of each type of installed power facilities, as shown in Figure 4. Further considering the technological progress factor and introducing attenuation factor, the calculation Formula 12 of newly employment in the power industry is as follows:
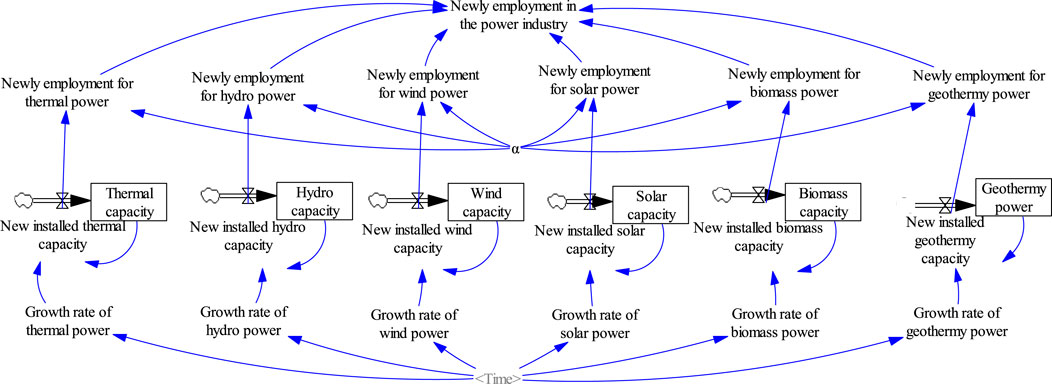
Figure 4. Calculation model of new employment.
Among them,
The above parameters are specifically applied in Formula 13 to calculate the newly employment in the power industry. The attenuation factor
3.6 Evaluation process of regional energy interconnection comprehensive benefit
This study uses regression analysis and analytic hierarchy process to quantify the comprehensive benefits of regional energy interconnection in terms of economy, society, environment and resources. The overall research process is shown in Figure 5.
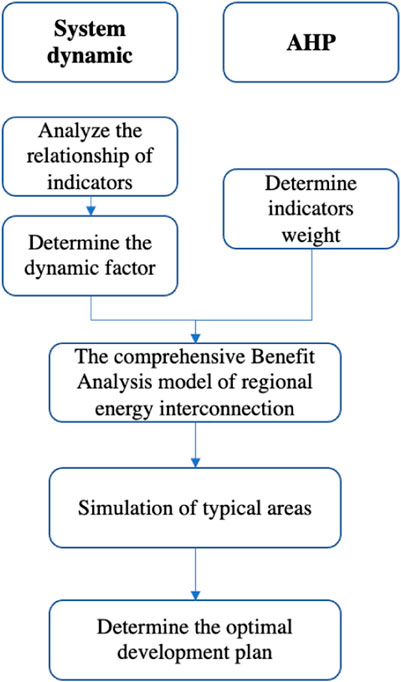
Figure 5. Research flow diagram.
The equations between different factors can be obtained by regression analysis of historical data, and the relational expression can be calculated by the regression analysis tool. If Multiple R is greater than 0.95 and the error P value is less than 0.05, it can be considered that there is a linear relationship between the indicators and the relational expression can be determined.
The paper uses the maximum and minimum normalization method to obtain the normalization results of the related indexes of each benefit index. The principle of the method is to carry out linear transformation of the original data in order to make the final result falling within the range [0,1]. The transformation formula is as follows:
If the index x is positive related to the benefit index, this is calculated using Formula 14,
If the index x is positive or negative relative to the benefit index, this is calculated using Formula 15,
Among them,
The weight of each factor is determined by the analytic hierarchy process [56]. By means of the score results of relevant experts, the weight of each benefit index is calculated by comparing the relations of importance among various factors, then further obtains the calculation results of each benefit index.
4 Results
4.1 System authenticity inspection
The overall model of the study is based on the Vensim software, and the input variables are related parameters, which are established in terms of equations within the software. To meet the requirements for research reproducibility, some of the data involved in the simulation process have been collated, and the specific contents are shown in Supplementary Appendix 2, 3. Brighthub Engineering and [57], in order to verify the effectiveness of the regional energy Interconnection comprehensive benefit analysis model, and to better use the System Dynamics model for predicting the changing trend of the regional energy Interconnection comprehensive benefit, the study inspects the authenticity of variables simulated by the system from 2005 to 2015, and shrinks the related error of simulation data fitting with historical data within 5% by modifying and improving various indicators through inspections. To demonstrate the degree of the model’s fit to historical data, key quantitative validation indicators are listed in Supplementary Appendix 4 to supplement the model validation content.
4.1.1 Sensitivity
This section conducts a systematic sensitivity analysis to address the uncertainties in model parameters and enhance the credibility of the research. The key parameters, including the clean energy proportion (P_c) and GDP growth rate (g), are selected for analysis, and the sensitivity coefficient S is used to quantify the impact of parameter changes on the comprehensive benefit.
4.1.1.1 Calculation of sensitivity coefficients
The sensitivity coefficient S is calculated using the Formula 16:
When the clean energy proportion changes from 30% to 50%, the comprehensive benefit increases by 15.2%. The sensitivity coefficient is calculated as:
When the GDP growth rate changes from 8.0% to 5.0%, the comprehensive benefit increases by −9.7%. The sensitivity coefficient is calculated as:
4.1.1.2 Threshold and sensitivity classification
Following the criterion proposed, a sensitivity coefficient |S| > 0.3 is defined as a strong sensitivity.
4.1.1.3 Analysis of results
With a sensitivity coefficient of 0.76 (>0.3), the clean energy proportion has a significant impact on the comprehensive benefit. Adjusting the clean energy proportion can effectively influence the comprehensive benefit, which is crucial for policy-making aimed at improving comprehensive benefits. However, attention should also be paid to potential side effects, such as increased costs.
A sensitivity coefficient of 0.323 (>0.3) indicates that the GDP growth rate is also a critical factor affecting the comprehensive benefit. Rapid economic growth can drive up the comprehensive benefit.
In summary, this sensitivity analysis identifies the strong sensitivity of the clean energy proportion and GDP growth rate to the comprehensive benefit. These findings highlight the need for precise setting of these key parameters in the model and provide a basis for addressing parameter uncertainties. By clarifying the impact of parameter changes on the results, the credibility and robustness of the model are enhanced.
4.2 Multi-scenario index analysis of energy interconnection in Southeast Asia
4.2.1 Scenario assumptions
This study constructs three scenarios: Quick Carbon Peaking, Slow Carbon Peaking, and Baseline Scenario. The core parameters are closely anchored in authoritative regional plans, international institutional forecasts, and measured data to ensure the scientific rigor and policy relevance of the scenario settings.
In the Quick Carbon Peaking scenario, the clean energy structure is strictly aligned with the Global Clean Energy Industry Development Report (2024–2025) and calibrated with regional measured data.
In the Slow Carbon Peaking scenario, in accordance with the World Energy Outlook, the “Baseload Minimum Security Threshold” is strictly implemented, which is consistent with the current demand for stability in industrial electricity use in Southeast Asia.
For parameters related to GDP growth rate and electricity demand, international authoritative institutional forecasts are cited and transformed through the “population-urbanization-electricity elasticity” correlation model.
Based on the development characteristics of energy Interconnection and the forecast of future development policies in Southeast Asia, the development scenarios are proposed for simulation.
1. The first scenario is developing clean energy at high speed, and achieving the goal of carbon peaking and carbon neutrality quickly (or quick carbon peaking & neutrality scenario).
Gao et al. [58] proposed that since clean energy plays a vital role in the environmentally friendly development, there should be positive measures taken to promote the development of the clean energy, and put it into quick carbon peaking & neutrality scenario in this case.
2. The second scenario is developing the clean energy and thermal power in a balanced way, and achieving the goal of carbon peaking and carbon neutrality steadily (or steady carbon peaking & neutrality scenario).
In consideration of the current situation, the government and relevant departments shall take corresponding measures to promote the development of clean energy, making the clean energy generation and thermal power generation in an overall balanced state, and achieve carbon peaking and carbon neutrality steadily.
3. The third scenario is developing the thermal energy, and achieving the goal of carbon peaking and carbon neutrality slowly (or slow carbon peaking & neutrality scenario).
Clean energy will be in a disordered development state without relevant policies and measures., there will be a high thermal power situation generally based on the current development situation. Carbon peaking and carbon neutrality would be achieved slowly in this scenario.
The generation capacities of clean energy in the three scenarios are shown in Table 1; GDP, population and LCOE are shown in Table 2, Table 3 and Figure 2.

Table 1. Power generation mix in Southeast Asia.
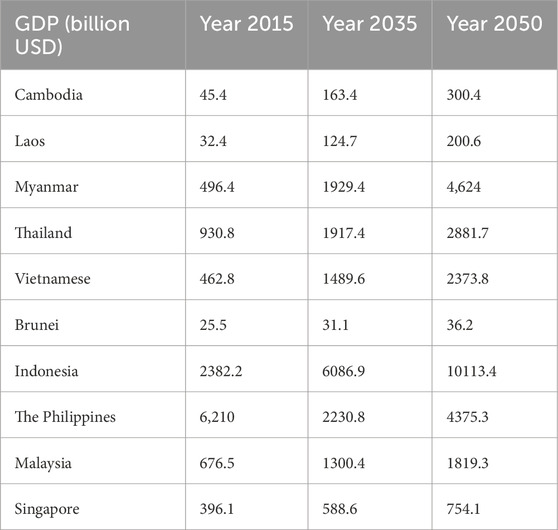
Table 2. GDP forecast in Southeast Asia.

Table 3. Population forecast in Southeast Asia.
4.2.2 Scenario simulation
Through analogously simulating the system and comparing and analyzing the key indexes of each subsystem:
4.2.2.1 Economic benefit
4.2.2.1.1 The GDP growth of electricity power
Vigorous development of clean energy will create a complete industrial chain covering materials, high-end equipment and intelligent manufacturing, while promoting the development of emerging industries such as information and communication systems. By 2050, the GDP growth of electricity power in the three scenarios is expected to be $1.4 trillion, $1.1 trillion and $0.8 trillion respectively.
4.2.2.1.2 Benefits of carbon emission right
By the year 2050, the carbon emission rights benefits of the three scenarios are expected to reach to $11.3 billion, $6.9 billion and $1.8 billion respectively in Southeast Asia.
4.2.2.1.3 Generation cost
The regional interconnection of countries with different resource endowments will promote the large-scale development and utilization of clean energy with lower marginal costs, which can reduce the price of electricity across the region effectively, and further reduce the cost of social and economic development. By 2050, the cost of leveling cost per kW hour of the electricity under the quick carbon peaking & neutrality scenario will be about 2 cents lower than it was in 2015.
4.2.2.2 Environmental benefit
4.2.2.2.1 The reduction of carbon dioxide emission
By the year 2050, the reduction quantities of carbon dioxide in the three scenarios are expected to reach to 1.7 billion tones, 1.2 billion tones and 0.7 billion tons respectively in Southeast Asia.
4.2.2.2.2 The reduction of sulfur dioxide emission
By the year 2050, the reduction quantities of sulfur dioxide in the three scenarios are expected to reach to 1.8 million tones, 1.2 million tones and 0.7 million tons respectively in Southeast Asia.
4.2.2.3 Resources benefit
4.2.2.3.1 The energy primary conversion efficiency
With the proportion of clean energy generation increasing, the energy primary conversion efficiency in Southeast Asia will also increasing. By 2050, the energy primary conversion efficiency of the three scenarios are expected to reach to 73%, 63% and 51% respectively.
4.2.2.3.2 Fuel saving of electric vehicles
With the promotion of electric vehicles, the number of electric vehicles has increased, and the amount of fuel saved by electric vehicles has significantly increased. It is estimated that the number of electric vehicles in Southeast Asia will reach to 136 million by 2050, which will save 366 million tons of fuel.
4.2.2.4 Social benefit
4.2.2.4.1 Employment opportunities
By the year 2050, the accumulated newly employment in the three scenarios in Southeast Asia will reach to 5 million, 4 million and 2.5 million respectively.
4.2.2.4.2 Population lacking electricity
Under the scenario of quick carbon peaking & neutrality, the population lacking electricity in Southeast Asia will be basically eliminated by the year 2030. Under the other two scenarios, power supply popularization will be delayed to 2040 and 2045 respectively.
4.2.3 Dynamic action pathway
Between 2030 and 2035, the decline in clean energy costs became a key turning point. The costs of solar and wind power dropped by 30.6% and 28.6% respectively, while coal-fired power costs remained stable. This gap stems from factors such as technological upgrading and large-scale production. At the technical level, an 82% increase in clean energy investment drove its power generation share to rise from 35% to 58%, which in turn reduced energy consumption per unit of GDP and significantly improved efficiency. At the policy level, the implementation of carbon taxes further increased the cost of fossil energy, amplified the competitive advantages of clean energy, and accelerated the accumulation of carbon emission rights revenue, forming a synergy between policy tools and market mechanisms.
In the fast-carbon scenario, clean energy investment drove the development of microgrids, which significantly reduced electricity access costs and accelerated power coverage. The stable-carbon scenario was constrained by the lag in the construction of main grids for thermal power, resulting in slow progress in power supply. In the slow-carbon scenario, due to the lock-in effect of coal-fired power, energy investment was concentrated in traditional fields, leading to a significant decline in electricity access rates. Under different paths, energy structures have different effects on employment promotion. The full-industry-chain layout of clean energy can create more synergistic employment opportunities, while the path dependence on traditional energy limits the release of employment potential.
After 2040, environmental benefits improved at an accelerated pace. When the share of clean power generation crossed the critical threshold, the low-carbon attribute of the energy system was enhanced, and the emission reduction effect was significantly improved. Meanwhile, the large-scale popularization of electric vehicles drove the rapid rise in fuel substitution rates in the transportation sector, and advances in battery technology and cost reduction supported this transformation. The synergistic carbon reduction in these two sectors jointly pushed environmental benefits into a stage of leapfrog growth.
4.3 Combination analysis and simulation of energy interconnection development model in Southeast Asia
After simulating the regional energy Interconnection with the single factor, relevant variables can be changed and by combining the annual growth rates of the regional GDP with various development models, different control scenarios will be formed. Through the System Dynamics simulation of the control scenarios and the comparison of various scenarios, the suitable measures to be implementation can be analyzed under various models.
The annual growth rates of regional GDP is set into three different growth models as high, medium and low which is listed by Yu et al. [59], as shown in Figure 6.
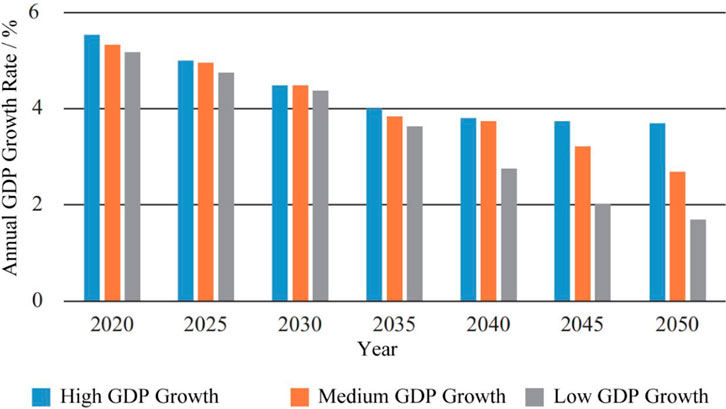
Figure 6. Setting of annual growth rate for regional GDP.
Three different annual regional GDP growth rates models and three different regional energy Interconnection scenarios, nine different regional energy Interconnection combination schemes can be generated, as shown in Table 4.
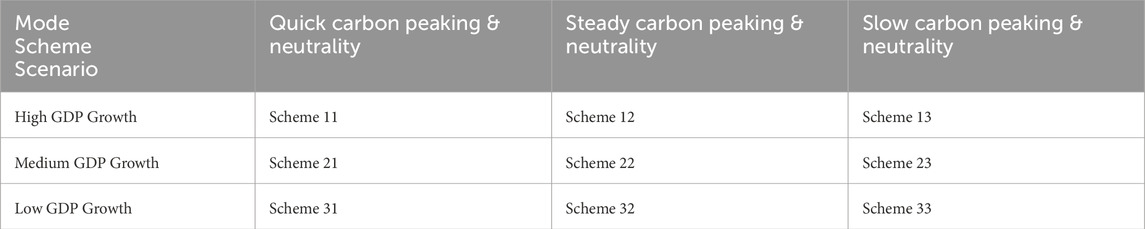
Table 4. Different scenario under distinct regulation policy combination schemes.
The regulatory political combination plans of regional energy Interconnection scenarios are shown in Table 4. The corresponding control parameters are set for simulating, and the simulation results of each variable under each scheme are obtained by adjusting relevant variables in the models, as shown in Figures 7–11.
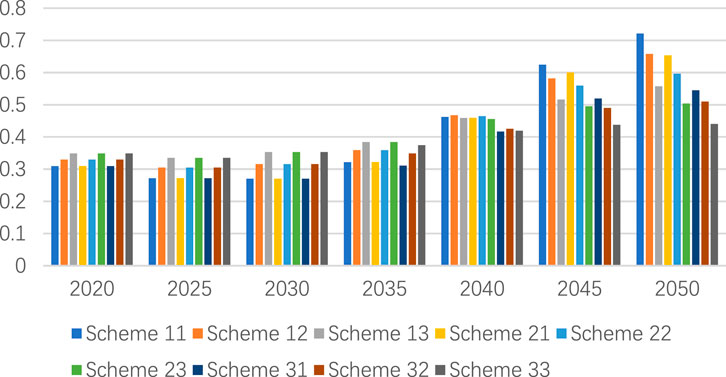
Figure 7. Simulation results of economic benefit index under different scenarios.
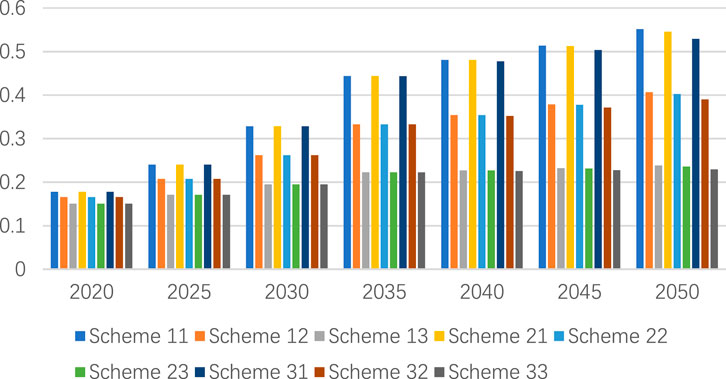
Figure 8. Simulation results of resource benefit index under different scenarios.
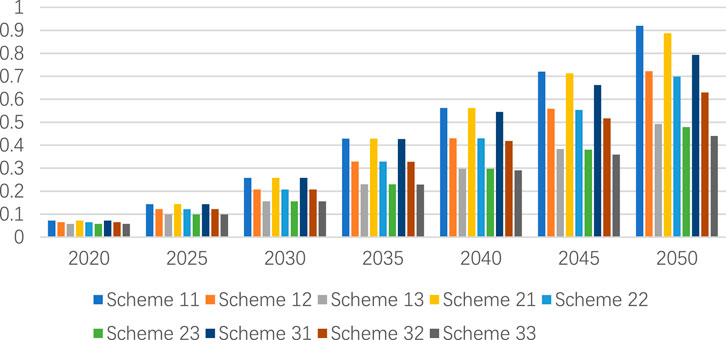
Figure 9. Simulation results of environmental benefit index under different scenarios.
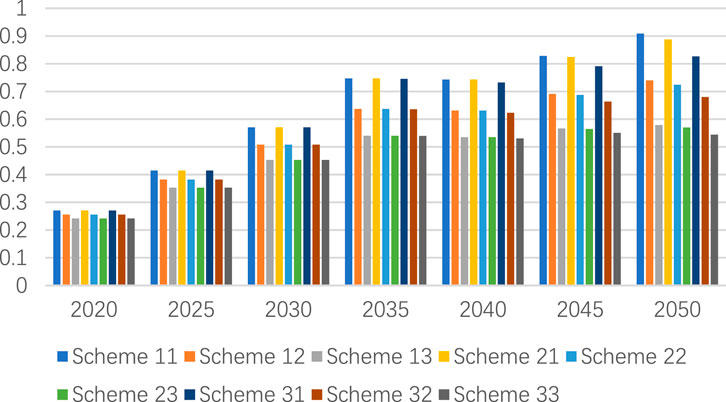
Figure 10. Simulation results of social benefit index under different scenarios.
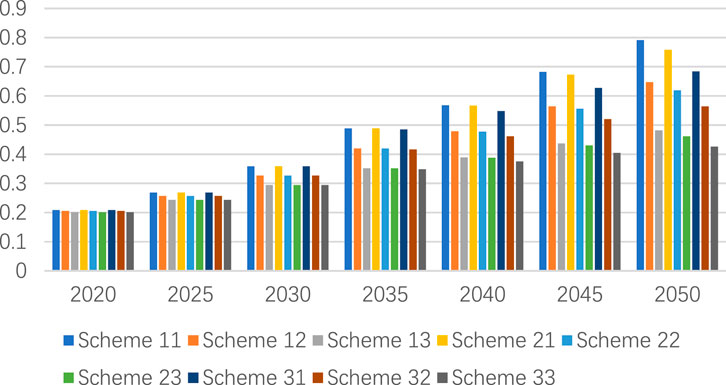
Figure 11. Simulation results of comprehensive benefit index under different scenarios.
Through the analysis of Figure 7, the conclusion can be drawn that under the rapid GDP development situation in the future, quick carbon peaking & neutrality scenario is more suitable for the regional economic development. Improving the proportion of clean energy generation is good to the impacts of clean energy on promoting social and economic system, furthermore, accelerates the regional GDP growth by feedback. Through longitudinal comparison, it can be concluded that under the three scenarios, quick carbon peaking & neutrality scenario has the most obvious benefit differences, indicating that the development of clean energy has a significant promotion effect on GDP.
Through the multi-scenario simulations and analyses of the resources and environmental benefits, the quick carbon peaking & neutrality scenario achieves good environmental and resource benefits under the three GDP growth models. With the GDP growth rate is increasing, the increasing benefits of the quick carbon peaking & neutrality scenario are significant in terms of resources and environments. Therefore, under the high GDP growth model, there will be a better improvement of resources and environments with the priority development of clean energy. If the economic growth rate slows down, the quick carbon peaking & neutrality scenario still has the best environmental benefits. At this time, the steady carbon peaking & neutrality scenario also has certain resources and environmental benefit and reduces certain clean energy investment relatively.
Through the multi-scenario analyses of social benefits, the conclusion can be drawn that the change of social benefit index is not significant and the reactions of three scenarios are not sensitive when the GDP growth rate is increasing, but under the same GDP growth model, the quick carbon peaking & neutrality scenario has the best social benefits, with the index between 0.82 and 0.91, which is significantly higher than the other two scenarios.
By comparing nine different scenarios, the economic benefit index, resource benefit index, environmental benefit index, social benefit index and regional energy Interconnection comprehensive benefit index are affected by both economic development level and clean energy situation. Under the scenario of high GDP growth model, the scenario of quick carbon peaking & neutrality scenario has obvious advantages in economic benefit index, resource benefit index, environmental benefit index, social benefit index and regional energy Interconnection comprehensive benefit index, with the highest comprehensive efficiency index of 0.79 until 2050 in scheme 11. Under the scenario of medium speed GDP growth model, the comprehensive benefits of quick carbon peaking & neutrality scenario is still in a dominant position, at the same time, the steady carbon peaking & neutrality scenario is not only good to release the investment cost of clean energy construction, but also have good economic, social, resource and environmental benefits, with the efficiency index of 0.59, 0.40, 0.69 and 0.72 respectively. Under the scenario of low GDP growth model, though the comprehensive benefits of the quick carbon peaking & neutrality scenario is the best, its relative advantage is lower than that in the medium and high GDP growth models. Under the circumstance of limited investment, the steady carbon peaking & neutrality scenario can be taken as an alternative.
5 Implications
5.1 Determine the economic, social, resource, and environmental benefits of the energy interconnection
This paper builds a comprehensive benefit evaluation model of the regional energy interconnection, which puts forward the concept of regional energy interconnection comprehensive benefit index and reflects the regional energy interconnection development benefit in the medium and long-term through the economic benefit index, social benefit index, resource benefit index and environment benefit index comprehensively.
This study introduces the data of Southeast Asia into the model for simulation in terms of economic and social development and energy market. The findings are as follows:
1. In the short term, the construction of regional energy interconnection and the development of clean energy replacing traditional energy cannot push the economic growth, but in the medium and long term, it will increase the infrastructure investment, promote the coordinated industrial chain development and increase employment rate. Especially under the background of the carbon tax policy of the future government, the development of energy-saving will improve the profits of relevant energy enterprises.
2. In the medium and long term, the development of regional energy interconnection with clean energy replacing traditional energy as the path will make important contributions to eliminate the population lacking electricity and population living in poverty. It can be found that the population lacking electricity in Southeast Asia will be basically eliminated around 2035 through systematic simulation,
3. Developing clean energy vigorously plays an important role in improving the local energy efficiency and forming a green and sustainable energy utilization pattern. It can be found that the regional energy utilization efficiency can reach to 80% by taking the clean energy replacement as the path around 2040 through systematic simulation.
Studies by the International Renewable Energy Agency (IRENA) and the ASEAN Centre for Energy (ACE) further clarify that the implementation of regional energy interconnection projects, the enforcement of mandatory energy efficiency standards, and the promotion of clean energy substitution policies can significantly improve primary energy conversion efficiency, with the improvement range reaching 75%–85%.
4. The development of clean energy replacing traditional energy has played a positive role in CO2 emission reduction, which reduces 2.4 times of the total amount of CO2 than using traditional energy.
In conclusion, in the short term of 5–10 years, the development of regional energy interconnection with clean energy replacing traditional energy causes the increase of investment and reduces the enterprises’ profit, but in the long term of 15–30 years, energy interconnection development is good to eliminate the population lacking electricity, eliminate population living in poverty, improve energy utilization efficiency, promote the economic development quality, increase the regional employment rate and reduce CO2 emissions, etc. This paper makes a quantitative analysis of the comprehensive benefits of the above regional energy interconnection development, and clarifies the influence of the energy interconnection on regional economic and social development through the system dynamics model.
5.2 Evaluation of the model
The comprehensive benefit evaluation model of regional energy interconnection constructed in this paper can evaluate the development level of social economics and energy market in a certain region. Moreover, simulate and analyze the future development path and mode. The model has the characteristics as follow:
1. The model using the method of system dynamics theory, systematically and fully reflects the energy interconnection development benefits from the medium and long term, coordinated and unified the development of energy interconnection with the regional economic, social and environment, determines the interaction mechanism and finds the benefit of energy interconnection on local economics, society, environment and resource in the medium and long term.
2. The model combines quantitative analysis with qualitative analysis and reflects the development of regional energy interconnection objectively through the authenticity test. Meanwhile, due to the uncertainty of the development of the future world, there are different development scenarios of regional GDP development level. The model conducts a comparative analysis of multiple scenarios for different scenarios of regional GDP development, full plays the advantages of system dynamics as “laboratory” in terms of economic and social policy and clarifies the development path of the regional energy interconnection.
3. The model is certainly applicable and universal. In Southeast Asia, due to the development levels of economic and social are balanced and the development foundation of hydropower is good, countries are exploring the typical energy interconnection development mode with clean energy replacing traditional energy. Therefore, through the model, the conclusion can be drawn based on collecting relevant data, simulation analysis and policy analysis. In the future, the model can be used to evaluate the comprehensive benefits of energy interconnection in other regions, such as Latin America, West Asia and North Africa, etc.
6 Conclusion
This study is based on System Dynamics, constructs the comprehensive benefit analysis model of regional energy interconnection and simulates the system using the example of economic and clean energy development system in Southeast Asia. Besides that, the study designs three carbon peaking & neutrality scenarios, evaluates the comprehensive benefits under the three economic development modes using the evaluation model, and identifies the optimal development mode and path under different scenarios.
The findings are that the development of energy interconnection plays a positive role in driving economic growth, eliminating social problems such as population lacking electricity and poverty, and improving the efficiency of resource utilization and ecological environment. Under the same level of economic development, the quick carbon peaking & neutrality scenario should be chosen, at the same time, regional economic development level plays a positive role in promoting the development of regional energy interconnection. Under the same economic development level, comparing the different carbon peaking & neutrality scenarios, it can be find that the quick carbon peaking & neutrality scenario has a greater effect on the resource and environmental benefit, showing that the development of clean energy is good for the environment, with the GDP growth increasingly, the sensitivity of economic benefits index in quick carbon peaking & neutrality scenario is good, which will increase rapidly. When GDP growth is low, the dominant position of the quick carbon peaking & neutrality scenario declines, the steady and slow carbon peaking & neutrality scenario can be used as an alternative because they can alleviate investment pressure. Therefore, there should be scientific positioning and systematic planning when choosing the quick carbon peaking & neutrality scenario.
Given the differences in development stages and energy demands among Southeast Asian countries, to enhance the relevance and operability of policy recommendations, this section analyzes policies from three dimensions: resource classification, development stage, and model parameters. All recommendations are based on the empirical data and model conclusions of this paper.
For fossil energy-dependent countries such as Indonesia and Vietnam, which have a high proportion of coal-fired power and prominent carbon emission intensity, it is recommended to implement a “coal-fired power capacity replacement mechanism,” i.e., for every 1 GW of new clean energy added, 0.8 GW of coal-fired power should be phased out. At the same time, relying on regional advantages, cross-border carbon capture hubs should be established, and CO2 storage revenues should be incorporated into the regional compensation mechanism to balance the transformation costs.
For countries with high clean energy potential such as Laos and Myanmar, Laos has hydropower potential exceeding 26GW, and Myanmar is rich in photovoltaic resources. These countries are suitable for prioritizing the development of “hydropower-photovoltaic complementary projects” and supporting the China-Laos-Thailand transnational UHV transmission corridors. A “clean energy export tax rebate” policy can be established to reduce electricity costs through cross-border power transmission and encourage cross-border green electricity trade.
For urban high-load countries such as Singapore and Malaysia, Singapore has concentrated electricity load and limited clean energy resources. It is recommended to promote the “distributed photovoltaic + electric vehicle” model, and at the same time implement dynamic carbon taxes on high-energy-consuming fields such as data centers, and improve system flexibility by combining the fuel replacement benefits of electric vehicles.
Due to the differences in economic development levels among countries, the pace of transformation must be gradual to avoid a “one-size-fits-all” approach.
For underdeveloped countries such as Cambodia and Laos, the core contradiction lies in the balance between carbon reduction and poverty alleviation. In the short term (2025–2030), it is advisable to adopt the “stable carbon peak” model (Scheme 22), retain 30% of coal-fired power to ensure employment, and allocate 30% of clean energy investment to rural power grids. In the medium and long term, gradually shift to the “fast carbon peak” model, and absorb green electricity from countries such as Thailand through cross-border interconnection.
For emerging industrial countries such as Vietnam and Indonesia, which face conflicts between industrial electricity demand growth and environmental constraints, it is necessary to implement an “industrial green electricity quota system,” requiring high-energy-consuming industries such as electronics and textiles to have a green electricity proportion of no less than 40%. At the same time, a floating carbon tax mechanism should be introduced for steel mills and chemical plants. When GDP growth exceeds 7%, the tax rate should be increased to balance economic growth and emission reduction goals.
The contribution of the study is to propose a completely systematic model and method for evaluating the comprehensive benefits of energy interconnection and conduct a comprehensive benefit analysis of the development of energy interconnection from multiple dimensions in terms of economic, society, resources and links, which plays a guiding role in analyzing the comprehensive benefits of regional energy interconnection construction in the future.
The limitations of the study are that the applicability of the model needs to be further improved, some data are derived from the existing data, and the accuracy needs to be improved. The future study is to tease the influence of the development of energy interconnection on the entire energy industry chain further, build a complex system for the development of energy interconnection, study the characteristics and mechanism of the complex system, and analyze the influence of the development of energy interconnection more systematically and comprehensively.
Data availability statement
The original contributions presented in the study are included in the article/Supplementary Material, further inquiries can be directed to the corresponding author.
Author contributions
ML: Data curation, Resources, Writing – original draft, Funding acquisition, Writing – review and editing, Formal Analysis. ZG: Conceptualization, Software, Writing – original draft, Formal Analysis. HJ: Investigation, Writing – review and editing, Data curation, Formal Analysis. YiG: Writing – original draft, Supervision, Validation, Software. YuG: Formal Analysis, Writing – original draft, Conceptualization, Validation.
Funding
The author(s) declare that financial support was received for the research and/or publication of this article. The Beijing Social Science Fund Project is a provincial and ministerial-level philosophical and social science research project established by the Beijing Municipal Government. This study was supported by the Beijing Social Science Fund Project (22GLC074).
Conflict of interest
Authors HJ and YiG were employed by Global Energy Interconnection Group Co., Ltd.
Author YuG was employed by State Grid Economic and Technological Research Institute Co., Ltd.
The remaining authors declare that the research was conducted in the absence of any commercial or financial relationships that could be construed as a potential conflict of interest.
Generative AI statement
The author(s) declare that no Generative AI was used in the creation of this manuscript.
Any alternative text (alt text) provided alongside figures in this article has been generated by Frontiers with the support of artificial intelligence and reasonable efforts have been made to ensure accuracy, including review by the authors wherever possible. If you identify any issues, please contact us.
Publisher’s note
All claims expressed in this article are solely those of the authors and do not necessarily represent those of their affiliated organizations, or those of the publisher, the editors and the reviewers. Any product that may be evaluated in this article, or claim that may be made by its manufacturer, is not guaranteed or endorsed by the publisher.
Supplementary material
The Supplementary Material for this article can be found online at: https://www.frontiersin.org/articles/10.3389/fphy.2025.1652953/full#supplementary-material
References
1. Cao J, Sun J. Energy interconnection and energy system. Beijing: China Electric Power Press (2016).
2. Wang Y. Concept and prospect of global energy Interconnection. China Power (2016) 49(3):1–6. doi:10.11930/j.issn.1004-9649.2016.03.001.05
3. Yang B, Yao L, Yan S, Li N, Cao Y, Cui H, et al. Comprehensive benefits assessment of different new energy generation technologies for global energy Internet development. Mater Sci Eng (2018) 452(3):032036. doi:10.1088/1757-899x/452/3/032036
4. Yang JR, Yang J, Gao CW, Cao Y, Tian W, Ma WQ, et al. The division of developmental stages of the global energy interconnection. In: Systems and Informatics (ICSAI), 2017 4th international conference on. IEEE (2017). p. 418–23.
5. Dai B. Prospect of electric vehicle charging station communication mode oriented to energy internet. Power Inf Commun Technol (2018) 16(09):8–13.
6. Zhou K, Yang SL, Shao Z. Energy interconnection: the business perspective. Appl Energy (2016) 178:212–22. doi:10.1016/j.apenergy.2016.06.052
7. Wei H, Jiang B, Wei XD, Zhu WB, Zhang Y. Research on development strategy of urban power grid based on energy interconnection construction. DEStech Trans Comput Sci Environ (2016). doi:10.12783/dtcse/aics2016/8176
8. Cheng L, Ji X, Zhang F, Liang C, He H. Interconnection information applied in the energy interconnection planning: a review and outlook. In: Energy interconnection and energy System integration (EI2), 2017 IEEE conference on. IEEE (2017). p. 1–5.
9. Alexander MJ, James P, Richardson N. Energy storage against interconnection as a balancing mechanism for a 100% renewable UK electricity grid. IET Renew Power Generation (2015) 9(2):131–41. doi:10.1049/iet-rpg.2014.0042
10. Kolokotsa D. The role of smart grids in the building sector. Energy and Buildings (2016) 116:703–8. doi:10.1016/j.enbuild.2015.12.033
11. Wu FF, Varaiya PP, Hui RS. Smart grids with intelligent periphery: an architecture for the energy interconnection. Engineering (2015) 1(4):436–46. doi:10.15302/J-ENG-2015111
12. Sun Q, Zhang YB, He HB, Ma DZ, Zhang HG. A novel energy function-based stability evaluation and nonlinear control approach for energy interconnection. IEEE Trans Smart Grid (2017) 8(3):1195–210. doi:10.1109/TSG.2015.2497691
13. Hao R, Ai Q, Guan T, Cheng Y, Wei D. Decentralized price incentive energy interaction management for interconnected microgrids. Electric Power Syst Res (2019) 172:114–28. doi:10.1016/j.epsr.2019.03.004
14. Kwon HI, Cho YS, Choi SM. A study on optimal power system reinforcement measures following renewable energy expansion. Energies (2020) 13:5929. doi:10.3390/en13225929
15. Liu JH, Niu Y, Liu JY, Zai WJ, Zeng PL, Shi HB. Generation and transmission investment decision framework under the global energy interconnection. In: Power and energy engineering conference (APPEEC), 2016 IEEE PES Asia-Pacific (2016). p. 2379–84.
16. Zhong WF, Yu R, Xie SL, Zhang Y, Tsang DHK. Software defined networking for flexible and green energy internet. IEEE Commun Mag (2016) 54(12):68–75. doi:10.1109/mcom.2016.1600352cm
17. Xi Y, Zeng Q, Chen Z, Lund H, Conejo AJ. A market equilibrium model for electricity, gas and district heating operations. Energy (2020) 206:117934. doi:10.1016/j.energy.2020.117934
18. Yang N, Huang Y, Dong B, Xin P, Li H. Research on the joint planning method of electricity-gas integrated energy system based on multi-agent game. Zhongguo Dianji Gongcheng Xuebao/Proceedings Chin Soc Electr Eng (2019) 39(22):6521–33. doi:10.13334/j.0258-8013.pcsee.182021
19. Peng LA, Zw A, Wy B, Hlc D, Yy A, Jw A, et al. Hierarchically partitioned coordinated operation of distributed integrated energy system based on a master-slave game - sciencedirect. Energy (2020) 214. doi:10.1016/j.energy.2020.119006
21. Liu ZY. Research of global clean energy resource and power grid interconnection. Proc Csee (2016). doi:10.13334/j.0258-8013.pcsee.160788
22. Grenatec Research. Pan-Asian energy infrastructure-australia. Grenatecresearch (2013). Available online at: http://grenatec.com/draft-paei-pan-asian-energy-infrastructure-australia/.
23. Cader C, Bertheau P. Electricity sector planning for the Philippine islands: considering centralized and decentralized supply options. Appl Energy (2019) 251:113393. doi:10.1016/j.apenergy.2019.113393
24. Pavievi M, Mangipinto A, Nijs W, Lombardi F, Quoilin S, Jiménez Navarro JP, et al. The potential of sector coupling in future European energy systems: soft linking between the dispa-set and jrc-eu-times models. Appl Energy (2020) 267:115100. doi:10.1016/j.apenergy.2020.115100
25. Wang H, Jin Y, Tan X. Study on sustainable development of the transnational power grid interconnection projects under diversified risks based on variable weight theory and bayesian network. Math Probl Eng (2020) 2020:1–10. doi:10.1155/2020/5361561
26. Jin YM, Tan X, Jiao BQ. Based on calculated model of global energy interconnection economic and society benefits analysis. Intell Power (2018) 46(5).
27. Xiaoxia W, Ding J, Liu J, Tiezhong W. Benefit and cost competitiveness analysis of wind and solar power inter-continent transmission under global energy interconnection mode. Int Conf Energy Eng Environ Prot (Eeep2016) (2016). doi:10.1088/1755-1315/52/1/012002
28. Zhang F, Xu Z, Jiao B, Yang J, Feng J. Global energy interconnection based optimal power systems planning — a global perspective 2016–2050. In: 2017 China international electrical and energy conference (CIEEC) (2017). p. 849–54.
29. Dashash MA, Mahfoudhi R. Energy cost optimization through the implementation of cogeneration and grid interconnection. In: IEEE power engineering Society general meeting, Montreal, que. 2006 (2006). p. 5.
30. Alves M, Segurado R, Costa M. Increasing the penetration of renewable energy sources in isolated islands through the interconnection of their power systems. The case of pico and faial islands, azores. Energy (2019) 182:502–10. doi:10.1016/j.energy.2019.06.081
31. Purvins A, Gerbelova H, Sereno L, Minnebo P. Social welfare impact from enhanced Trans-asian electricity trade. Energy (2020) 215:119106. doi:10.1016/j.energy.2020.119106
32. Breyer C, Bogdanov D, Aghahosseini A, Gulagi A, Fasihi M. On the techno-economic benefits of a global energy interconnection. Econ Energy Environ Pol (2020) 9(1). doi:10.5547/2160-5890.9.1.cbre
33. Zong HJ. The mechanism and benefit calculation of global energy interconnection social benefit. In: Fujian forum, humanities and social edition 8 (2017).
34. Zhao QL, Feng JS, Jin YM. Environmental benefit based on the global energy interconnection. Glob Energy Interconnection (2018) 1(5).
35. International Electrotechnical Commission (IEC). Global energy interconnection. IEC White Paper. (2016).
36. Wang H, Su B, Mu H, Li N, Jiang B, Kong X. Optimization of electricity generation and interprovincial trading strategies in southern China. Energy (2019) 174(MAY 1):696–707. doi:10.1016/j.energy.2019.03.008
37. Fan J, Wang X, Huang Q, Zhang X, Li Y, Zeng P. Power gird interconnection with hvdc link in northeast Asia considering complementarity of renewable energy and time zone difference. The J Eng (2019) 2019:1625–9. doi:10.1049/joe.2018.8851
38. Wang J, Liu D, Ip WH, Zhang W, Deters R. Integration of system-dynamics, aspect-programming, and object-orientation in System information modeling. IEEE Trans Ind Inform (2014) 10(2):847–53. doi:10.1109/tii.2014.2300703
39. Vernotte JF, Panciatici P, Meyer B, Antoine JP, Deuse J, Stubbe M. High fidelity simulation of power system dynamics. IEEE Computer Appl Power (1995) 8(1):37–41. doi:10.1109/67.363304
40. Durgaprasad G, Thakur SS. Robust dynamic state estimation of power systems based on M-Estimation and realistic modeling of system dynamics. IEEE Trans Power Syst (1998) 13(4):1331–6. doi:10.1109/59.736273
41. Eremia M, Shahidehpour M. Power System modeling and control. In: Electrical power system dynamics: modeling, stability, and control. IEEE (2013).
42. Mora M, Cervantes-Pérez F, Gelman-Muravchik O, Forgionne GA. Modeling the strategic process of decision-making support systems implementations: a System dynamics approach review. IEEE Trans Syst Man, Cybernetics, C (Applications Reviews) (2012) 42(6):899–912. doi:10.1109/tsmcc.2011.2171482
43. Gu J, Qin Y, Bao Hl., Li XK. Dynamic comprehensive evaluation of distribution network planning based on entropy weight and system dynamics. Power Syst Prot Control (2013).
44. Wu Y, Lou S, Lu S. A model for power system interconnection planning under low-carbon economy with CO2 emission constraints. IEEE Trans Sustainable Energy (2011) 2(3):205–14. doi:10.1109/TSTE.2011.2118241
45. Khansari N, Vesaghi A, Mansouri M, Mostashari A. The multiagent analysis of social progress in energy behavior: the system dynamics methodology. IEEE Syst J (2017) 11(4):2062–71. doi:10.1109/jsyst.2015.2457771
46. Oluic M, Berggren B, Echavarren FM, Ghandhari M, Rouco L. On the Nature of voltage impasse regions in power System dynamics studies. IEEE Trans Power Syst (2018) 33(3):2660–70. doi:10.1109/tpwrs.2017.2763123
47. Fan AJ, Pan YY. The development potential and relative benefit exploration of the global energy interconnection. In: Fu Jian forum, humanities and social edition 7 (2016).
49. Forrester JW. System dynamics, systems thinking, and soft OR. Syst Dyn Rev (1994) 10(2-3):245–56. doi:10.1002/sdr.4260100211
50. Hou J. The sustainable development of Harbor based on System dynamics. Syst Eng Theor Pract (2010) 30(1). doi:10.1016/S1876-3804(11)60009-8
51. Zhang CX, Liu ZX. The analysis of cultural and tourist industry in Henan Province, China based on system dynamics. China Academic Journal Electronic Press (2014).
52. Zuo QT, Chen L. Social economic ecological environment coupling System dynamics model. Shanghai Environ Sci (2001) 20(12).
53. Yao YP, Yang YX, Sun HY, Yu XF. Research on environmental benefit of recycling mechanical and electrical products based on the normalization method. In: Mechanical design and manufacturing (2011).
54. Tan JJ, Wang PP, Li Y. Application of System dynamics in comprehensive benefit evaluation of demand response. Automation Power Syst (2014). doi:10.7500/AEPS20130716017
55. He KL. Study on technical economic analysis and comprehensive benefit evaluation of intelligent power distribution. Beijing: North China Electric Power University (2016).
57. Forman EH, Saul IG. The analytical hierarchy Process—An exposition. Operations Res (2001) 49(4):469–87. doi:10.1287/opre.49.4.469.11231
58. Gao CY, Shao H, Bi HP, Zhan ZP, Song XS. System dynamics model of risk management of power construction project. Oper. Res. Eng. Sci. Theory Appl. (2017).
Keywords: regional energy interconnection, carbon neutrality, comprehensive benefits, system dynamics, scenario analysis
Citation: Lv M, Gao Z, Jiang H, Gao Y and Gao Y (2025) Benefit analysis of regional energy interconnection using system dynamics method targeting carbon neutrality. Front. Phys. 13:1652953. doi: 10.3389/fphy.2025.1652953
Received: 24 June 2025; Accepted: 11 August 2025;
Published: 10 September 2025.
Edited by:
Ze Wang, Capital Normal University, ChinaReviewed by:
Dezhou Kong, The University of Nottingham Ningbo, ChinaHaitao Guo, China University of Petroleum, Beijing, China
Copyright © 2025 Lv, Gao, Jiang, Gao and Gao. This is an open-access article distributed under the terms of the Creative Commons Attribution License (CC BY). The use, distribution or reproduction in other forums is permitted, provided the original author(s) and the copyright owner(s) are credited and that the original publication in this journal is cited, in accordance with accepted academic practice. No use, distribution or reproduction is permitted which does not comply with these terms.
*Correspondence: Zijing Gao, MjM2NDMwMTczMkBxcS5jb20=