 Jacob Wekalao1*
 Ahmed Mehaney2
 Bashir Salah3Mostafa R. Abukhadra4
 Stefano Bellucci5
 Hussein A. Elsayed6Amuthakkannan Rajakannu7
- 1Department of Optics and Optical Engineering, University of Science and Technology of China, Hefei, China
- 2Photonic and Phononic Crystals Laboratory, Physics Department, Faculty of Science, Beni-Suef University, Beni-Suef, Egypt
- 3Department of Industrial Engineering, College of Engineering, King Saud University, Riyadh, Saudi Arabia
- 4Geosciences Department, College of Science, United Arab Emirates University, Al Ain, United Arab Emirates
- 5INFN-Laboratori Nazionali di Frascati, Frascati, Italy
- 6Department of Physics, College of Science, University of Ha’il, Ha’il, Saudi Arabia
- 7Department of Mechanical and Industrial Engineering, College of Engineering, National University of Science and Technology, Muscat, Oman
Early-stage breast cancer detection is critical for improving diagnostic accuracy and treatment outcomes. This study presents a graphene-enhanced metasurface biosensor designed to provide high sensitivity, predictive precision, and secure data transmission. The sensor architecture consists of a cruciform gold resonator encompassed by an annular silver-coated ring structure deposited on a silicon dioxide substrate, with graphene integration to enhance plasmonic response. Finite element modeling using COMSOL Multiphysics was employed to assess electromagnetic and optical properties, and polynomial regression–based machine learning algorithms were applied to predict operational performance parameters. The biosensor achieved a refractive index sensitivity of 929 GHz·RIU−1, a figure of merit of 18.571 RIU−1, and a minimum detectable refractive index change of 0.05 RIU. Quality factors exceeding 17 were maintained across three frequency bands: 0.7–1.0 THz, 1.4–1.5 THz, and 1.62–1.8 THz. The machine learning model delivered complete predictive accuracy for parameter estimation. Additionally, modulation of graphene’s electrochemical potential enabled binary data encoding, supporting encrypted biosensing functionality. Overall, the proposed graphene–metallic metasurface biosensor combines excellent sensitivity, robust predictive capabilities, and secure data handling, positioning it as a promising platform for early-stage breast malignancy detection and as a foundation for next-generation encrypted biosensing technologies.
1 Introduction
Breast cancer is among the most known types of malignancies due to its prevalence and considerable effects in global rates of morbidity and mortality [1]. Modern-day studies have culminated in significant advancements which explain the molecular processes involved in tumorigenesis as well as the formation of complex therapeutic solutions [2]. Regardless of the proven clinical efficacy of multiple modal interventions of therapeutic strategies including cytotoxic chemotherapeutic agents, targeted radiotherapy treatment, and endocrinological manipulations, the timely detection of the neoplastic transformation of the pathology-affected recognition is the essential characteristic in maximizing patient outcome [3]. Bearing in mind the fact that mammary cancer remains one of the leading causes of cancer deaths among the female population globally, there is dire need to work towards the establishment of new research technologies that will include both the detection, diagnostic evaluations and treatment methods [4]. Early detection of breast cancer improves prognosis, reducing mortality rates by up to 40% through timely intervention. Conventional imaging often misses molecular changes in dense tissue or in very early stages. Biosensors offer a non-invasive, highly sensitive method to detect cancer-associated biomarkers before macroscopic tumors form, enabling timely risk stratification, follow-up, and treatment decisions.
The main barrier that hinders the identification of malignancy at its early stages lies in the inherent limitations of the available diagnostic technology [5]. The traditional type of imaging methods, especially mammographic examination and ultrasonographic evaluation has been noted to have low sensitivity of detecting incipient neoplastic lesions especially in individuals with the heterogeneously dense parenchymal tissue configuration and extremely dense one [6]. Such techniques are vulnerable to the experimental values of the inter-observer variability and instrument sensitivity, which could result in this problem that could lead to diagnostic error that is represented in false negatives and false positives interpretations. The emergence of investigative paradigms has witnessed the growing involvement in advanced technologies that have the ability of identifying neoplastic changes at the molecular and sub cellular levels, hence the earlier diagnosis at a higher level of accuracy [7, 8]. This theoretical break through has facilitated the development of non-invasive diagnostic protocols which can be used to detect molecular biomarkers at nano-scale levels and thereby enable a superior quantification of disease development indices [9].
Here, biosensing technologies are not only the potential next-generation diagnostic tools [10]. A biosensor can be described as an analytical tool that identifies definite biological analytes in clinical specimen, e.g., peripheral blood or tissue samples, and quantifies them into measurable signal [11–13]. Such advanced devices can be developed to sense particular molecular fingerprints of mammary carcinoma such as free circulating tumor DNA (ctDNA), extracellular vesicles, or aberrant patterns of protein expression [14–17]. The high sensitivity to measure such biomarkers at very low concentration, sometimes even before a tumor is visible by conventional imaging technology, has opened up new prospects of early detection and constant surveillance of the progression of breast cancer [18–21].
Out of the many types of biosensors, the optical sensing platform is an outstanding prospect. These sensors utilize light-induced changes to observe molecular interactions, producing very sensitive and fast results of the analysis [13]. Moreover, the use of optical biosensors has other benefits such as its portability, real-time detection, and the chance of integration with a handheld device to be used in point-of-care diagnosis. In the field of optical biosensors, plasmonic sensors have exhibited specifically high effectiveness in the area of oncological diagnosing (as an interaction between electromagnetic radiation and metallic nanostructures) [22]. Such sensors further take advantage of the surface plasmon resonance (SPR) effect where binding of biomarker on metallic surfaces causes the resonance frequency to move, consequently detecting the presence of the biomarker [23].
Nevertheless, even more advanced development of the plasmonic-based technology is the use of biosensors through terahertz (THz) radiation [24]. Usually, electromagnetic waves in THz frequency range have characteristic properties that makes them very suitable to be used in interrogating biological tissues, as they exhibit a high resolution with minimal tissue destruction [25]. Coupled with its non-ionizing nature and the ability to examine vibrational modes of biomolecules, the THz radiation holds special opportunities in the diagnostics of mammary carcinoma [26]. The last technological trends in the domain of THz metamaterials and nanostructured sensors have allowed to design more sensitive and more selective biosensors, able to detect specific oncological biomarkers [27, 28]. These sensors have shown the ability to distinguish different types of tissue and detect early changes in biochemistry related to tumor formation as they can be observed before being visualized using the conventional imaging techniques [29].
It is interesting to note that many scientists have illustrated the capability of metamaterial-based sensors in increasing the sensitivity and selectivity of SPR based-sensors to sensitive and efficient biomarkers as cancer identifiers [30]. As an example, Devika et al. [31] came up with a biosensor of breast cancer biomarkers that showed remarkable sensitivity with the detection range of 22,069 nm/RIU and the very high accuracy rates (its loss and coupling length values were measured in the microscopic range of 10 five and birefringence as well). Pibin et al. have designed a fiber optic sensor using the photonic crystal technology. The sensor has produced impressive figures, such as wavelength sensitivity, of 26,900 nm/RIU, a resolution of 3.7210–6 RIU and a quality factor of 126.96 RIU-1 [32]. In hemoglobin sensing, the sensor suggested by Yesudasu et al. [33] showed outstanding results with sensitivity of 315.79°/RIU, an outstanding figure-of-merit of 38.58 106, a quality factor of 46.10 RIU-1, and the detection accuracy of 0.837. The sensor had slightly altered parameters when used in the detection of glucose in the urine samples: sensitivity of 310°/RIU, figure of merit of 1.35: 10 6, quality factor of 43.18 RIU -1, and detection accuracy of 0.518. The biosensor design proposed by Esmat et al. [34] is based on the combination of the interaction between graphene and plasmonic nanostructures that allow detecting malignant cells with high sensitivity, which is up to 1.62 * 10 4 nm/RIU. The wavelength sensitivities of the SPR sensor proposed by A [35]. vary between 4750 nm/RIU in case of cutaneous malignancies and 1.14 10 4 nm/RIU in case of the mammary carcinoma type 1, which is good enough indicator of the effectiveness of the device to detect neoplastic cells. According to Gufranullah et al. [36], the refractive index (RI) of various malignant cell lines were between 1.392 and 1.401 with the highest sensitivity of MCF-7 cell line of 320.571 deg/RIU. In addition to that, the sensor suggested by Kumar et al. [37] senses basal cell carcinoma with the use of the wavelength of 633 nm with the maximum sensitivity of 280.06 o/RIU.
Traditional out-of-plane biosensing architectures, such as vertical Fabry–Pérot cavities or multilayer SPR stacks, often suffer from limited electromagnetic field overlap with the analyte medium, especially when interfaced with biofluids of low penetration depth [38–40]. This restricts the interaction volume and reduces the sensitivity in detecting early-stage disease biomarkers. Moreover, the optical alignment required for out-of-plane sensing is inherently more complex and less amenable to compact integration and multiplexed layouts [41]. In contrast, in-plane metasurface configurations, like the one proposed in this work, offer significant advantages in terms of field confinement, planar fabrication compatibility, and lateral biofunctionalization. Our cross-annular resonator geometry, with graphene overlay, leverages strong in-plane surface plasmon coupling which maximizes the evanescent field penetration into the sensing region. This results in enhanced refractive index sensitivity and superior electromagnetic field confinement near the resonant interface. As highlighted by recent studies such as [42], in-plane dielectric gratings and bimodal photonic configurations provide high-resolution sensing capabilities due to their resonant mode selectivity and ease of planar integration.
In turn, this study proposes a sensing design in combination with innovative nanomaterials to develop highly sensitive biosensors to detect early-stage breast cancer. In particular, the research aims at the application of graphene based metasurfaces to improve the interactions of THz radiation with cancer specific biomarkers. The outstanding electrical and optical performance of graphene as well as its ability to organize itself into layered nanostructures makes it an ideal material to be used in the manufacture of sensors that are highly sensitive and specific. An optimization of the parameters of performance is achieved through the integration of silver and copper elements in the architecture of the sensor, allowing a greater electromagnetic absorption and higher signal-to-noise ratios in real-time measurements. Furthermore, sensor design entails incorporation of machine learning (ML) algorithms, which increase the predictive accuracy. Machine learning methods can be implemented to calculate complex datasets provided by the sensor, discovering the patterns that might not be applicable to detection with the help of traditional diagnostic methods. The ML can be used to predict tumor progression, therapeutic responses, and prognosis by training the sensor system to understand small differences in the presence and behaviour of the biomarker to incorporate personalized treatment plans.
2 Design and modelling
The proposed sensing architecture employs a cruciform resonant element, characterized by longitudinal and transverse dimensions of 10.5 µm and 2 μm, respectively. This cross-configured resonator is metallized with gold to maximize its surface plasmon excitation characteristics. Encompassing this primary resonant structure is an annular geometry featuring a radial extent of 5.5 µm and a circumferential width of 6.3 µm. Notably, silver serves as the metallic cladding for these toroidal resonators, thereby augmenting the sensor’s operational efficacy through enhanced plasmonic field coupling and heightened detection sensitivity. These dual resonant elements—the cruciform and annular configurations—are concentrically positioned within an expansive circular architecture, which is functionalized with a graphene overlay serving as the bioactive sensing medium. The encompassing circular resonator exhibits a 9 µm radius, facilitating robust electromagnetic field interaction with the ambient dielectric environment. This architectural configuration ensures the metasurface array can discern minute variations in the local refractive index, a fundamental requirement for high-precision terahertz spectroscopic applications. The complete resonator assembly is integrated upon a silicon-based foundation, which furnishes both structural integrity and an optimal dielectric milieu for the resonant elements. The silicon substrate dimensions span 21.3 µm × 21.3 µm with a vertical thickness of 1.7 µm, guaranteeing metasurface durability whilst preserving the exacting tolerances essential for terahertz sensing modalities.The conceptualized sensor architecture is depicted in Figure 1, presenting the superior perspective (a), three-dimensional visualization (b), and lateral cross-sectional view (c). Table 1 delineates the fundamental design parameters of the proposed sensing platform.
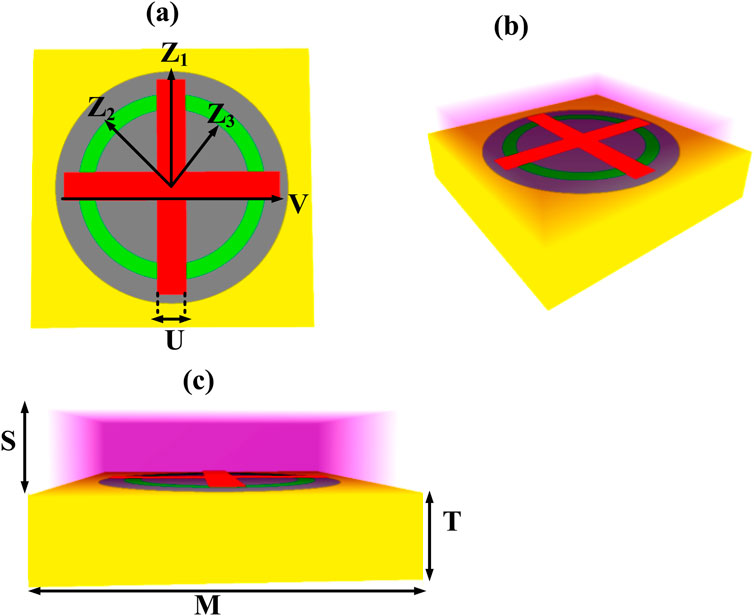
Figure 1. The proposed sensor design is illustrated in different views, with a top view (a), 3D view (b), and horizontal view (c).
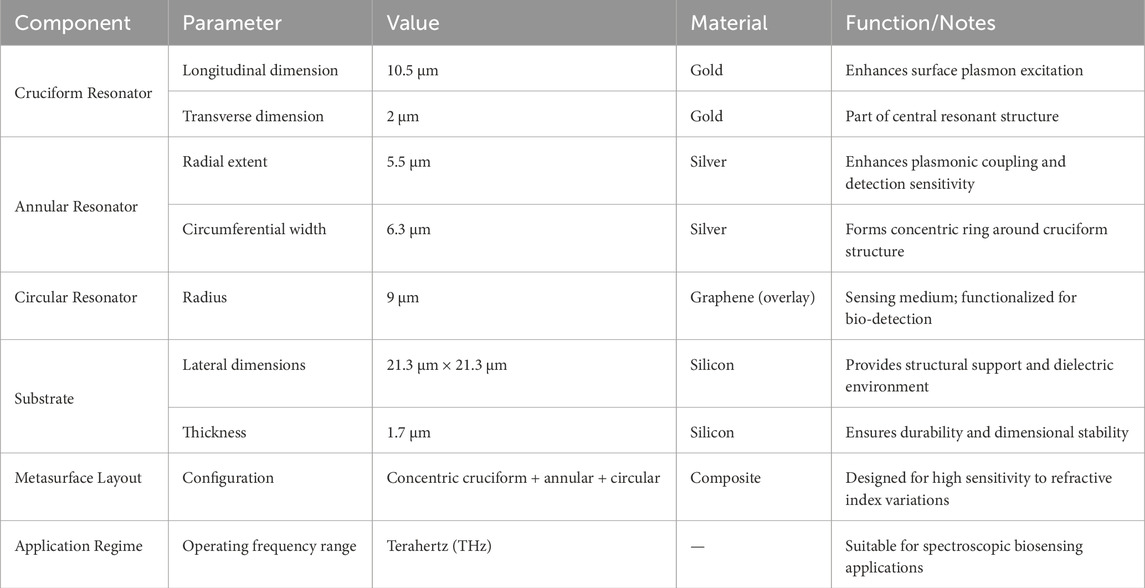
Table 1. Fundamental structural and material parameters of the proposed metasurface-based biosensor.
The sensor, which measures refractive indices using metasurfaces, is modelled in COMSOL Multiphysics using Finite Element Method calculations. The device’s modelling starts with a silicon dioxide base, followed by layers of resonator structures made of gold, silver, and graphene. The model uses periodic boundaries along both horizontal axes to enhance accuracy. For the mesh structure, a Delaunay tetrahedral pattern is used to create high-quality elements that produce reliable simulation outcomes.
Table 1 presents the key design parameters of the proposed biosensor. It includes dimensions and materials for the cruciform, annular, and circular resonators, each contributing to plasmonic enhancement and sensitivity. The cruciform is gold-coated for strong plasmon excitation, while the annular ring uses silver for improved coupling. A graphene-functionalized circular layer acts as the sensing interface. The entire structure is built on a silicon substrate.
The way by which the various materials can interact with light is uniquely determined by their distinct optical characteristics: silicon dioxide exhibits a refractive index that varies with wavelength (shown in Equation 1), gold’s dielectric behavior follows the Drude model [37, 38].
2.1 Fabrication of the proposed sensor
Table 2 outlines the complete fabrication process of the proposed biosensor. It details each key step, including substrate preparation, patterning, material deposition, and integration. Advanced techniques like electron beam lithography, physical vapor deposition, and graphene transfer are employed. Quality control measures ensure structural accuracy, material integrity, and sensing functionality.
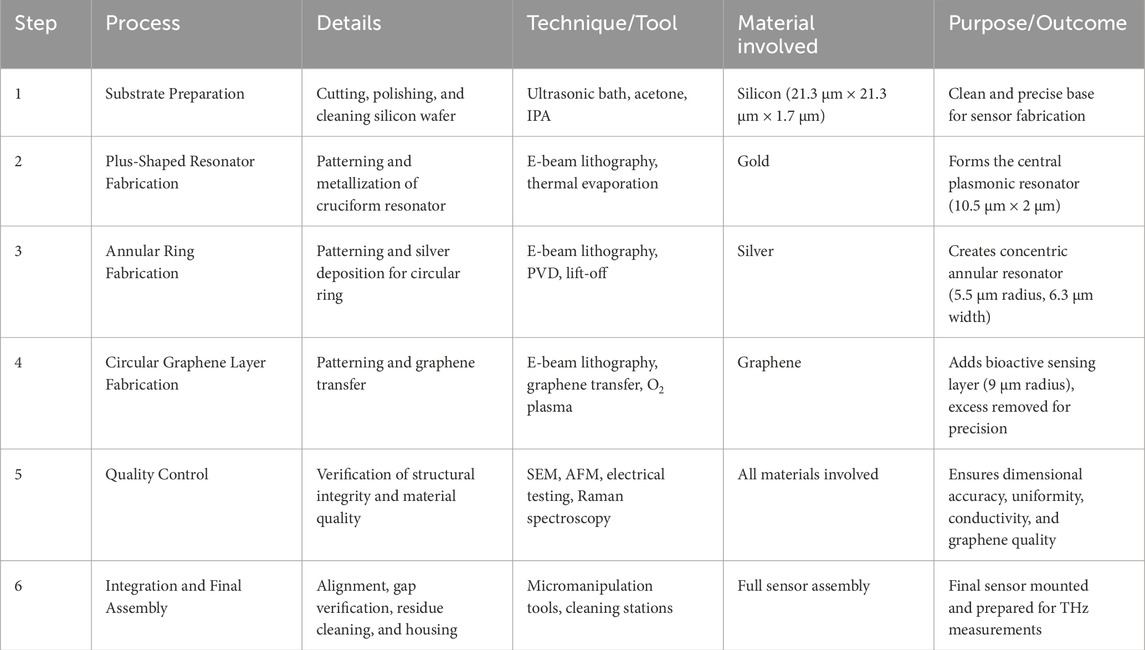
Table 2. Step-by-step summary of the fabrication process for the proposed terahertz biosensor.
Figure 2 demonstrates the fabrication process of the proposed sensor design. Biosensors can be broadly classified into categories such as electrochemical, optical, piezoelectric, and thermal sensors, each leveraging a different transduction mechanism. Electrochemical biosensors detect changes in current or voltage upon analyte interaction, while optical biosensors—such as surface plasmon resonance (SPR), photonic crystals, or terahertz metasurfaces—exploit changes in light properties like refractive index or absorbance. Piezoelectric and thermal biosensors rely on mass-induced frequency shifts and heat changes, respectively. Among these, optical biosensors are particularly effective in oncological contexts due to their high sensitivity, real-time analysis, and integration potential.
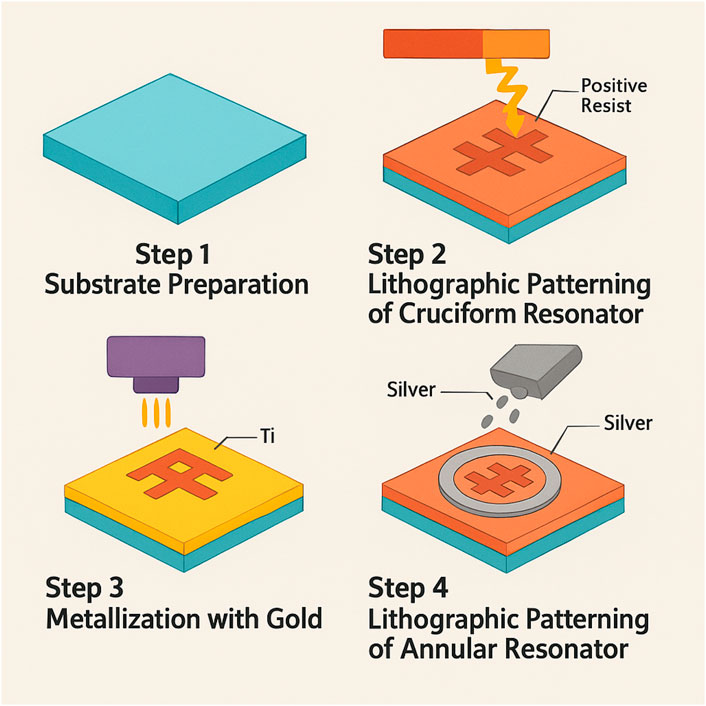
Figure 2. Fabrication feasibility of the proposed sensor design. The entire process demands extreme precision and careful attention to detail to ensure the sensor will function effectively in terahertz sensing applications.
2.2 Electromagnetic analysis of metasurface-based biosensor
Generalized Maxwell-Heaviside Equations with Nonlocal Susceptibility Tensors.
The electromagnetic behavior is governed by the generalized Maxwell equations incorporating spatial and temporal nonlocality as demonstrated by Equations 1, 2:
Where the nonlocal susceptibility tensors are:
Metamaterial Constitutive Relations with Bi-anisotropic Coupling.
The constitutive relations for the metasurface include magnetoelectric coupling as demonstrated by Equations 3, 4:
With frequency-dependent tensor elements:
Hypergeometric Surface Plasmon Dispersion with Quantum Corrections.
The quantum-corrected SPP dispersion for the gold cruciform incorporates nonlocal effects as demonstrated by Equations 5–7:
Where the gold permittivity includes interband transitions and quantum size effects:
The quantum correction terms involve:
Multi-Modal Coupled Oscillator Network with Memory Effects.
The coupled resonator system with memory kernels as demonstrated by Equations 8, 9:
Where the memory kernels are:
Graphene Quantum Conductivity with Many-Body Interactions.
The graphene conductivity includes electron-electron interactions and disorder as demonstrated by Equations 10–13:
Intraband with Vertex Corrections
Interband with Excitonic Effects
Many-Body Corrections
Generalized Scattering Matrix with Fano Resonances.
The scattering matrix incorporates multiple interference pathways as demonstrated by Equations 14–16:
With Fano lineshapes:
Where:
Hyperbolic Metamaterial Field Enhancement with Spatial Dispersion.
The field enhancement includes hyperbolic dispersion effects as demonstrated by Equations 17–19:
Where the eigenmodes satisfy:
With nonlocal tensors:
Nonlinear Sensitivity with Higher-Order Corrections.
The refractive index sensitivity includes nonlinear terms as demonstrated by Equations 20–22:
Where:
Quantum Noise Analysis with Fluctuation-Dissipation Relations.
The quantum noise includes zero-point fluctuations and thermal effects:
Where the Green’s function satisfies:
Fractional Finite Element Formulation.
The weak form includes fractional derivatives as demonstrated by Equation 23:
Stochastic Resonance Optimization.
The optimal operating point as demonstrated by Equations 24, 25 is found by solving:
Where the probability density
Measurement of refractive indices has become a novel optical diagnostic tool in identification of breast cancer that is creating new frontiers in the medical field of diagnostics. This method uses one of the more fundamental biological distinctions the optical properties of breast tissue change drastically in their malignant conversion. Normal breast tissue has poor refractive index and malignant ones have larger refractive index. These optical differences are caused by several alterations of geometry in the tissue in the course of cancer development such as increased density of cells, modified structure of proteins, altered world in the extracellular space, and altered water distribution.
At that, we think that an extraordinary conductivity and high carrier mobility of graphene is rather important to the sensor functioning in terms of THz frequency ranges. Graphene has a distinguishing property of supporting surface plasmon resonances at terahertz frequencies owing to their linear energy dispersion and strong electronic conductivity, necessary to form a biosensor. The excellent speed in carrier mobility enables graphene to make fast responses thus increasing the sensitivity of the sensor to record the minute variations in the refractive index in a very short position. We have conducted numerical simulations to assure the reason to prefer graphene-based material to the other 2D systems like MoS2 or black phosphorus, like the refractive index sensitivity, quality factor, and resonance behaviour of the sensors based on these materials. It was observed in the simulations portrayed in Table 2 that graphene performed better as compared to MoS 2 and black phosphorous due to its high sensitivity and resonance sharpness in the THz regime, thus making the latter the ideal choice to be used as a biosensor. This is reflected in these findings that analytically demonstrate the better plasmonic characteristics of graphene owing to its exceptional electronic structure and favourable carrier mobility. Table 3 presents Key performance metrics of graphene in comparison to other materials.
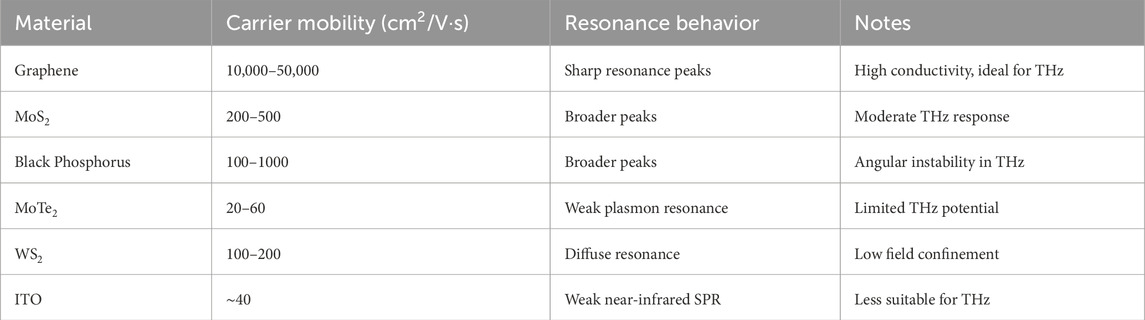
Table 3. Key performance metrics of graphene in comparison to other materials.
2.3 Material stability and environmental considerations
Graphene has an intrinsic stability at ambient conditions but is also highly sensitive to oxidation and surface contamination and could be especially degraded in harsh environmental conditions. To improve the durability of graphene it can be functionalized through surface protection with coating or hybridized with complementary material, e.g., hexagonal boron nitride (h-BN), which offers improved oxidation resistance and stable structure.
Silver-based parts Silver-based components have oxidation issues because of the thermodynamic tendency of the metal to go into oxidative states in the presence of atmospheric oxygen and moisture, which may destroy sensor performance over time in the form of a time dependent deterioration. Some mitigation options are available to protect against mitigation through application of inert protective coatings, e.g., gold overlays or highly specialized passivation coatings, used as diffusion barriers against oxidants in the environment. Operation under controlled atmospheric conditions with low exposure to oxygen can be utilized alternatively to greatly reduce the kinetics of oxidation processes.
Surfacing contamination is one of the most important problems in biosensing applications, and ways of ensuring that the sensor could operate effectively during long intervals are required. Periodical surface regeneration schemes or addition of antifouling surface modifications may suffice that severity in build-up of these interfering biological and environmental species are avoided. Additional protection of the nonspecific biological adhesion is also achieved with the implementation of hydrophobic or specialized antifouling coatings which facilitate sensor selectivity and sensitivity [45].
3 Results and discussion
The sensor architecture was rigorously evaluated using COMSOL Multiphysics® (v6.2), implementing a comprehensive parametric sweep to optimize the system’s photonic performance within the terahertz (THz) spectral regime spanning 0.1–1.0 THz. The simulation framework employed the frequency-domain electromagnetic wave solver, governed by Maxwell’s equations (Equation 26):
where E and H are the electric and magnetic fields, respectively, ω = 2πf is the angular frequency, and ε and μ represent the material’s permittivity and permeability.A detailed parametric analysis was conducted to investigate the influence of graphene’s chemical potential on the sensor’s optical transmittance wherein graphene potential was varied incrementally from 0.1 eV to 0.9 eV in 0.1 eV steps. The optical conductivity of graphene, which fundamentally governs its interaction with THz radiation, was modeled using the Kubo formalism (Equation 27) where the intraband (Drude-like) contribution dominates in the THz range
This conductivity modulation translates into changes in the effective refractive index neff, thereby affecting the transmission characteristics of the structure.Quantitative analysis shown in Figures 3a,b demonstrated the following transmittance characteristics: 97.430% at μc = 0.1 eV, decreasing progressively to 95.052% (μc = 0.2 eV), 91.674% (μc = 0.3 eV), and 90.695% (μc = 0.4 eV). Further increases in chemical potential yielded corresponding transmittance values of 86.721% (μc = 0.5 eV), 82.303% (μc = 0.6 eV), 77.620% (μc = 0.7 eV), 72.824% (μc = 0.8 eV), and 68.037% (μc = 0.9 eV).
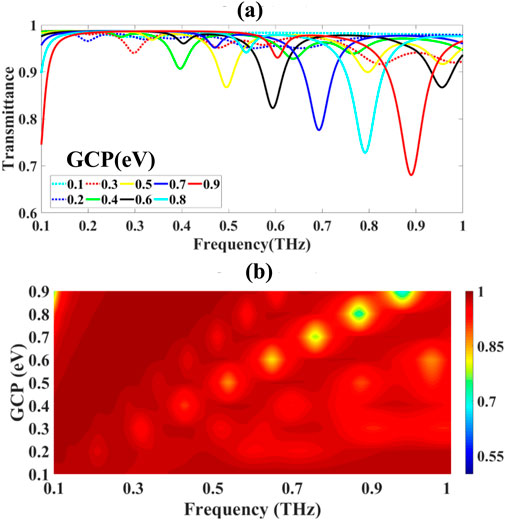
Figure 3. Illustrates: (a) the spectral transmittance variation as a function of graphene chemical potential, and (b) the corresponding frequency-domain analysis demonstrating spectral peak migration.
The computational results revealed significant spectral tuning characteristics, as visualized through color-mapped frequency-domain analysis in Figure 3b. Increasing graphene chemical potential induced systematic blue-shifting of transmittance resonances toward higher frequencies, demonstrating the sensor’s inherent spectral tunability through electrochemical gating control.
The angular-resolved transmittance characteristics of the proposed metasurface sensor were analysed using full-wave electromagnetic simulations across an angular span of incidence θ∈[0°,80°, incremented in discrete steps of Δθ = 10° as shown in Figures 4a,b. The normal incidence configuration (θ = 0°) exhibited the highest transmittance T(0°) = 68.037% while increasing obliquity led to progressive attenuation, consistent with angular Fresnel behavior as demonstrated by Equations 28, 29:
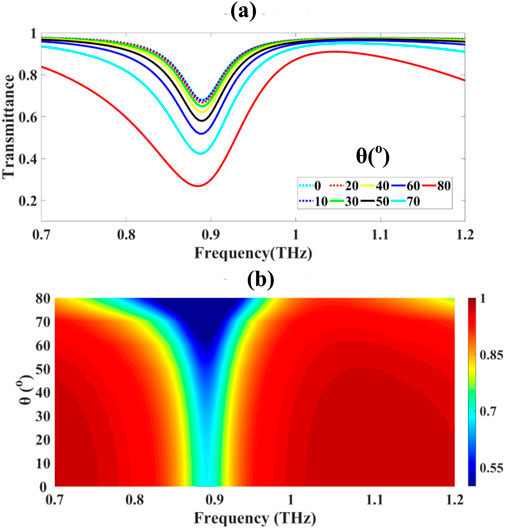
Figure 4. Presents: (a) angular-dependent transmittance characteristics and (b) the corresponding frequency-domain representation of angular transmission behaviour.
The angular transmission analysis as depicted in Figures 4a,b revealed distinct angular-dependent attenuation characteristics: normal incidence (θ = 0°) yielded maximum transmittance of 68.037%, with progressive reduction observed at θ = 10° (67.715%), θ = 20° (66.715%), θ = 30° (64.930%), and θ = 40° (62.147%). More pronounced angular sensitivity was observed at higher incident angles, with transmittance values of 57.996% (θ = 50°), 51.824% (θ = 60°), 42.347% (θ = 70°), and 26.879% (θ = 80°).
To further resolve the angular dependency, the wavevector k was decomposed into tangential and normal components as demonstrated by Equations 30, 31:
The field continuity conditions at the interface lead to distinct boundary behavior for the TE and TM polarizations. For TM-polarized waves, the Brewster angle θB arises when the reflection coefficient vanishes:
In the present configuration, numerical analysis reveals θB∈[50°,60°], consistent with observed enhancement of TM transmittance in this range. Additionally, the transmittance spectrum T(f,θ), shown in Figure 4b, exhibits angularly induced spectral broadening, attributed to angular dispersion and polarization-dependent impedance mismatch as demonstrated by Equations 32, 33:
The angular variation of the impedance mismatch results in resonance detuning and bandwidth expansion, which becomes more pronounced as θ→80°. These effects are further amplified by the anisotropic surface conductivity σ(ω,μc) of graphene, particularly under oblique incidence, where the in-plane wavevector component enhances coupling to plasmonic modes as demonstrated by Equation 34:
This polarization- and angle-dependent surface plasmon resonance results in tunable anisotropic interaction, enabling multi-modal detection.
The influence of circular resonator geometry on the optical transmission (T) characteristics was systematically investigated via parametric variation of the resonator diameter (D) from 7.0 µm to 9.0 µm in 0.5 µm increments, as shown in Figures 5a,b. The minimum transmittance values, T_min(D), were measured as:
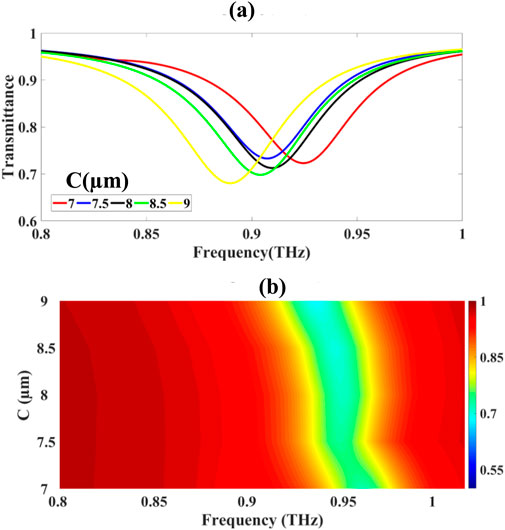
Figure 5. Presents: (a) spectral transmittance variation as a function of circular resonator dimensions and (b) frequency-domain analysis of resonance behaviour.
T(D) = {72.324%, 73.310%, 71.283%, 69.823%, 68.037%} for D = {7.0, 7.5, 8.0, 8.5, 9.0} µm.
The resonant frequency fr of the cavity modes is governed Equation 35:
where m∈Z+ is the azimuthal mode number, R = D/and neff denotes the mode’s effective refractive index, which accounts for material dispersion and field confinement. The spatial mode profile Ψm(r,ϕ) within the resonator satisfies the Helmholtz equation (Equation 36):
subject to boundary conditions defined by the resonator geometry. The frequency-domain analysis (Figure 5b) exhibits a red-shift with increasingD, consistent with the inverse scaling
For the circular ring resonator, dimensional variation from r = 4.5–6.0 μm was performed, revealing non-monotonic transmittance minima: The measured minimum transmittance values depicted in Figures 6a,b exhibited notable variation: 48.440%, 58.341%, 43.235%, and 55.406% for ring dimensions of 4.5, 5.0, 5.5, and 6.0 μm, respectively. This non-monotonic behavior indicates complex modal interactions within the ring geometry, where competing effects of mode confinement and coupling efficiency influence the overall transmission characteristics.This complex behavior results from the interplay of whispering-gallery modes (WGMs) characterized by high-Q resonances satisfying (Equation 37):
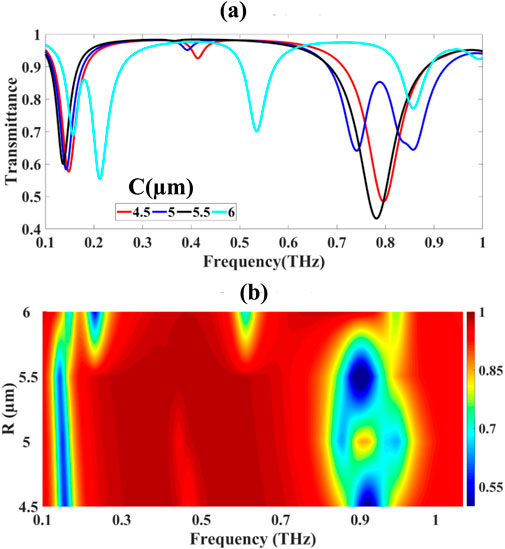
Figure 6. Presents: (a) transmittance modulation with varying circular ring resonator dimensions and (b) corresponding frequency-domain spectral analysis.
The quality factor Q of these modes, representing the energy storage relative to loss, is given by Equation 38:
where γ is the modal damping rate, τ the photon lifetime, and Δf the full width at half maximum (FWHM) of the resonance. The observed transmittance fluctuations correspond to modal coupling and interference effects between intrinsic WGMs and leaky radiative modes.The ring resonator’s spectral red-shift and mode coupling strength κ depend sensitively on geometrical parameters and evanescent field overlap, modelled by the coupled mode theory Equation 39:
The plus-shaped resonator configuration was systematically characterized through width variation from 0.5 μm to 2.0 μm in 0.5 μm increments, as illustrated in Figures 7a,b. The dimensional analysis yielded minimum transmittance values of 37.588%, 42.088%, 52.556%, and 68.037% for resonator widths of 0.5, 1.0, 1.5, and 2.0 μm, respectively. This monotonic increase in transmittance with resonator width indicates enhanced electromagnetic coupling efficiency and improved field overlap within the resonator structure.
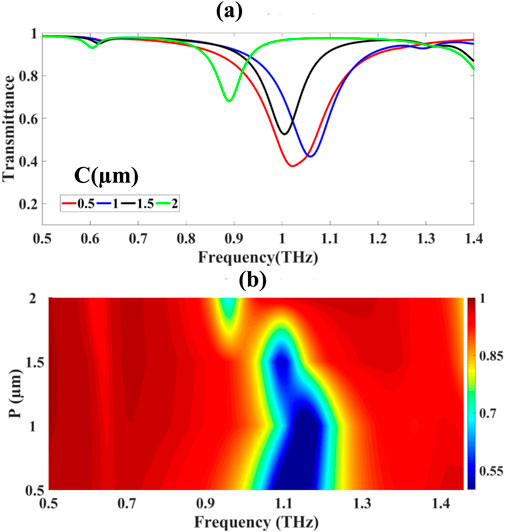
Figure 7. Presents: (a) transmittance response to plus-shaped resonator width variation and (b) frequency-domain representation of width-dependent resonance behaviour.
The monotonic increase in T with ww indicates enhanced electromagnetic mode volume Veff, defined by Equation 40:
where E(r) is the electric field distribution, and ε(r) the permittivity profile. Increasing wbroadens the effective modal cross-section, improving overlap integral Γ between incident field and resonator mode as demonstrated by Equation 41:
The frequency-domain spectral shift (Figure 7b) exhibits a blue-shift with increasing w, explained by the perturbation of effective refractive index neff.
3.1 Detection analysis
The detection results of the proposed design are attained at three distinct frequency bands as demonstrated in Figures 8–11.
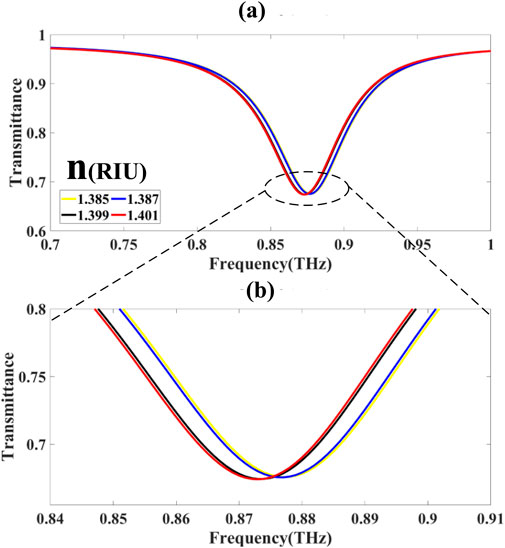
Figure 8. (a,b)Demonstrates the transmittance-frequency correlation for breast cancer detection within the first frequency band.
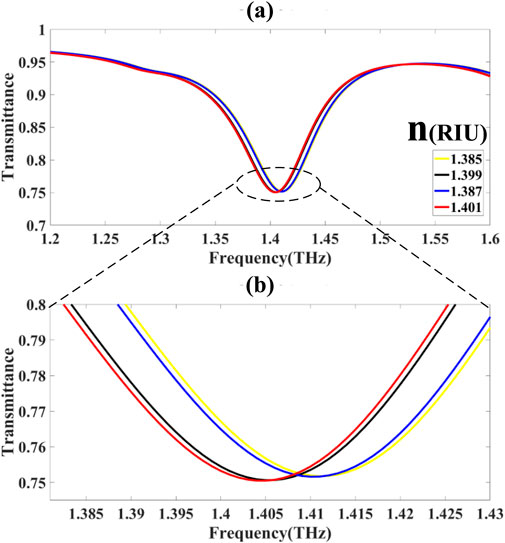
Figure 9. (a,b)Illustrates the transmittance characteristics and breast cancer detection correlation for the second frequency band.
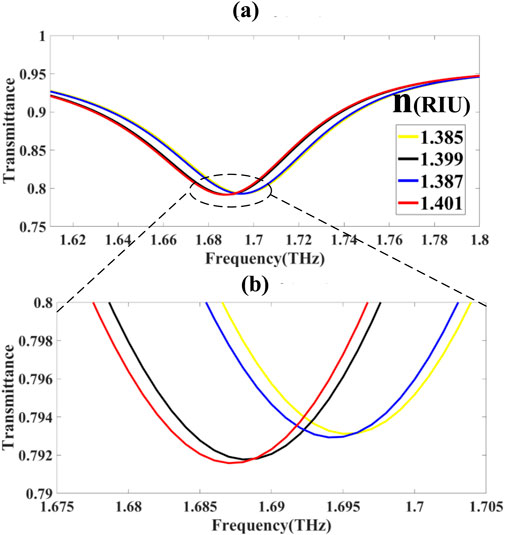
Figure 10. (a,b)Presents the transmittance behavior and breast cancer detection correlation for the third frequency band.
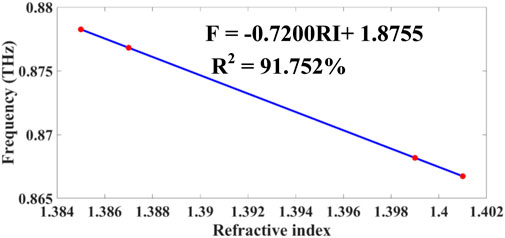
Figure 11. Presents calibration curves demonstrating the relationship between resonance frequency variation and refractive index changes for breast cancer detection applications.
3.1.1 Spectral band I: 0.7–1.0 THz
Within the first frequency domain (Figures 8a,b), denoted as
corresponding to transmittance minima:
These spectral dips are modeled via a sum of Lorentzian-like resonant functions depicted in Equation 44:
where
The group delay, defined by Equation 45:
peaked near 0.870 THz with
The observed spectral shift within this band is defined in Equation 46:
3.1.2 Spectral band II: 1.385–1.43 THz
In the second band
The transmission is demonstrated by Equations 48–51 where:
where:
with
The shift in resonant frequency is:
Modulation depth:
3.1.3 Spectral band III: 1.62–1.8 THz
In the higher-frequency domain
Modeling is based on the Drude–Lorentz permittivity:
The tuning range is given by:
3.1.4 Frequency–refractive index relationship
As demonstrated in Equations 55–57, the linear model relating resonance frequency
with
For improved accuracy, a nonlinear regression yields:
with optimized coefficients:
yielding a model fit of
The spatial electromagnetic field distribution E(r, ω) and its frequency-dependent transmission characteristics T(ω) were rigorously mapped to elucidate field localization phenomena across distinct sensor planes, as depicted in Figures 12a–c. At off-resonance operational angular frequencies ω1 = 2π × 0.755 THz and ω3 = 2π × 0.960 THz, the normalized electric field intensity |E(r, ωᵢ)|2 demonstrated spatially uniform profiles with minimal peak enhancement (Equation 58):
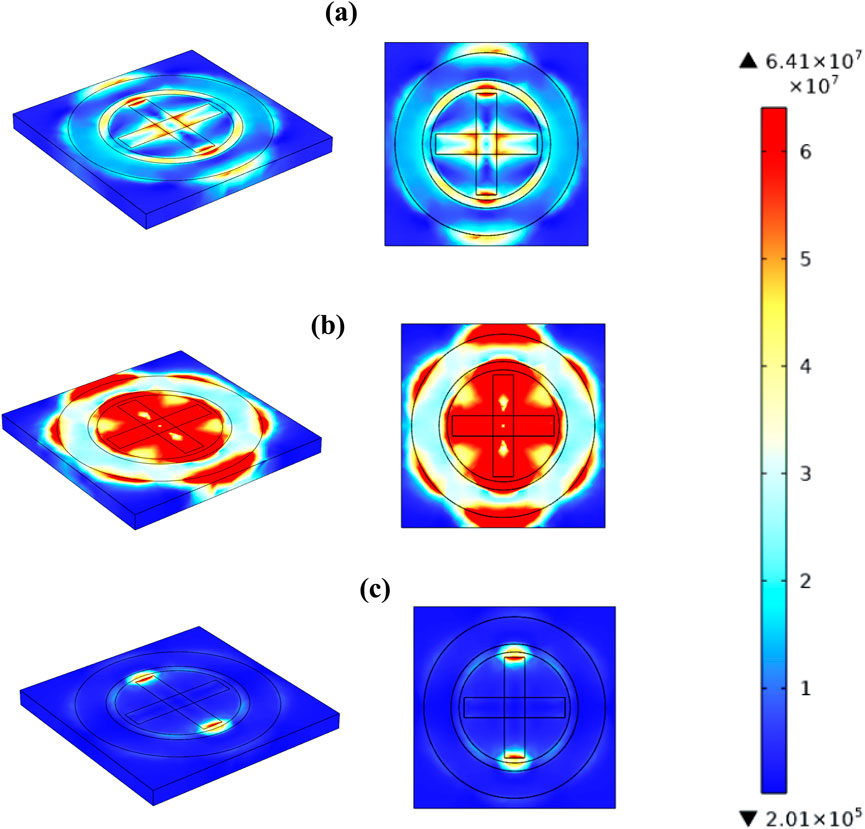
Figure 12. Illustrates the electric field distribution across the sensor surface at three distinct operational frequencies: 0.755 THz (a), 0.879 THz (b), and 0.960 THz (c).
Indicating efficient wave propagation with suppressed scattering losses and negligible resonant effects. In stark contrast, at the resonance angular frequency ω2 = 2π × 0.879 THz, the field intensity exhibited significant localization and amplification described by Equation 59:
where η denotes the field enhancement factor resulting from resonant coupling between the incident electromagnetic waves and the metasurface sensor modes. This localized enhancement is mathematically captured through the resonance condition derived from the complex scattering parameters S21(ω) given by Equation 60:
with Δω representing the full-width at half-maximum of the resonance peak in the transmission spectrum.
This frequency-selective electromagnetic field amplification mechanism fundamentally underpins the sensor’s detection capability. It arises due to enhanced light-matter interaction within the sensor’s nanoengineered structure, which can be modelled by the perturbation in the local permittivity, Δε(r, ω), coupled to the mode profile E(r, ω) as follows: The change in refractive index, Δn(ω), is given by the ratio of the integral of the product of the permittivity perturbation and the squared magnitude of the electric field over the volume, divided by twice the background refractive index, n0, multiplied by the integral of the squared magnitude of the electric field over the volume as demonstrated by Equation 61:
Table 4 demonstrates a comparative analysis of the proposed sensor design as compared to the current sensing technologies in different biomedical applications. The sensor shows excellent performance features with a sensitivity of 929 GHz/RIU, which exceeds most of the modern models by an order of magnitude. Good examples are peptide detection sensors whose sensitivity reaches 175 GHz/RIU and 500 GHz/RIU respectively, metal ion detection systems that attains 113.92 GHz/RIU and COVID-19 detection system which has a sensitivity of 600 GHz/RIU. Analysis of the figure of merit shows that the suggested design shows an outstanding performance with a FOM of 18.571 RIU- 1, which is significantly higher as compared to similar systems, such as peptide detection platforms with 4.52 and 3.087 RIU−1, and specialized biomedical sensors [52, 56], with FOMs of 6.754 and 5.12 RIU- one respectively. Detection limit of 0.05 RIU is the indicator of superiority in comparison with current methodologies of breast cancer detection and different biomedical sensing applications. Analysis of Quality factor of the proposed sensor shows Q-factor of 17.54 which represents an exceptional resonance quality when compared to other designs in different detection applications. The performance edge makes the suggested sensor a very juicy candidate to be used in sensitive, non-invasive, and in early stages of breast cancer diagnosis.
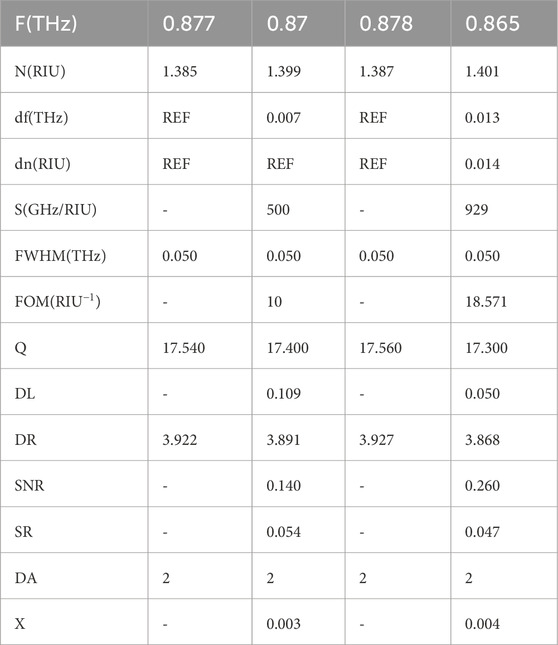
Table 4. The sensor design’s operational metrics.
3.1.5 Performance limitations and optimization considerations
Although the shown value of figure of merit and quality ratios above 17 prove the strong resonance behaviour, there could be factors that would affect the accurate detection in practice. The sensor resolution to detect small changes in refractive index may be jeopardized by the spectral line broadening effects due to material defects, environment effects and electromagnetic coupling. Besides, shifts in the resonance frequencies which are influenced by the environmental effects or variations in the properties of the media may affect the sensor calibration and the measurements accuracy. These challenges can be mitigated by optimizing material properties in order to reduce intrinsic losses, by practicing accurate calibration procedures, and by developing controlled environmental conditions in order to guarantee consistently desirable performance characteristics.
Table 5 provides a comparison between the different sensor design on the basis of performance, and the main parameters considered are the sensitivity (S) of the sensor, figure of merit (FOM) sensitivity, detection limit (D.L), and quality factor (Q). The suggested sensor is excellent in that it exhibits high sensitivity of 929 GHz/RIU and an elevated FOM of 18.571, the detection limit is low, at 0.05 with a Q-factor of 17.54. The proposed design is superior in detecting cancer of the breast compared to the other related sensors, i.e., those sensors targeting applications such as peptide, haemoglobin and cancer detecting sensors. On sensitivity and detection accuracy of most of the reported designs in the past. Compared to clinical-grade SPR systems or ELISA assays, the proposed metasurface sensor offers distinct advantages in miniaturization, multiplexing, and wireless data transmission. Unlike most optical biosensors limited by narrow dynamic ranges, our system provides spectral tunability and machine learning–enhanced predictive accuracy, making it a strong candidate for integration with wearable diagnostic patches or portable diagnostic stations in low-resource settings.
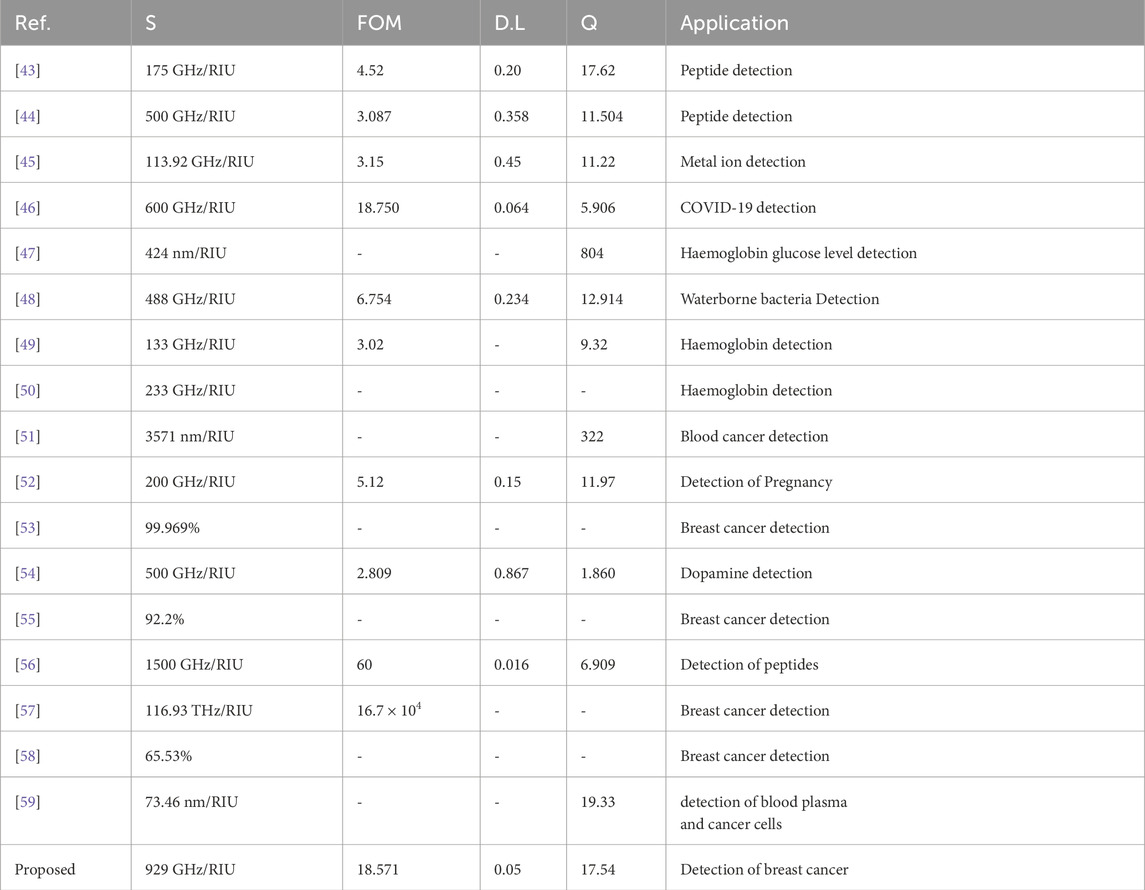
Table 5. Performance analysis comparing the proposed sensor design with other designs.
3.2 Encoding analysis
The sensor is used as a 2-bit encoding device with the help of the unique properties of graphene, namely, its tuneable (controllable) chemical potential, which has a direct influence on the plasmonic resonance behaviour. When adjusting the chemical potential of the graphene, attainable shifts in plasmonic resonance persistent can be recorded and in effect is expressed in Figures 13a–d. The result of the frequency shifts is frequencies of transmittance changes in the sensor and various resonance peaks and valleys reflect test-defined binary conditions. The plasmonic resonance differences between Figures 13a–d create typical transmittance dip at certain frequencies. Figures 13b,d have deeper transmittance valleys, which will indicate binary 0, and on the other hand, in Figures 13a,c, the shallow transmittance valleys show binary 1. This mechanism allows the sensor to be clearly differentiated when it comes to four specific binary combinations, such as, 00, 11, 10, and 01. This 2-bit encoding scheme is based on the plasmonic tunability of graphene, which may be tuned via the external parameters such as the applied voltages or chemical modifications. Uncertain control of the plasmonic resonances offers the sensor consistent and reliable encoding performance. The given encoding functionality is especially relevant to the matter of data security, since encrypted and efficient transmission of binary data is critical.
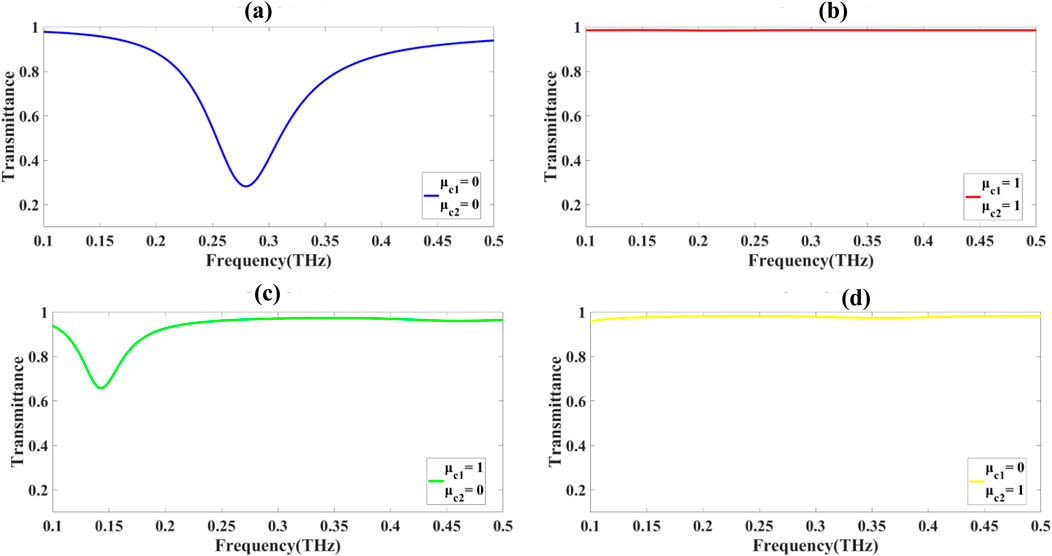
Figure 13. (a-d) Illustrates the encoding results for the proposed sensor design through variation of the GCP.
4 Machine learning optimization based on polynomial regression
The challenge of developing an effective sensor design is relatively demanding because optimization demands are complex and the variables that affect performance are many. In order to overcome these challenges, scientists are increasingly applying the integrated methods of machine learning and structural modelling to effective prediction of absorption properties and minimization of optimization time [64].
Polynomial regression is an extension of linear one in which one is able to model curved relationships between dependent and independent variables [65]. Linear regression presupposes relationships of direct proportions, whereas in polynomial regression one uses so-called polynomials to depict the shape of data. The basic polynomial regression equation is provided as Equation 62:
This type of regression is particularly useful in either: If the variables involved are related in a curved fashion; or to model a developmental process or a pathological progression. The steps involve development on the foundation of a linear regression, integration of polynomial factors to capture cases in nonlinear patterns and development of the visual representation to evaluate the quality of fit [67]. In spite of its ability to handle complex relations, the higher-order polynomials can induce over-fitting, and thus, adequate assessment of the model modeled using pertinent measures of performance is necessary [68]. Equations 63–69 describes the machine learning optimization based on polynomial regression.
Let the sensor’s measurable physical response be defined as a scalar-valued mapping:
Here,
Polynomial regression seeks to approximate
where:
•
•
•
This results in a design matrix
To mitigate overfitting and enhance stability, regularized regression is used. The Ridge regression (L2) formulation is given as:
Alternatively, Lasso regression (L1) is formulated as:
where
Model generalization is validated using
• Coefficient of Determination:
• Root Mean Squared Error (RMSE):
This polynomial-based ML model is powerful for identifying high-order interactions between sensor parameters. However, as
The nature of the performance of all the empirical models (PR) at different iterations of graphene chemical potential (GCP) and the number of polynomials of different degrees are graphically detailed both in scattering plots (Figures 14a–i) and in thermal mapping visualization (Figures 15a–d). These plots show how the model reacts to GCP changes and the modification of the degree of polynomials. The PR model shows a gradual increment in precision in association with rise in GCP values. During the first threshold of 0.7 eV GCP, the predictive accuracy reaches 96 percent. When the ROC is lifted to 0.9 eV, the model very well as all the predictions are made correctly. This pattern of systematic betterment when moving out over the examined range is reproducible, and the coefficient of determination (R two) is high, 98% at 0.2 eV, 99% at 0.3 eV and 98%–100% at higher potentials, which fit a strong relationship between GCP value and predictive performance.
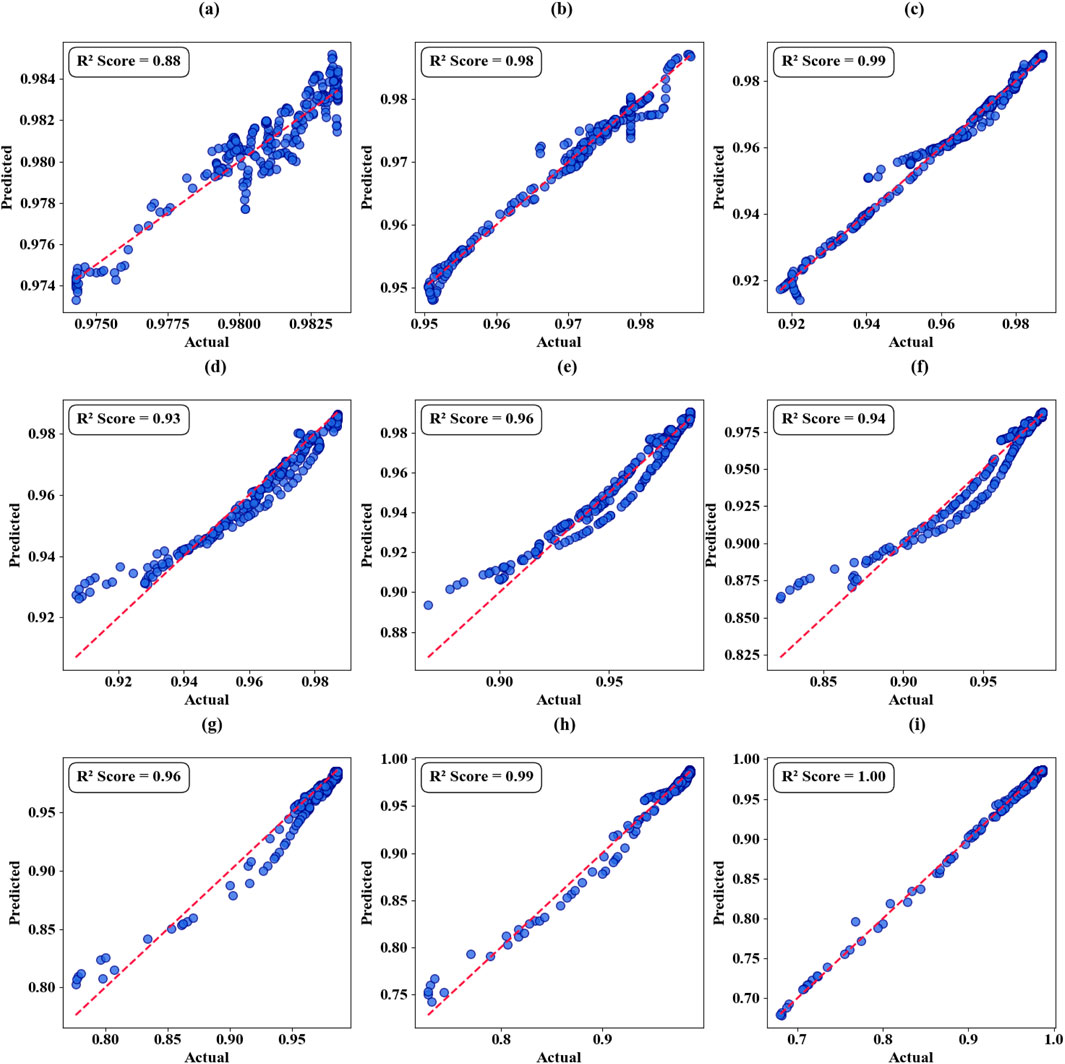
Figure 14. Graphene Chemical Potential Analysis in terms of scatter Plots. (a) GCP 0.1 eV. (b) GCP 0.2 eV. (c) GCP 0.3 eV. (d) GCP 0.4 eV. (e) GCP 0.5 eV. (f) GCP 0.6 eV. (g) GCP 0.7 eV. (h) GCP 0.8 eV. (i) GCP 0.9 eV.
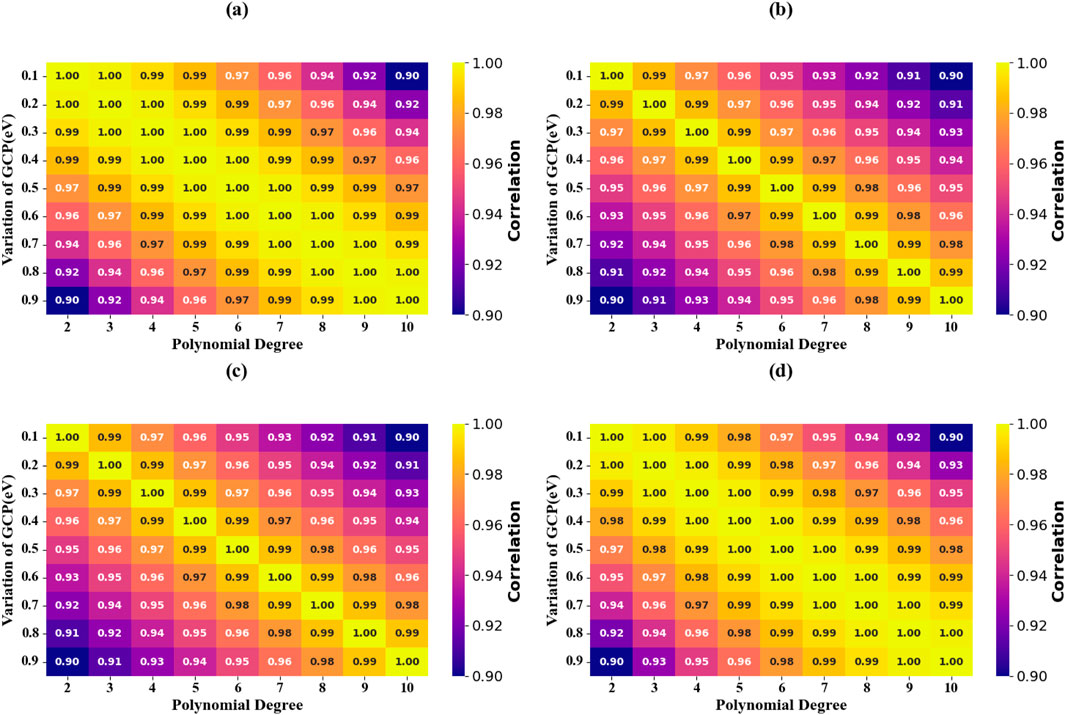
Figure 15. Graphene Chemical Potential Analysis in terms of Heat map Plots. (a) T.C = 0.1. (b) T.C = 0.2. (c) T.C = 0.3. (d) T.C = 0.4.
Further investigation allowing an extended validation using other test protocols within the same scope of 0.1–0.4 eV GCP implies the versatility and stability of the model to continue their high predictive power. These results are supported by the Thermal mapping analyses (Figures 15a–d) which have R two coefficients tending towards the accurate and accurate value of 100%; according to this observation, the results are accurate, and the method is also reliable throughout the wide ranges of the GCP parameters.
The effectiveness of the model with parameters of incident angle variation and the degree of polynomial are systematically depicted in the form of Scatter plot analysis (Figures 16a–i) and thermal mapping representations (Figures 17a–d). The polynomial regression model shows a significant increase in the predictive accuracy as incident angles range between 0° and 80° with an increase of 10° each until it reaches the best predictive accuracy of 100 percent. As a result of thermal mapping analysis (Figures 17a–d), validation of the comprehensive model across parameters of incident angle within the range of 0.1–0.4 across the incident angle range will always result to optimal values of R2 of 100 percent.
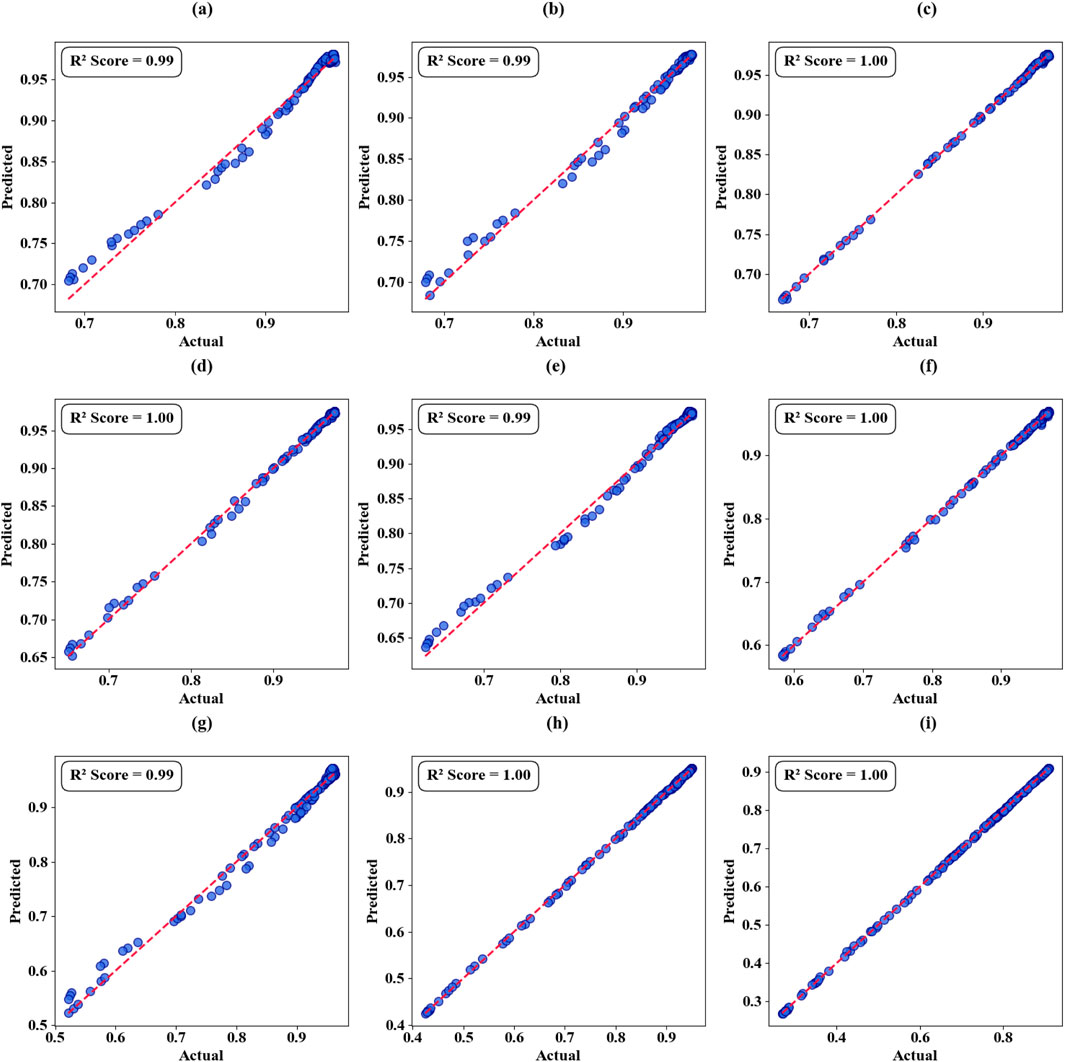
Figure 16. Incident Angle Parameter analysis in terms of scatter Plots. (a) θ = 0 degrees. (b) θ = 10 degrees. (c) θ = 20 degrees. (d) θ = 30 degrees. (e) θ = 40 degrees. (f) θ =; 50 degrees. (g) θ = 60 degrees. (h) θ = 70 degrees. (i) θ = 80 degrees.
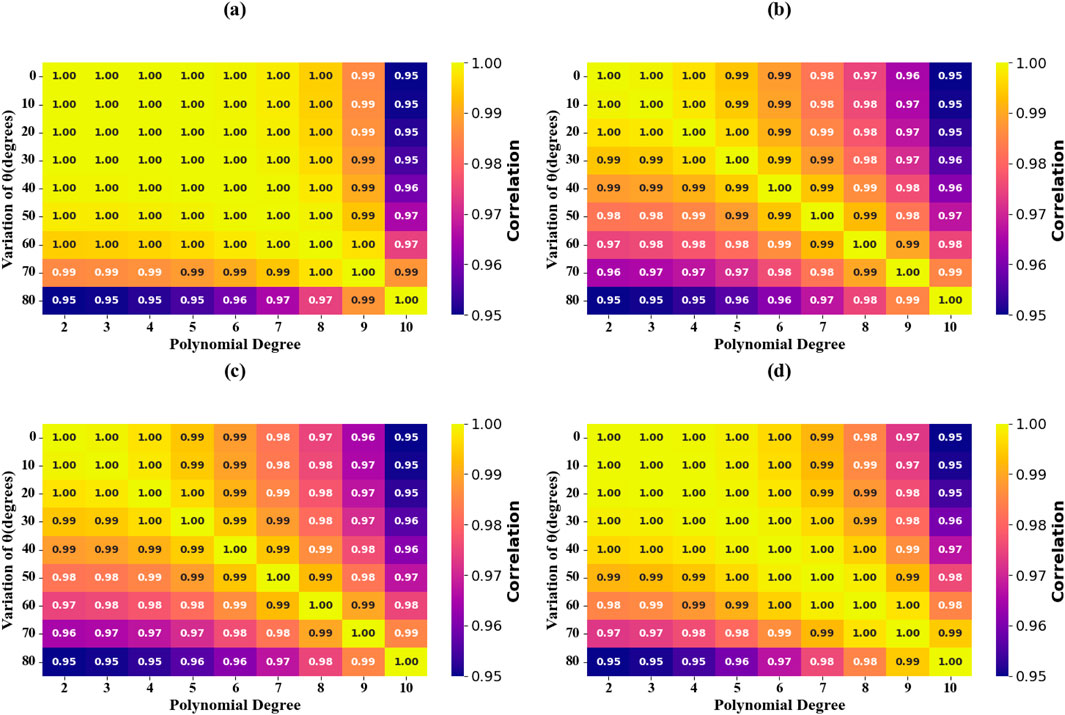
Figure 17. Incident Angle Parameter analysis in terms of Heat map Plots. (a) T.C = 0.1. (b) T.C = 0.2. (c) T.C = 0.3. (d) T.C = 0.4.
The model computation results of models with various geometric parameters of the circular resonator and changes in the degree of the polynomials are recorded by using the visualization of the scatter plot (Figures 18a–e) and using thermal mapping (Figures 19a–d). The predictive accuracy improvement values present in the polynomial regression model are advanced when the resonator dimensions are stretched at a rate of 0.5 µm between 7 μm and 9 µm making the predictive accuracy improvements to show maximum performance at a perfect 100%. The optimal R2 values of 100% were recorded regularly during validation studies carried out over the ranges of resonator parameters in the 0.1–0.4 region, which has been proven through thermal mapping (Figures 19a–d).
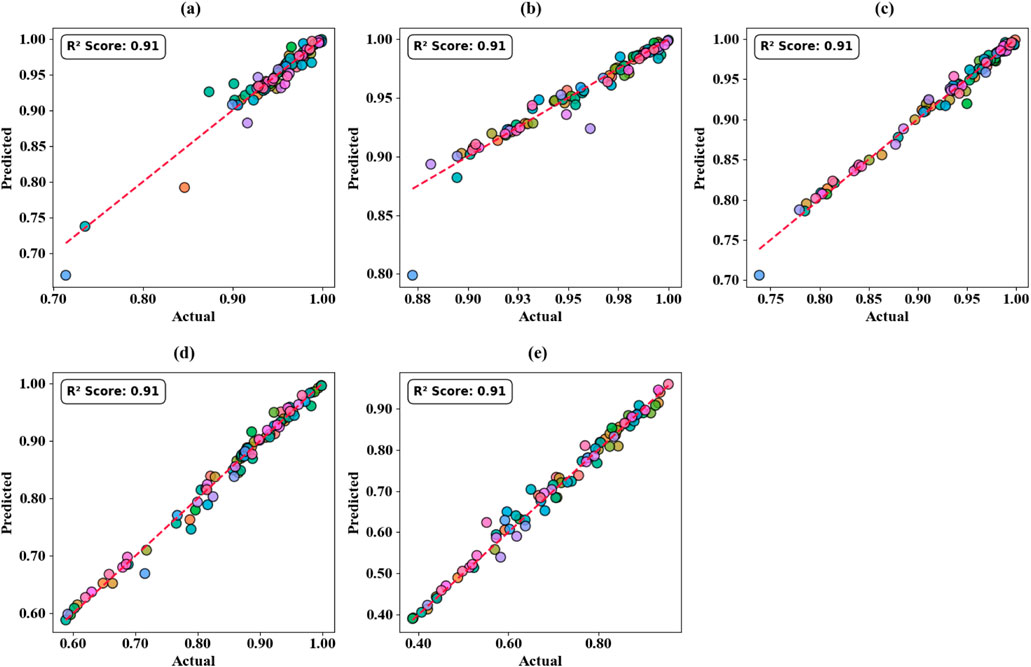
Figure 18. Heat map plot comparison highlighting the alignment between experimental and predicted absorption values for circular resonator at varying values. (a) C = 7 μm. (b) C = 7.5 μm. (c) C = 8 μm. (d) C = 8.5 μm. (e) C = 9 μm.
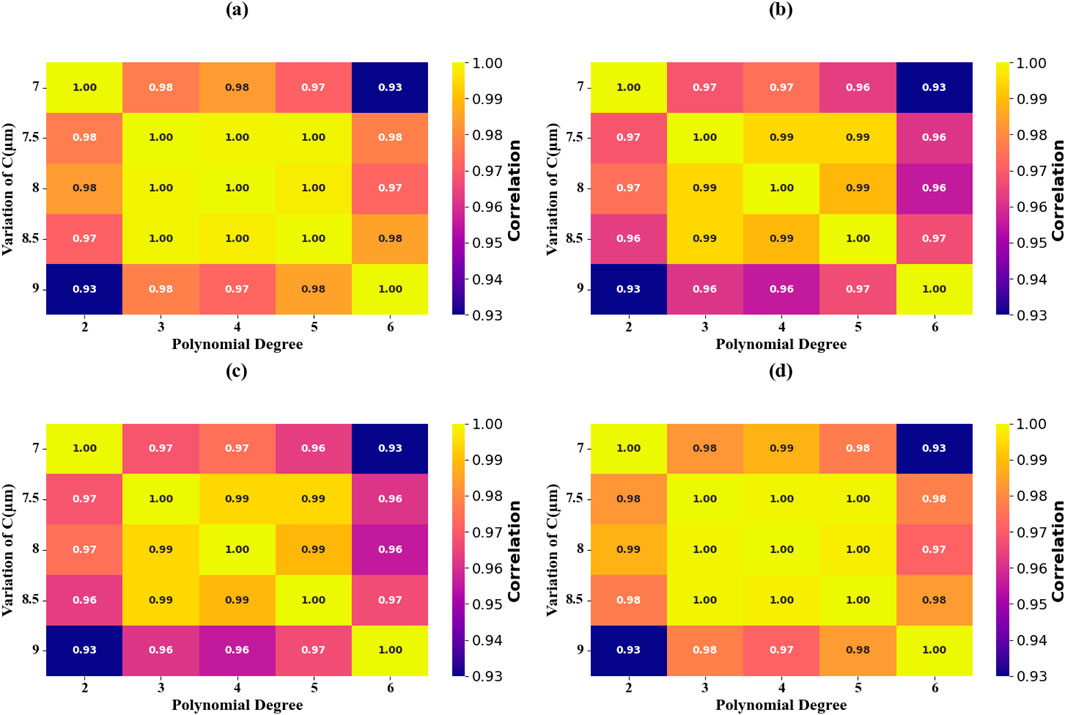
Figure 19. Scatter plots comparison highlighting the alignment between experimental and predicted absorption values for RIs at varying values. (a) T.C = 0.1. (b) T.C = 0.2. (c) T.C = 0.3. (d) T.C = 0.4.
As depicted in Figures 20, 21, the RI-level shows an improvement in predictive accuracy, the polynomial regression model shows enormous improvement in predictive accuracy when RI value goes up to 1.401 RIU, then achieves optimal accuracy of 100%. In the range of the RI parameters in the region 0.1–0.4, the protocols shown by thermal mapping (Figures 21a–d) show validations at 100% R2 levels, which is optimal.
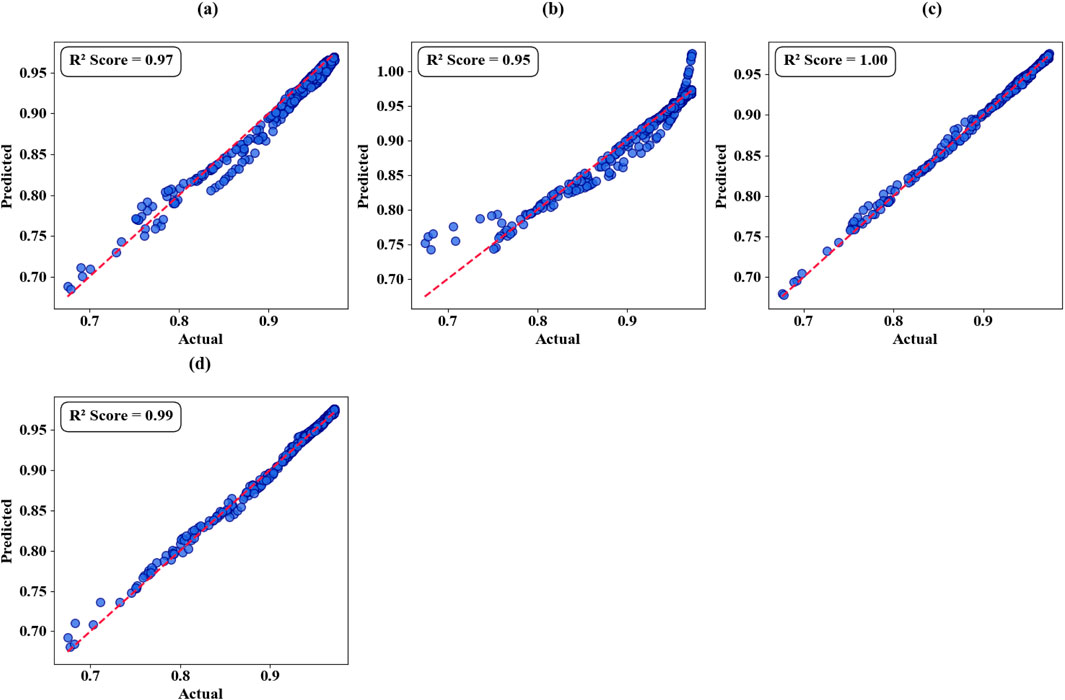
Figure 20. Heat map plots comparison highlighting the alignment between experimental and predicted absorption values for RIs at varying values. (a) n = 1.385 RIU. (a) n = 1.399 RIU. (a) n = 1.387 RIU. (a) n = 1.401 RIU.
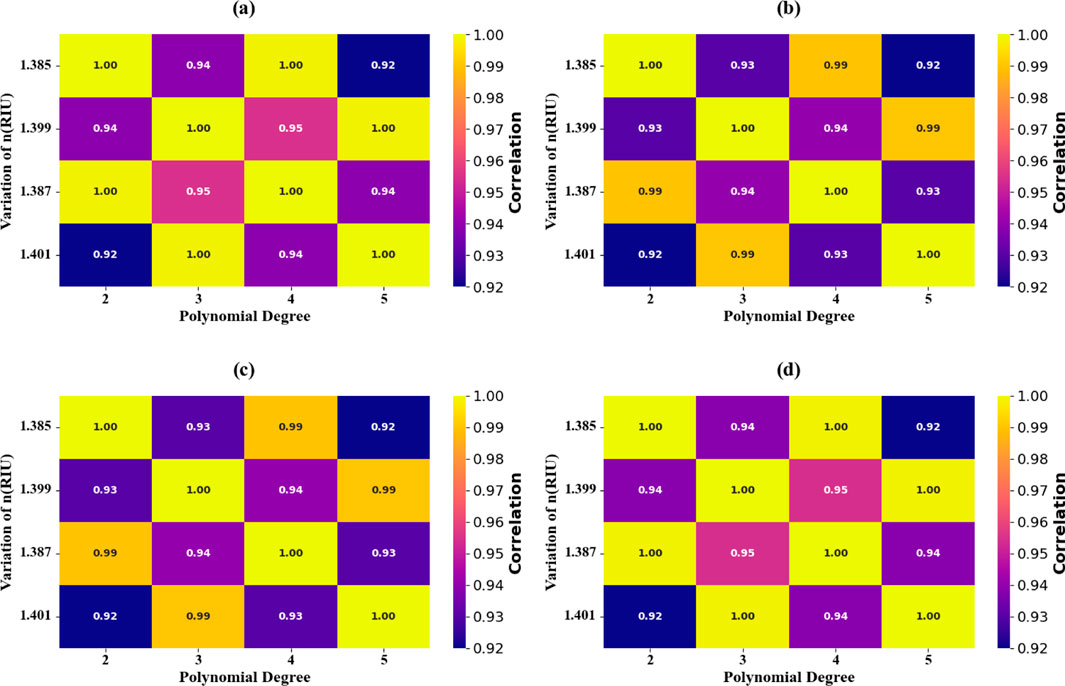
Figure 21. Heat map plot comparison highlighting the alignment between experimental and predicted absorption values for circular resonator at varying values. (a) C = 7 μm. (b) C = 7.5 μm. (c) C = 8 μm. (d) C = 8.5 μm. (e) C = 9 μm.
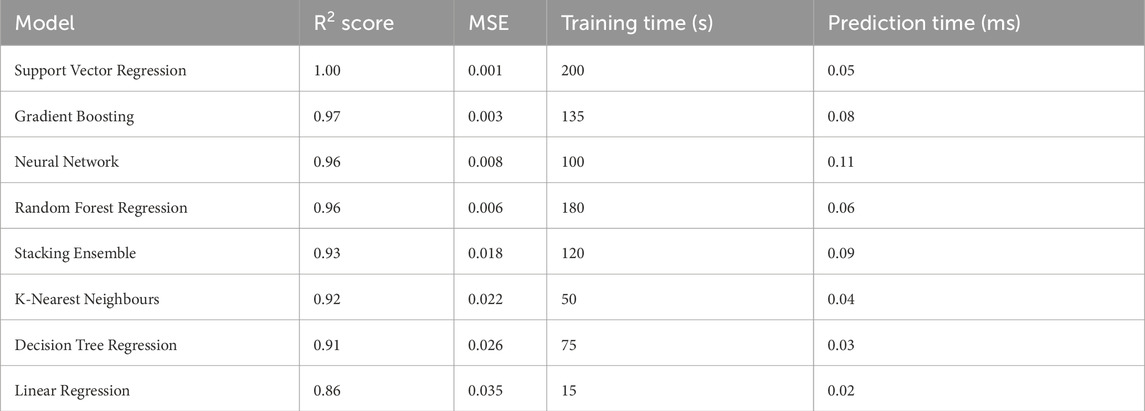
Table 6 presents a comprehensive performance evaluation comparing the Support Vector Regression (SVR) model against alternative machine learning approaches. The SVR model demonstrates superior performance with an exceptional R2 score of 1.00 and minimal mean squared error (MSE) of 0.001, indicating optimal predictive accuracy. Despite requiring extended training duration (200 s), the model compensates through highly competitive inference time (0.05 m).
4.1 Economic feasibility and manufacturing scalability
Sustainable feasibility and scalability potentials of proposed terahertz biosensor are crucial parameters with regard to implementation. The architecture of the design architecture uses materials that one can easily find such as graphene, silver and silicon dioxide, and the materials are affordable and can work with common scalable manufacturing procedures. The synthesis of graphene is very feasible and has been addressed by large-scale production at economic viable costs and in addition, when coupled with silver and silicon substrates graphene is made compatible with the aspects of conventional semiconductor production machinery. Speaking of the scalability of the manufacturing process, the metasurface-based architecture can be produced using accepted photolithography and chemical vapor deposition (CVD) processes that have been used in electronics and sensor manufacture. The techniques allow a high degree of production at reasonable prices, precision, and reproducibility. The proposed sensor uses industry-standard materials and manufacturing processes compared to other biosensor technologies that use special materials or manufacturing processes; the proposed sensor, therefore, has to be more scalable to manufacture at large volumes and still keep the production costs within capacities. Powers to develop Future developments in Graphene-material integration and optimization of the fabrication process allow a possible additional cost decrease, which can make it more accessible to many medical diagnostic applications. Developed manufacturing technologies matched with innovative material sciences make this sensor technology an option to be successful in a commercial application and clinical use.
5 Conclusion
This study presents a medical diagnostic technology that integrates terahertz spectroscopy, advanced nanomaterials, and artificial intelligence. By combining graphene-based metasurfaces with metallic resonators, the sensor shows great promise for early breast cancer screening, detecting subtle molecular changes with consistent performance across frequencies. Machine learning optimization via polynomial regression enhances reliability and establishes a framework for future biosensor development. The sensor’s dual-bit encoding extends its use to secure medical data transmission and storage. Its adaptable platform could be modified to detect other diseases, with future work focusing on device miniaturization, integration with imaging systems, and autonomous diagnostics. The proposed manufacturing approach supports scalable production, pending further cost optimization. This multidisciplinary innovation highlights the potential of converging technologies to advance precision medicine and personalized healthcare. Future work will focus on experimental realization of the proposed design, including layer-by-layer nanofabrication and microfluidic sample handling integration. Moreover, clinical translational studies will be initiated in collaboration with oncology centers to validate biomarker-specific sensitivity. We also envision sensor miniaturization for wearable breast health monitors and the integration of THz sensor arrays into portable, AI-enabled diagnostic platforms for personalized medicine.
Data availability statement
The raw data supporting the conclusions of this article will be made available by the authors, without undue reservation.
Author contributions
JW: Conceptualization, Data curation, Formal Analysis, Funding acquisition, Investigation, Methodology, Project administration, Resources, Software, Supervision, Validation, Visualization, Writing – original draft, Writing – review and editing. AM: Conceptualization, Investigation, Writing – original draft, Writing – review and editing. BS: Data curation, Software, Writing – original draft, Writing – review and editing. MA: Methodology, Supervision, Writing – original draft, Writing – review and editing. SB: Formal Analysis, Project administration, Writing – original draft, Writing – review and editing. HE: Formal Analysis, Project administration, Writing – original draft, Writing – review and editing. AR: Resources, Validation, Visualization, Writing – original draft, Writing – review and editing.
Funding
The author(s) declare that financial support was received for the research and/or publication of this article. This work was supported by King Saud University through the Ongoing Research Funding program, (ORF-2025-145), King Saud University, Riyadh, Saudi Arabia.
Conflict of interest
The authors declare that the research was conducted in the absence of any commercial or financial relationships that could be construed as a potential conflict of interest.
Generative AI statement
The author(s) declare that no Generative AI was used in the creation of this manuscript.
Publisher’s note
All claims expressed in this article are solely those of the authors and do not necessarily represent those of their affiliated organizations, or those of the publisher, the editors and the reviewers. Any product that may be evaluated in this article, or claim that may be made by its manufacturer, is not guaranteed or endorsed by the publisher.
References
1. Wu J, Hicks C. Breast cancer type classification using machine learning. J Pers Med (2021) 11(2):61–12. doi:10.3390/jpm11020061
2. Clusan L, Ferrière F, Flouriot G, Pakdel F. A basic review on estrogen receptor signaling pathways in breast cancer. Int J Mol Sci (2023) 24(7):6834. doi:10.3390/ijms24076834
3. Zielonke N, Kregting LM, Heijnsdijk EAM, Veerus P, Heinävaara S, McKee M, et al. The potential of breast cancer screening in Europe. Int J Cancer (2021) 148(2):406–18. doi:10.1002/ijc.33204
4. Janiak A, Wojtysiak P, Woźniak A, Sawicka E. Chemoprevention of breast cancer. Farm Pol (2022) 78(10):580–8. doi:10.32383/farmpol/157508
5. Bhushan A, Gonsalves A, Menon JU. Current state of breast cancer diagnosis, treatment, and theranostics. Pharmaceutics (2021) 13(5):723. doi:10.3390/pharmaceutics13050723
6. Lau KH, Tan AM, Shi Y. New and emerging targeted therapies for advanced breast cancer. Int J Mol Sci (2022) 23(4):2288. doi:10.3390/ijms23042288
7. Sun YS, Zhao Z, Yang ZN, Xu F, Lu HJ, Zhu ZY, et al. Risk factors and preventions of breast cancer. Int J Biol Sci (2017) 13(11):1387–97. doi:10.7150/ijbs.21635
8. Shang C, Xu D. Epidemiology of breast cancer. Oncologie (2022) 24(4):649–63. doi:10.32604/oncologie.2022.027640
9. Smolarz B, Zadrożna Nowak A, Romanowicz H. Breast cancer—epidemiology, classification, pathogenesis and treatment (review of literature). Cancers (2022) 14(10):2569. doi:10.3390/cancers14102569
10. Naresh V, Lee N. A review on biosensors and recent development of nanostructured materials-enabled biosensors. Sensors (Switzerland) (2021) 21(4):1109–35. doi:10.3390/s21041109
11. Kulkarni MB, Ayachit NH, Aminabhavi TM. Biosensors and microfluidic biosensors: from fabrication to application. Biosensors (2022) 12(7):543. doi:10.3390/bios12070543
12. Haleem A, Javaid M, Singh RP, Suman R, Rab S. Biosensors applications in medical field: a brief review. Sensors Int (2021) 2:100100. doi:10.1016/j.sintl.2021.100100
13. Singh AK, Mittal S, Das M, Saharia A, Tiwari M. Optical biosensors: a decade in review. Alexandria Eng J (2023) 67:673–91. doi:10.1016/j.aej.2022.12.040
14. Ramesh M, Janani R, Deepa C, Rajeshkumar L. Nanotechnology-enabled biosensors: a review of fundamentals, design principles, materials, and applications. Biosensors (2023) 13(1):40. doi:10.3390/bios13010040
15. Cesewski E, Johnson BN. Electrochemical biosensors for pathogen detection. Biosens Bioelectron (2020) 159:112214. doi:10.1016/j.bios.2020.112214
16. Costanzo H, Gooch J, Frascione N. Nanomaterials for optical biosensors in forensic analysis. Talanta (2023) 253:123945. doi:10.1016/j.talanta.2022.123945
17. Samuel VR, Rao KJ. A review on label free biosensors. Biosens Bioelectron X (2022) 11:100216. doi:10.1016/j.biosx.2022.100216
18. Kaur B, Kumar S, Kaushik BK. Recent advancements in optical biosensors for cancer detection. Biosens Bioelectron (2022) 197:113805. doi:10.1016/j.bios.2021.113805
19. Sengupta J, Hussain CM. CNT and graphene-based transistor biosensors for cancer detection: a review. Biomolecules (2023) 13(7):1024. doi:10.3390/biom13071024
20. Azab MY, Hameed MFO, Obayya SSA. Overview of optical biosensors for early cancer detection: fundamentals, applications and future perspectives. Biology (2023) 12(2):232. doi:10.3390/biology12020232
21. Alsharabi RM, Rai S, Mohammed HY, Farea MA, Srinivasan S, Saxena PS, et al. A comprehensive review on graphene-based materials as biosensors for cancer detection. Oxford Open Mater Sci (2023) 3(1). doi:10.1093/oxfmat/itac013
22. An T, Wen J, Dong Z, Zhang Y, Zhang J, Qin F, et al. Plasmonic biosensors with nanostructure for healthcare monitoring and diseases diagnosis. Sensors (2023) 23(1):445. doi:10.3390/s23010445
23. Pandey PS, Raghuwanshi SK, Kumar S. Recent advances in two-dimensional materials-based kretschmann configuration for SPR sensors: a review. IEEE Sensors J (2022) 22(2):1069–80. doi:10.1109/JSEN.2021.3133007
24. Mathivanan A, Veeraselvam A, Mohammed GNA. A novel miniaturized THz refractive index-based electric permittivity sensor. IEEE Trans Plasma Sci (2024) 52(1):160–7. doi:10.1109/TPS.2024.3351434
25. Veeraselvam A, Mohammed GNA, Savarimuthu K, Vijayaraman PD. An ultra-thin multiband refractive index-based carcinoma sensor using THz radiation. IEEE Sens J (2022) 22(3):2045–52. doi:10.1109/JSEN.2021.3134663
26. Sizov F. THz radiation sensors. Opto-electronics Rev (2010) 18(1):10–36. doi:10.2478/s11772-009-0029-4
27. Zhang W, Lin J, Yuan Z, Lin Y, Shang W, Chin LK, et al. Terahertz metamaterials for biosensing applications: a review. Biosensors (2023) 14(1):3. doi:10.3390/bios14010003
28. Lee SH, Lee YK, Lee SH, Kwak J, Song HS, Seo M. Detection and discrimination of SARS-CoV-2 spike protein-derived peptides using THz metamaterials. Biosens Bioelectron (2022) 202:113981. doi:10.1016/j.bios.2022.113981
29. Weisenstein C, Richter M, Wigger AK, Bosserhoff A, Haring Bolívar P. Substrate-integrated microfluidics for sensitive biosensing with complementary THz metamaterials in water. Appl Phys Lett (2022) 120(5). doi:10.1063/5.0076379
30. Fatima MA, Ariffin IA, Alwi MNM, Hamid JA, Yajid MSA. RESEARCH AND TESTING OF COVID-19 IN COORDINATED EFFORTSFROM A DIAGNOSTICS LABORATORY PERSPECTIVE. Int J Med Toxicol Leg Med (2021) 24(1–2):29–40. doi:10.5958/0974-4614.2021.00006.1
31. veluchamy D, Rajan MSM, Prajapati YK. Enhancing breast cancer biomarker detection with a portable biosensor utilizing flower core photonic crystal fiber architecture. Plasmonics (2024) 20(123456789):2345–57. doi:10.1007/s11468-024-02470-7
32. Bing P, Zhao J, Zhang X, Li Z, Zhang H, Wang J, et al. Highly sensitive photonic crystal fiber optic sensor for cancer cell detection. Eur Phys J Plus (2024) 139(6):543. doi:10.1140/epjp/s13360-024-05360-3
33. Vasimalla Y, Pradhan HS. Modeling of a novel SCHOTT B270 prism based SPR sensor using Ag-Si-BP/MXene structure for detection of specific biological samples. Opt Quan Electron. (2022) 54(10):612–24. doi:10.1007/s11082-022-04022-x
34. Rafiee E, Negahdari R. Cancer cell detection biosensor based on graphene-plasmonic split square-ring-shaped nanostructure. Plasmonics (2023) 18(2):431–40. doi:10.1007/s11468-022-01777-7
35. Bhuyan A, Khamaru A, Kumar A. Black phosphorus-based slotted D-Shaped PCF SPR sensor for cancer detection. Plasmonics (2024) 20(123456789):5201–13. doi:10.1007/s11468-024-02715-5
36. Ansari G, Pal A, Srivastava AK, Verma G. Bi-metallic, ferric oxide, and carbon nanotube-assisted SPR sensor for cancer detection. J Mater Res (2024) 39(14):1977–88. doi:10.1557/s43578-024-01358-w
37. Kumar R, Shah RS, Alsubaie AS, Ben Ali N, Kumar M, Pal A. Hafnium diselenide 2D material-based surface plasmon resonance sensor for detection of basal cancer. Plasmonics (2024) 20(123456789):3117–26. doi:10.1007/s11468-024-02518-8
38. Meng F, Li Z, Li J, Meng L, Yin X, Bian W, et al. An active method for coupling laser with a high-finesse fabry–pérot cavity in ultra-stable lasers. Opt Laser Technol (2024) 171:110371. doi:10.1016/j.optlastec.2023.110371
39. Mavrona E, Rajabali S, Appugliese F, Andberger J, Beck M, Scalari G, et al. THz ultrastrong coupling in an engineered fabry-perot cavity. ACS Photon (2021) 8(9):2692–8. doi:10.1021/acsphotonics.1c00717
40. Güell-Grau P, Pi F, Villa R, Eskilson O, Aili D, Nogués J, et al. Elastic plasmonic-enhanced fabry–pérot cavities with ultrasensitive stretching tunability. Adv Mater (2022) 34(7):e2106731. doi:10.1002/adma.202106731
41. Di Toma A, Brunetti G, Colapietro P, Ciminelli C. High-resolved near-field sensing by means of dielectric grating with a box-like resonance shape. IEEE Sens J (2024) 24(5):6045–53. doi:10.1109/JSEN.2024.3349948
42. García-Rupérez J, Torrijos-Morán L. Bimodal interferometric photonic sensors based on periodic configurations. In: Optics InfoBase conference papers (2021). doi:10.1364/sensors.2021.sf2d.1
43. Jadeja R, Surve J, Parmar T, Patel SK, Al-Zahrani FA. Detection of peptides employing a THz metasurface based sensor. Diam Relat Mater (2023) 132:109675. doi:10.1016/j.diamond.2022.109675
44. Wekalao J, Alsalman O, Patel SK. Graphene metasurface biosensor design for label-free peptide detection with machine learning optimization based on support vector regression with polynomial kernel. Diam Relat Mater (2025) 153(January):112053. doi:10.1016/j.diamond.2025.112053
45. Almawgani AHM, Surve J, Parmar T, Armghan A, Aliqab K, Ali GA, et al. A graphene-metasurface-inspired optical sensor for the heavy metals detection for efficient and rapid water treatment. Photonics (2023) 10(1):56. doi:10.3390/photonics10010056
46. Wekalao J, Mandela N, Kumar A, Sujatha S, Dharani V, Poornima R, et al. Graphene metasurface based biosensor for COVID - 19 detection in the terahertz regime with machine learning optimization using K - Nearest neighbours regression. Plasmonics (2024) 20(123456789):5447–69. doi:10.1007/s11468-024-02686-7
47. Kundal S, Khandelwal A. Multiplexed hybrid plasmonic ring resonator sensor for label free biosensing applications. Sens Imaging (2023) 24(1):16. doi:10.1007/s11220-023-00422-9
48. Wekalao J, Siddharthan N, Shibu S, Satyanarayana G, Karthikeyan KV, Mallan S, et al. High sensitivity terahertz biosensor based on graphene/methylammonium lead halide metasurface with machine learning - enhanced pathogen detection. Plasmonics (2024) 20(123456789):4747–68. doi:10.1007/s11468-024-02682-x
49. Patel SK, Surve J, Katkar V, Parmar J, Al-Zahrani FA, Ahmed K, et al. Encoding and tuning of THz metasurface-based refractive index sensor with behavior prediction using XGBoost regressor. IEEE Access (2022) 10:24797–814. doi:10.1109/ACCESS.2022.3154386
50. Parmar J, Patel SK. Encrypted and tunable graphene-based metasurface refractive index sensor. Microw Opt Technol Lett (2022) 64(1):77–82. doi:10.1002/mop.33049
51. Patel SK, Alsalman O. Design and development of graphene-based double split ring resonator metasurface biosensor using MgF2-gold materials for blood cancer detection. Opt Quan Electron. (2024) 56(7):1120–0. doi:10.1007/s11082-024-07068-1
52. Surve J, Patel SK, Parmar J. Design of cost-efficient graphene metasurface based pregnancy test with NOR gate realization and parametric optimization. IEEE Sens J (2022) 22:23937–44. doi:10.1109/JSEN.2022.3218797
53. Ferdous AHMI, Rani L, Islam MS, Noor KS, Roy S, Eid MMA, et al. Development and enhancement of PCF-Based sensors for terahertz-frequency region breast cancer cell detection. Cell Biochem. Biophys. (2024) 82:2837–52. doi:10.1007/s12013-024-01399-2
54. Wekalao J, Mandela N. Graphene metasurface - based biosensor for direct dopamine detection utilizing surface plasmon resonance in the terahertz regime with machine learning optimization via K - Nearest neighbors regression. Plasmonics (2024)(123456789). doi:10.1007/s11468-024-02570-4
55. Bulbul AAM, Rahaman H, Biswas S, Hossain MB, Al Nahid A. Design and numerical analysis of a PCF-Based bio-sensor for breast cancer cell detection in the THz regime. Sens Bio-sensing Res (2020) 30:100388. doi:10.1016/j.sbsr.2020.100388
56. Wekalao J. Design and optimization of a graphene-enhanced terahertz metasurfaces surface plasmon resonance biosensor for high-sensitivity peptide detection with machine learning optimization based on XGBoost regressor. Plasmonics (2024)(123456789). doi:10.1007/s11468-024-02679-6
57. Chaudhary S, Malik AK, Kumar A, Thapa KB, Nautiyal VK. Ultrasensitive high quality terahertz biosensor based on 1D photonic crystal for the detection of breast cancer cells. Sens Imaging (2024) 25(1):73–16. doi:10.1007/s11220-024-00521-1
58. Yadav S, Lohia P, Dwivedi DK. Quantitative analysis of highly efficient PCF-Based sensor for early detection of breast cancer cells in THz regime. J Opt (2024) 53(3):2642–55. doi:10.1007/s12596-023-01404-6
59. Bijalwan A, Singh BK, Rastogi V. Analysis of one-dimensional photonic crystal based sensor for detection of blood plasma and cancer cells. Optik (Stuttg) (2021) 226:165994. doi:10.1016/j.ijleo.2020.165994
60. Brereton RG, Lloyd GR. Support Vector Machines for classification and regression. The Analyst (2010) 135(2):230–267. doi:10.1039/b918972f
61. Natekin A, Knoll A. Gradient boosting machines, a tutorial. Front. Neurorobot. (2013) 7. doi:10.3389/fnbot.2013.00021
Keywords: early cancer diagnosis, metamaterial sensors, biomedical sensing, nanophotonic, graphene
Citation: Wekalao J, Mehaney A, Salah B, Abukhadra MR, Bellucci S, Elsayed HA and Rajakannu A (2025) High-sensitivity surface plasmon resonance biosensor with gold-based metasurfaces and polynomial regression optimization for early breast cancer detection. Front. Phys. 13:1659054. doi: 10.3389/fphy.2025.1659054
Received: 03 July 2025; Accepted: 22 July 2025;
Published: 10 October 2025.
Edited by:
Rajib Biswas, Tezpur University, IndiaReviewed by:
Giuseppe Brunetti, Politecnico di Bari, ItalyAnushkannan NK, Kathir College of Engineering, India
Copyright © 2025 Wekalao, Mehaney, Salah, Abukhadra, Bellucci, Elsayed and Rajakannu. This is an open-access article distributed under the terms of the Creative Commons Attribution License (CC BY). The use, distribution or reproduction in other forums is permitted, provided the original author(s) and the copyright owner(s) are credited and that the original publication in this journal is cited, in accordance with accepted academic practice. No use, distribution or reproduction is permitted which does not comply with these terms.
*Correspondence: Jacob Wekalao, amFjb2IxOTAyQG1haWwudXN0Yy5lZHUuY24=