 Guanbing Zhao
 Jiamiao Zheng2
- 1School of Intellectual Property, Jiangsu University, Zhenjiang, China
- 2School of Management, Jiangsu University, Zhenjiang, China
Purpose: This study investigates the knowledge-sharing decision-making mechanisms in logistics service supply chains (LSSCs), focusing on the strategic interactions between logistics service integrators and providers.
Design/methodology/approach: The study employs evolutionary game theory to model dynamic interactions in LSSCs. Numerical simulations using MATLAB are conducted to validate the theoretical findings and examine the influence of critical parameters on equilibrium outcomes.
Findings: Government incentive subsidies can effectively promote cooperation between logistics service integrators and providers. Appropriate government incentive policies help promote fair distribution of internal revenue within the logistics service supply chain and enhance the competitiveness of the overall supply chain.
Originality/value: This study pioneers a tripartite evolutionary game model for knowledge sharing in LSSCs, analyzing the relationship between government incentives and enterprise strategies relationships. By introducing parameters such as subsidy ratios, technology maturity, and trust, it extends traditional models to address collaboration dilemmas and unlock overall supply chain value.
1 Introduction
With the accelerating process of global economic integration and the in-depth penetration of digital technologies, the logistics service supply chain (LSSC) has emerged as a core framework driving the upgrading of the modern logistics industry. This collaborative system, which is composed of logistics service providers, integrators, and demanders, demonstrates significant advantages in improving operational efficiency, reducing transaction costs, and enhancing market responsiveness through resource integration and process optimization. However, in practice, there are widespread knowledge barriers and information silos among various entities in the supply chain. Specifically, the regional operational experience possessed by service providers is difficult to transfer across nodes, and there is a transmission loss between the system scheduling knowledge of integrators and the personalized demands of demanders. As a result, the overall knowledge potential of the supply chain cannot be effectively converted into collaborative efficiency. Such knowledge asymmetry not only restricts the customization level of logistics solutions but also significantly increases the operational risks and coordination costs of the supply chain against the backdrop of intensified fluctuations in market demand. Therefore, exploring the driving mechanisms and decision-making logic of knowledge sharing (KS) in the logistics service supply chain has become a key proposition to solve the dilemma of inter-entity collaboration and unlock the overall value of the supply chain.
The current academic research in the field of LSSC mostly focuses on the pricing decisions, coordination mechanisms, and service quality control, among others. At the level of concept definition and theoretical construction, Cui conducted a systematic exploration of the evolution law, essential attributes, architecture model, feature analysis, and management theory system of the LSSC [1]. In terms of pricing, studies explore the structural, modal, and other factors. He et al. examined blockchain’s impact via a fresh product supply chain with overseas suppliers and cross-border platforms [2]. Zhang et al. highlighted centralized decision advantages in e-commerce chains through comparative models [3]. Jiang et al. used optimal control and Stackelberg theory to determine the optimal strategies under advertising delays in fresh agricultural chains. For coordination [4], Yang and Liu (2023) applied Stackelberg game theory to a two-level cross-border logistics chain and analyzed the effects of customs clearance via factor analysis [5]. He et al. proposed a novel Stackelberg model with cost-revenue sharing to incentivize logistics capability investment [6]. Gao theoretically explained the connotation boundaries, structural paradigms, and implementation paths of the logistics service integrator (LSI) from the perspective of integration logic [7]. Qiao designed an evolutionary game model for KS within the industrialized building supply chain, grounded in the hypothesis of bounded rationality, thereby uncovering the driving mechanisms and constraints governing knowledge flow [8]. In the multi-agent sharing governance scenario, Qiu constructed a tripartite KS evolutionary game model including the government, regulators, and end-users and analyzed the moderating effect of policy intervention on KS behavior [9]. Xu considered the agricultural product supply chain as the research object and, combined with the system dynamics method, verified the positive incentive effect of government regulation on the probability of KS between growers and suppliers [10]. Regarding service quality, Zhang G and Zhang Z. linked regional logistics network stability to total revenue via an evolutionary game model [11]. Zeng et al. noted that transparent information environments encourage CCL providers to enhance fresh-keeping, thus benefiting producers and distributors [12]. Although existing research has built multi-dimensional theoretical frameworks, it remains centered on traditional operational management. Amid the deepening digital transformation, research on digital cooperation requires further theoretical expansion.
Knowledge sharing in supply chain operations is defined as the process of building information networks to enable real-time knowledge connectivity, which facilitates collaborative practices among firms. As a cornerstone of modern supply chain management, its effectiveness directly enhances the decision-making quality and overall supply chain performance. High-quality knowledge flow and multi-dimensional interaction mechanisms are critical for achieving dynamic equilibrium and fostering value co-creation across supply chain ecosystems.
On the subject of supply chain knowledge sharing, Ren used stochastic Petri nets to model dynamic games, analyzing strategy evolution and expected revenue under uncertainty [13]. Qiao developed an evolutionary model for industrialized construction supply chains to identify the drivers and constraints of knowledge flow [8]. Wang and Bao explored knowledge-sharing trajectories in cluster supply chains via evolutionary games [14]. Regarding multi-agent governance, Qiu et al. built a tripartite evolutionary game model (government, regulators, and users) to analyze policy intervention effects [9]. Xu verified the government supervision’s positive impact on agricultural product supply chain knowledge sharing via system dynamics [10]. Li et al. found that benefit-cost marginal differences affect the fresh produce supply chain knowledge-sharing initiative through evolutionary games [15]. Gu quantified informatization, policy incentives, and costs on logistics knowledge-sharing evolution via system dynamics [16]. Overall, existing research focuses on scenario-specific supply chain knowledge sharing, with limited studies on universal logistics service supply chains—failing to explain interest relationships and evolution paths therein, thus necessitating further exploration.
Against this backdrop, this study focuses on the LSSC, specifically examining the KS relationship between LSI and logistics service provider (LSP). By constructing an evolutionary game model, this study analyzes the strategy selection and dynamic evolution paths of both parties in the KS process. Furthermore, this study explores the decision-making mechanisms of supply chain participants in KS behavior under government policy incentives (GPIs) and identifies the key factors affecting this behavior and its underlying logic. The research results are intended to provide a theoretical reference for the practice of KS cooperation among logistics enterprises, help realize the collaborative creation of supply chain value, and promote the digital transformation process of LSSCs.
2 Tripartite evolutionary game model
Integrators, leveraging their capabilities in process optimization, data integration, and resource allocation, formulate customized matching and allocation strategies in accordance with customer demands, while maintaining advantages in user behavior analysis and technical support. In contrast, providers, relying on physical resources such as transportation equipment and infrastructure, undertake businesses including warehousing, trunk transportation, and last-mile delivery, and they possess well-developed logistics networks and professional teams. Governments, based on their own interests and social benefits, formulate incentives and subsidy policies for knowledge-sharing cooperation among enterprises to promote such collaborations. This not only contributes to enhancing their reputation in the industry but also accelerates the effective integration of logistics resources and advances the digital transformation process of the entire logistics industry. Based on this, this paper constructs a tripartite evolutionary game model comprising logistics service integrators, logistics service providers, and the government to explore the interest relationships and strategy evolution paths of all participants in the knowledge sharing process within the logistics service supply chain. It should be clarified that the knowledge mentioned in this model covers various types of sharable knowledge, which, in terms of forms of expression, includes explicit knowledge and tacit knowledge, and in terms of acquisition approaches, it includes experiential knowledge and deductive knowledge, among others.
Based on the hypothesis of bounded rationality, this chapter constructs an evolutionary game model involving logistics service integrators, providers, and the government, where the three parties make decisions as decision-making subjects aiming to maximize utility. The corresponding strategy selection probabilities are as follows: the probability of LSI engaging in KS is
Assumption 1. The basic revenues of the integrator and the provider when operating independently, along with the basic revenue of the government, are denoted as
Assumption 2. Drawing on the studies by [17] and [18], this paper assumes that the total input cost for knowledge sharing between the integrator and the provider is
Assumption 3. Drawing on the study by [19], it is assumed that when one party (either the integrator or the provider) chooses to share knowledge while the other does not, the knowledge-sharing party gains its own knowledge-sharing revenue
Assumption 4. Drawing on the study by [9], this paper assumes that when the integrator and the provider reach a knowledge-sharing agreement, it generates a value co-creation revenue from supply-chain knowledge sharing,
Assumption 5. Drawing on the research by [20], when the government provides incentive subsidies for enterprises’ knowledge sharing, it gains benefits such as reputation,
Assumption 6. The government distributes knowledge-sharing subsidies to logistics enterprises, which are allocated between the integrator and the provider at a certain ratio, where the integrator receives
Based on the above assumptions, the payoff matrix for the evolutionary game composed of LSI, LSP, and the government is shown in Table 1:
LSI, LSP, and the government can all select the optimal strategy based on their respective benefits and other factors. In summary, the evolutionary game model is solved as follows.
The benefits for LSI when engaging in KS cooperation and when not engaging in KS cooperation are shown in Formulas 1, 2 respectively.
The average expected return of their KS cooperation decision is shown in Formula 3.
The benefits for LSP when engaging in KS cooperation and when not engaging in KS cooperation are shown in Formulas 4, 5 respectively.
The average expected return of their KS cooperation decision is shown in Formula 6.
The benefits for the government when providing KS cooperation subsidies and when not providing KS cooperation subsidies are shown in Formulas 7, 8 respectively.
The average expected return of their KS cooperation decision is shown in Formula 9.
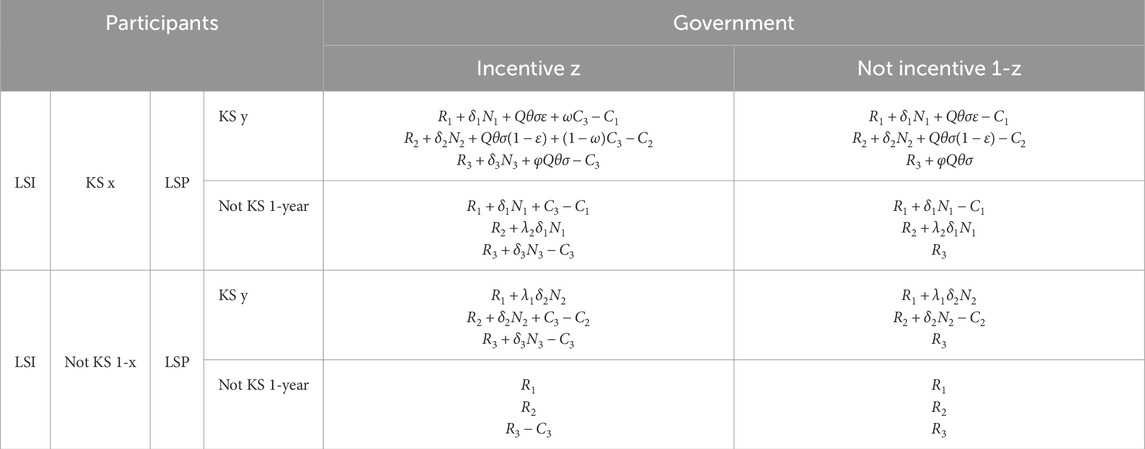
Table 1. Tripartite evolutionary game model.
2.1 Replicated dynamic equation
1. Based on the above analysis, the replicated dynamic equation for the KS cooperation strategy of LSI is shown in Formula 10.
2. The replicated dynamic equation for the LSP KS cooperation strategy is shown in Formula 11.
3. The replicated dynamic equation for the government’s KS cooperation subsidy strategy is shown in Formula 12.
2.2 Model analysis and solution
Based on the dynamic replication equations of the three parties, the Jacobian (
Setting
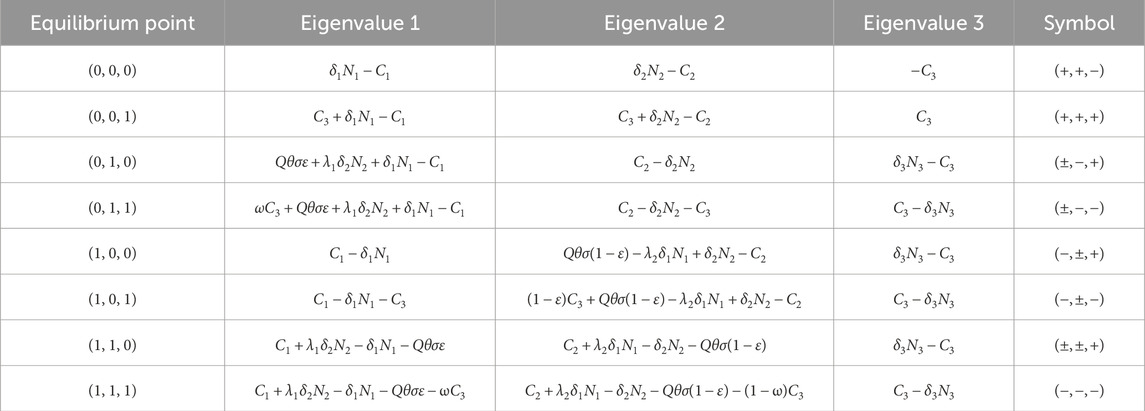
Table 2. Local stability analysis.
The table shows that in the tripartite evolutionary game involving the LSI, LSP, and the government, the point (1, 1, 1) is identified as a stable point. Additionally, the points (0, 1, 1) and (1, 0, 1) have all negative eigenvalues, while the other points are unstable. Based on this, the following analysis is conducted.
Scenario 1: When
Scenario 2: When
Scenario 3: When
3 Evolutionary game simulation analysis
To verify the conclusions of the above evolutionary game analysis, this paper uses MATLAB for numerical simulations to examine how parameter changes affect the system’s evolutionary path. Guided by economic assumptions and empirical judgments, parameters are assigned based on studies by [21, 22] and expert experience. Stability analysis of the equilibrium points across scenarios further explores the tripartite game’s evolutionary trends and model validity, while sensitivity analysis of the key parameters intuitively identifies the factors influencing strategy evolution and parameter sensitivities in logistics service supply chain knowledge sharing.
3.1 Numerical analysis of the stability of the ideal equilibrium point
Scenario 1: When
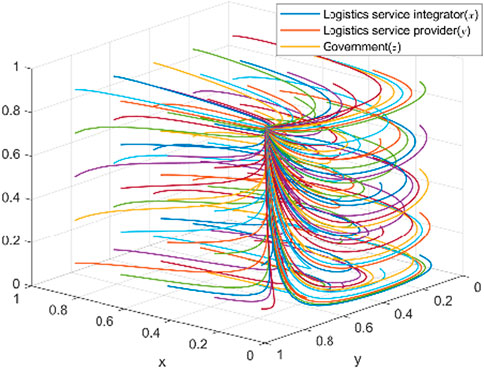
Figure 1. Scenario 1 simulation.
Scenario 2: When
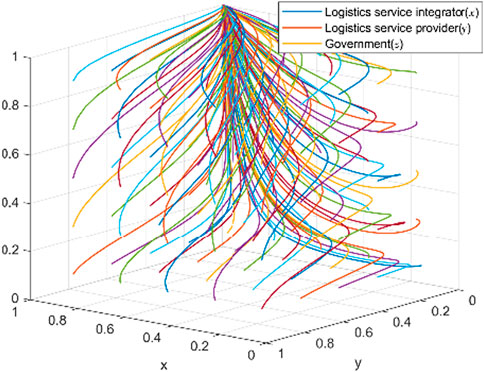
Figure 2. Scenario 2 simulation.
Scenario 3: When
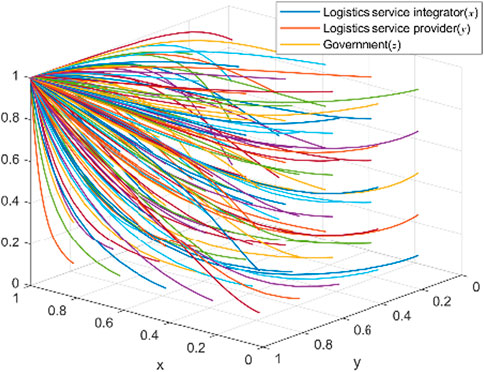
Figure 3. Scenario 3 simulation.
For parameter assignment: Referring to the application of the Shapley value method in logistics collaboration, integrators typically have a distribution ratio exceeding 50% because of their roles in resource integration and risk underwriting. To satisfy
3.2 Numerical analysis of parameter sensitivity
To more intuitively analyze the key factors influencing the strategy evolution of various subjects and the sensitivity of the related parameters during the knowledge-sharing process in the logistics service supply chain, the following section conducts a sensitivity analysis with the evolutionary stable point (1, 1, 1) as the initial scenario.
3.2.1 Impact of government incentive subsidies
As indicated by the previous analysis, the amount of incentive subsidies
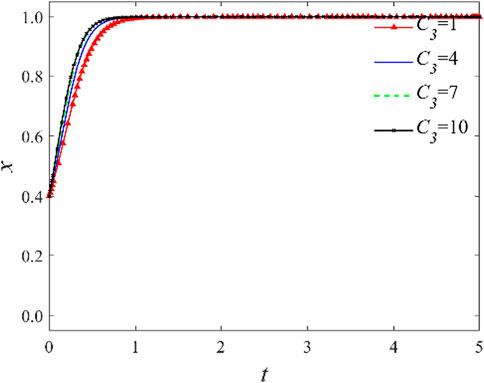
Figure 4. Influence of government incentives and subsidies on the x-axis.
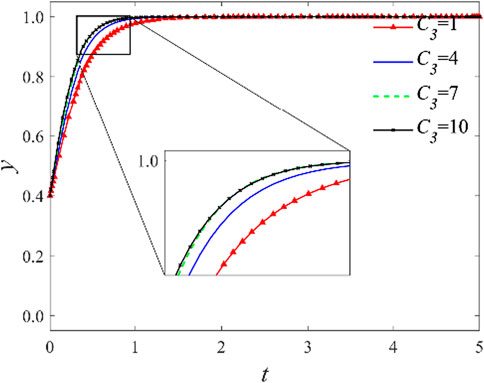
Figure 5. Influence of government incentives and subsidies on the y-axis.
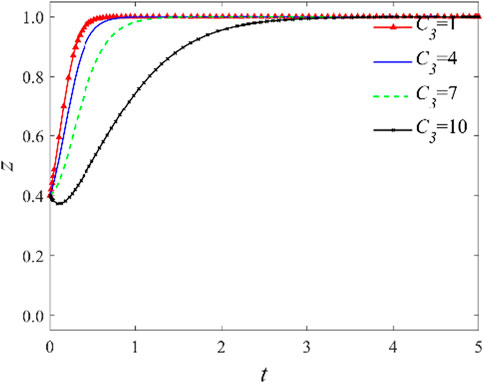
Figure 6. Influence of government incentives and subsidies on the z-axis.
3.2.2 Impact of the distribution ratio of government incentive subsidies
The aforementioned analysis shows that the distribution ratio of government incentive subsidies significantly affects knowledge-sharing cooperation decisions between integrators and providers. With other conditions held constant, an investigation of the distribution ratio
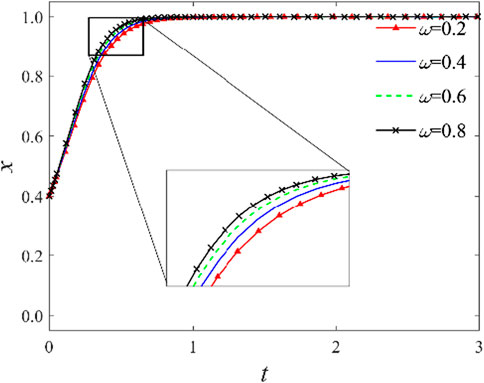
Figure 7. Influence of the government incentive subsidy distribution ratio on the x-axis.
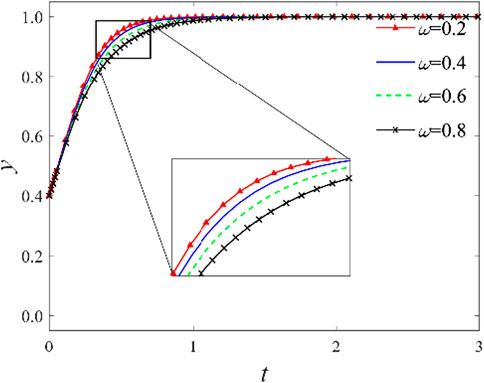
Figure 8. Influence of the government incentive subsidy distribution ratio on the y-axis.
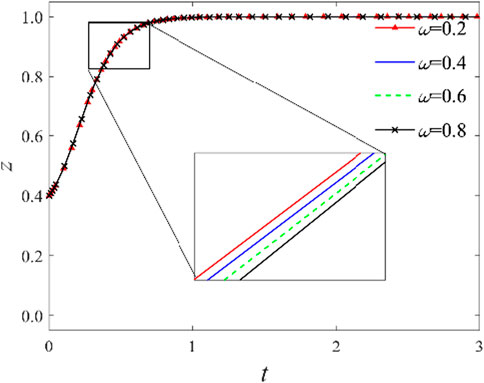
Figure 9. Influence of the government incentive subsidy distribution ratio on the z-axis.
3.2.3 Impact of the distribution ratio of shared value benefits
As shown in previous analyses, the method of distributing co-created value benefits significantly influences knowledge-sharing cooperation decisions between logistics service integrators and providers. With all other conditions held constant, the distribution ratio

Figure 10. Impact of co-creation value income distribution on the x-axis.
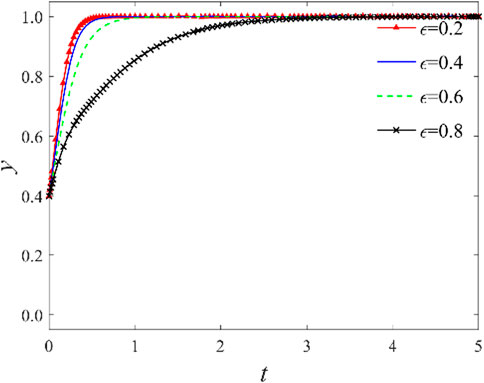
Figure 11. Impact of co-creation value income distribution on the y-axis.
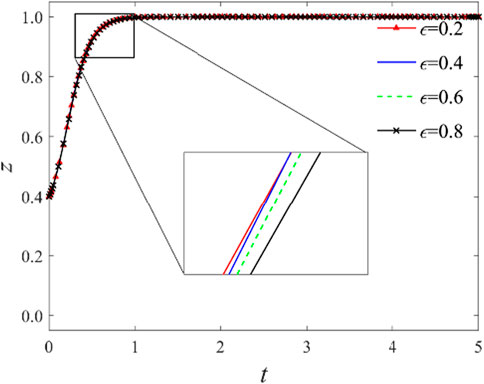
Figure 12. Impact of co-creation value income distribution on the z-axis.
3.2.4 Impact of industry knowledge-sharing technology maturity
The parameter
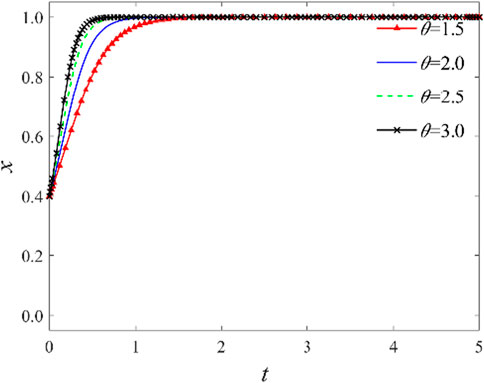
Figure 13. Impact of maturity of knowledge-sharing technology distribution on the x-axis.

Figure 14. Impact of maturity of knowledge-sharing technology distribution on the y-axis.
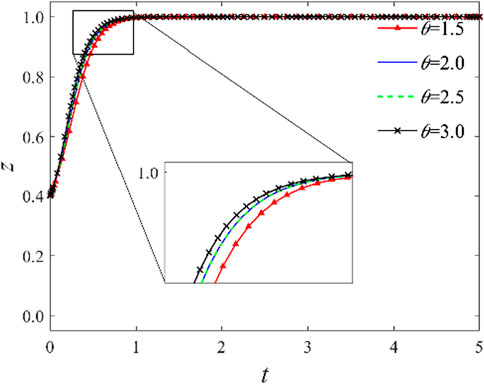
Figure 15. Impact of maturity of knowledge-sharing technology distribution on the z-axis.
3.2.5 Impact of trust level among logistics enterprises
The parameter
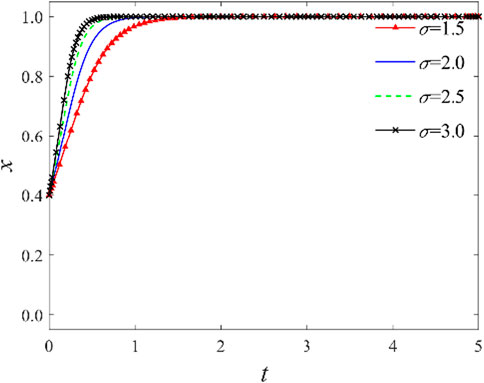
Figure 16. Impact of the trust level among logistics enterprise distribution on the x-axis.
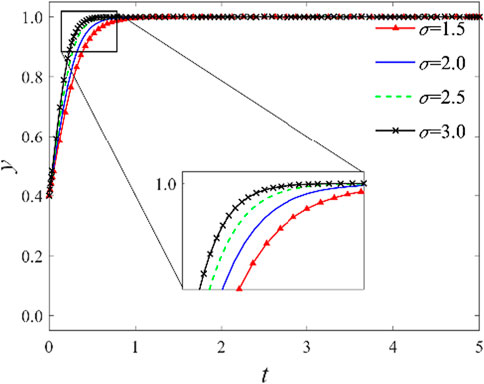
Figure 17. Impact of the trust level among logistics enterprise distribution on the y-axis.
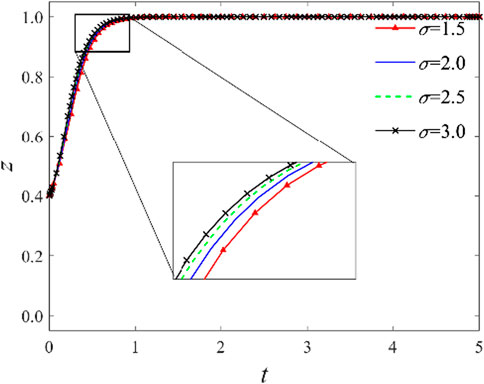
Figure 18. Impact of the trust level among logistics enterprise distribution on the z-axis.
4 Conclusions and recommendations
4.1 Research conclusions
This study centers on knowledge-sharing collaboration within logistics service supply chains. Guided by the assumption of bounded rationality, it establishes a tripartite game analysis framework incorporating government participation and profoundly examines the impact pathways through which core variables—such as policy incentives, inter-enterprise mechanisms for distributing knowledge-sharing gains, and subsidy allocation—influence system evolution. Based on the research findings, strategic recommendations for advancing knowledge sharing are put forward based on three dimensions: logistics service integrators, providers, and government authorities. These recommendations aim to enhance the overall performance of the supply chain and promote the realization of industrial collaborative value. The key research conclusions of this paper are as follows:
1. When selecting partners, integrators should prioritize the potential providers’ knowledge-sharing costs, knowledge quality, cooperation environment, and expected benefits, preferring those with high enthusiasm, quality resources, strong reputations, and proven cooperation records. For industry-wide value co-creation, matching with providers on value co-creation benefits is critical.
2. Government incentive subsidies effectively boost cooperation willingness between integrators and providers, but their impact depends on the mechanism design. Rational subsidies stimulate cooperation, while unfair or flawed designs may trigger refusal due to perceived inequity. Appropriate policies also promote fair benefit distribution within the supply chain, thus enhancing the overall competitiveness.
4.2 Countermeasure recommendations
1. As core hubs, logistics service integrators should address knowledge-sharing barriers from technical constraints by building high-caliber technical teams, optimizing collaborative innovation mechanisms to enhance algorithmic and intelligent decision-making capabilities, and improving data analysis efficiency. They should establish efficient data interconnection platforms to integrate the user behavior and service process data for real-time and accurate demand response and share non-core data to strengthen the providers’ collaboration willingness, thereby fostering symbiotic relationships and enhancing full-chain service capacity and market responsiveness.
2. Logistics service providers, as key executors, need to overcome limited data analysis capabilities by establishing systematic data management frameworks, integrating full-chain logistics data, and adopting intelligent analysis tools to strengthen data-driven decision making. They should proactively connect upstream and downstream nodes to build collaborative networks, advance dual-cycle mechanisms, and improve marginal benefits via digital transformation. Leveraging the policy and market resources, providers should accelerate intelligent facility development with government subsidies and industrial funds, establish information synchronization platforms, enhance inter-partner trust, and promote joint data development and industry-wide value co-creation.
3. Governments, as supervisors and guides, should establish multi-level incentive mechanisms (e.g., tax incentives and credit rating linkage) to foster enterprise collaboration in data sharing and resource integration, with dynamic adjustments ensuring policy foresight. They should upgrade governance structures by building cross-departmental, cross-level information platforms, formulating unified data exchange standards and conflict-mediation mechanisms, and integrating blockchain and smart contracts to ensure transparency and transaction security. Additionally, governments should improve credit evaluation systems, integrate enterprise credit with industry access, strengthen irregularity tracing, introduce third-party audits, and build a credit-based market environment to drive high-quality logistics development.
Data availability statement
The original contributions presented in the study are included in the article/supplementary material; further inquiries can be directed to the corresponding author.
Author contributions
GZ: Conceptualization, Methodology, Writing – review and editing. JZ: Conceptualization, Methodology, Writing – review and editing. KZ: Writing – review and editing, Methodology.
Funding
The author(s) declare that no financial support was received for the research and/or publication of this article.
Conflict of interest
The authors declare that the research was conducted in the absence of any commercial or financial relationships that could be construed as a potential conflict of interest.
Generative AI statement
The author(s) declare that no Generative AI was used in the creation of this manuscript.
Any alternative text (alt text) provided alongside figures in this article has been generated by Frontiers with the support of artificial intelligence and reasonable efforts have been made to ensure accuracy, including review by the authors wherever possible. If you identify any issues, please contact us.
Publisher’s note
All claims expressed in this article are solely those of the authors and do not necessarily represent those of their affiliated organizations, or those of the publisher, the editors and the reviewers. Any product that may be evaluated in this article, or claim that may be made by its manufacturer, is not guaranteed or endorsed by the publisher.
References
1. Cui A, Liu W, Zhang X. The basic theoretical framework of logistics service supply chain. J Shanghai Maritime Univ (2008) 29(1), 1–6.
2. He Y, Chen L, Xu Q. Optimal pricing decisions for a global fresh product supply chain in the blockchain technology era. Int J Logistics Res Appl (2024) 27(5): 649–66. doi:10.1080/13675567.2021.1981275
3. Zhang Y, Fu S, Fan S, Ma F. Game strategy analysis on E-commerce platform supply chain with shared logistics service: a chaos perspective. Appl Mathematics Comput (2025) 499: 129414, doi:10.1016/j.amc.2025.129414
4. Yong-Chang J, Jia-xur C, He-Jie Z. Research on inventory control and pricing decisions in the supply chain of fresh agricultural products under the advertisement delay effect. IEEE Access 12, 197468, 87. doi:10.1109/access.2024.35221372024).
5. Yang Y, Liu Y. Contracts analysis of cross-border logistics service supply chain: with a consideration of customs clearance level. Ind Eng J (2023) 26(01):52–62+90. doi:10.3969/j.issn.1007-7375.2023.01.006
6. He C, An Q, Xu X, Zhang G. Enhancing resilience and coordination in sustainable logistics service supply chains through integrated investment contracts. Sustainability (2024) 16(23): 10644, doi:10.3390/su162310644
7. Gao Z, Zhu W, Chen S. Research on the integration of logistics service supply chain. China Logistics Economy (2017) 31(10), 46–54. doi:10.14089/j.cnki.cn11-3664/f.2017.10.006
8. Qiao S, Wang Q. The impact mechanism of collaborative innovation activities and BIM application on innovation performance in construction supply chains. J Civil Eng Management (2021) 38(5), 91–7. doi:10.13579/j.cnki.2095-0985.2021.05.014
9. Qiu X, Wu Y. An evolutionary game study on supply chain knowledge sharing under fairness concerns. Sci Technology Management Res (2023) 43(2), 151–9. doi:10.3969/j.issn.1000-7695.2023.2.019
10. Xu S, Ji M. Dynamic modeling and simulation of how knowledge sharing affects the competitiveness of agricultural product supply chains. Reg Res Development (2020) 39(3), 47–52. doi:10.3969/j.issn.1003-2363.2020.03.009
11. Zhang G, Zhang Z. An evolutionary game model of a regional logistics service supply chain complex network in a blockchain environment. Systems (2025) 13(1): 32, doi:10.3390/systems13010032
12. Zeng M, Wu Y, Xing X, Tang W, Xu H. Coordinating principal–agent and incentive strategy of cold chain logistics service in fresh food supply chain. Plos one (2024) 19(10): e0306976, doi:10.1371/journal.pone.0306976
13. Ren D. Random evolution game model for supply chain knowledge sharing. Computer Digital Eng (2019) (12): 2946–52. doi:10.3969/j.issn.1672-9722.2019.12.002
14. Wang Y, Bao J. Evolutionary game analysis of knowledge sharing behavior in cluster supply chain. Res Technology Management (2019) 39(04):142–9. doi:10.3969/j.issn.1000-7695.2019.04.021
15. Li Y, Xu H, Zhao Y. Evolutionary game analysis of information sharing in fresh product supply chain. Discrete Dyn Nat Soc (2021) 1, 11. doi:10.1155/2021/6683728
16. Gu J Research on internal logistics information sharing of supply chain from the perspective of evolutionary game. Int Core J Eng (2020) 6(10), 1–9. doi:10.6919/ICJE.202010_6(10).0052
17. Xiao D, Chen Y, Wang J Choice of cost sharing strategy in E-commerce supply chain considering platform digital empowerment. Chin J Management Sci (2021) 29(10):58–69. doi:10.16381/j.cnki.issn1003-207x.2020.2175
18. Gurnani H, Erkoc M. Supply contracts in manufacturer-retailer interactions with manufacturer-quality and retailer effort-induced demand. Naval Res Logistics (Nrl) (2008) 55(3): 200–17. doi:10.1002/nav.20277
19. Liu Y, Wang Y, Ma X. Evolutionary game theory research on knowledge sharing in aviation manufacturing industry clusters. Chin J Syst Sci (2025) (03):147–54.
20. Zhong Q, Wang H. Research on knowledge interaction and evolution mechanism of cloud manufacturing platform considering collaborative tax supervision. Operations Res Management Sci (2023) 32(11):183–90. doi:10.12005/orms.2023.0370
21. He Z, Zhang Z, Yang X. Evolutionary game analysis of knowledge sharing incentive in cloud manufacturing innovation ecosystem. Chin J Management Sci (2022) 30(07):77–87. doi:10.16381/j.cnki.issn1003-207x.2020.1465
Keywords: logistics service supply chain, knowledge sharing, evolutionary game theory, digital transformation, simulation analysis
Citation: Zhao G, Zheng J and Zhan K (2025) Research on knowledge-sharing decisions in the logistics service supply chain. Front. Phys. 13:1659092. doi: 10.3389/fphy.2025.1659092
Received: 03 July 2025; Accepted: 13 August 2025;
Published: 29 August 2025.
Edited by:
Faik Bilgili, Erciyes University, TürkiyeReviewed by:
Shuai Deng, Hunan Institute of Technology, ChinaYang Yao, Beijing Jiaotong University, China
Copyright © 2025 Zhao, Zheng and Zhan. This is an open-access article distributed under the terms of the Creative Commons Attribution License (CC BY). The use, distribution or reproduction in other forums is permitted, provided the original author(s) and the copyright owner(s) are credited and that the original publication in this journal is cited, in accordance with accepted academic practice. No use, distribution or reproduction is permitted which does not comply with these terms.
*Correspondence: Guanbing Zhao, emhnYkB1anMuZWR1LmNu