 Ce Yang1Zongheng Chen1*
 Chen Chen2*
 Chunguang Li3Siqing Liu1Jianyu Huang1Yu Li1Laiyong Song1Hongbin Li1
- 1Guangzhou Marine Geological Survey, Guangzhou, China
- 2College of Instrumentation & Electrical Engineering, Key Laboratory of Geophysical Exploration Equipment, Ministry of Education of China, Jilin University, Changchun, China
- 3College of Biological & Agricultural Engineering, Jilin University, Changchun, China
In the context of global clean energy demand and climate change, the dynamic monitoring of methane is crucial for carbon cycle research and greenhouse gas assessment. In order to solve the problem of cavity mode noise limiting measurement performance in the off-axis integrated cavity output spectroscopy (OA-ICOS) system, an optimization method based on white noise injection was proposed. A broadband white noise perturbation is introduced into the distributed feedback (DFB) laser, and the Savitzky-Golay (S-G) filtering algorithm is used to further reduce the noise. It effectively suppresses the coherence of cavity mode noise, reduces the noise floor, and improves the signal-to-noise ratio and measurement sensitivity of the system. Experiments show that when white noise with a modulation depth of 30% is injected, the signal-to-noise ratio of the system is increased by about 3.16 times, and the methane measurement limit is optimized from 5.32 ppm to 2.22 ppm of the original system, which is about 2.4 times. The Allan deviation showed a significant increase in minimum detectable limit. Further verification by methane dynamic test shows that the system response time is about 1 min, showing reliable measurement stability. This study provides an innovative technical solution for high-precision methane measurement, which is of great significance for promoting in-situ greenhouse gas monitoring and climate model optimization.
1 Introduction
Methane (CH4) is the main component of natural gas [1, 2], and in the context of the surge in global demand for clean energy, methane has attracted attention because of its dual energy and environmental characteristics: as an efficient and clean fuel, it can alleviate energy shortages, but its greenhouse effect potential (GWP) reaches 28 times that of carbon dioxide [3], which has a multiplier impact on climate change. When methane is more than 4.9% in industry, it will explode in an open flame, which will cause casualties and huge economic losses, and real-time monitoring is crucial to ensure safe production, reduce resource waste, and fulfill carbon reduction responsibilities. The primary anthropogenic sources of methane emissions are energy activities and industrial production. Specifically, coal mining releases methane trapped in coal seams, while industrial processes such as fertilizer production, anaerobic decomposition of organic waste in landfills, and wastewater treatment in sewage plants also generate and emit methane. Laser spectroscopy has been used as a commonly used method for the measurement of methane gas [4–8]. The commonly used methods include photoacoustic spectroscopy [9–11] and absorption spectroscopy. Due to its outstanding advantages of high accuracy, high sensitivity, and high specificity, absorption spectroscopy plays a key role as a measurement method that does not require direct contact, such as atmospheric environment monitoring [12–14], food quality testing [15], and multiphase flow measurement [16, 17].
Off-axis integrating cavity spectroscopy (OA-ICOS) has great potential for high-precision in-situ measurements due to its high sensitivity and fast response time [18–22]. However, the main problem with OA-ICOS is cavity mode noise, which limits its measurement limit. There are several common methods to deal with cavity mode noise: Wang et al. [23] proposed that the injection of RF white noise can effectively suppress cavity mode noise. With the increase of white noise power, the amplitude of cavity mode noise decreases significantly. When the RF noise power reaches −10 dBm, the cavity mode noise almost completely disappears. Significantly improve the measurement sensitivity and signal-to-noise ratio of the system. Zheng et al. [24] proposed a novel dual-input, dual-output (DIDO) coupling scheme to suppress mode noise, by dividing the laser beam into two parts and coupling them into a cavity at the same time, the DIDO scheme can smooth the cavity mode structure and reduce the cavity mold linewidth, thereby suppressing the mode noise. Compared to the traditional single-input, single-output scheme, the DIDO scheme improves the signal-to-noise ratio by about 2.5 times and the measurement sensitivity by about 2.2 times. Wang et al. [25] proposed to use the exponential moving average (EMA) algorithm to filter the gas concentration data in real time, which effectively reduces the system noise. By adjusting the parameters of the EMA, such as the sample length N, a balance can be struck between filtering efficiency and response time, further optimizing the measurement accuracy. However, it is found that although the cavity mold noise after the injection of white noise is effectively suppressed, the presence of noise can still be clearly seen. The Savitzky-Golay (S-G) filtering algorithm is a very suitable and convenient way to deal with cavity mode noise, and has been widely used in the measurement of trace gases [26–28].
In our research, we built a methane gas concentration measurement system, added white noise to the OA-ICOS system, and combined with the S-G filtering algorithm, we proposed a method to improve the measurement accuracy and signal-to-noise ratio of trace gases. Compared with the measurement limit of the conventional system, the difference in the measured signal is clearly visible, the signal-to-noise ratio is increased by about 3.16 times, and the measurement limit is increased by about 2.4 times.
2 Sensor design
2.1 Sensor structure
An OA-ICOS experimental system was constructed as shown in Figure 1, and methane was selected as the sample gas. According to HITRAN, methane has a strong absorption line at 1.6537 μm, so a distributed feedback (DFB) laser with a central wavelength of 1.6537 μm is used as the laser source. To increase the effective optical path length, a collimator is mounted on the optical adjustment frame, and the optical resonator consists of two highly reflective mirrors (radius of curvature 25 cm, mirror diameter 24.3 mm, reflectivity 99%). The convex lens is used to focus the enhanced light beam into the detection amplifier (DT). Within the system, the detection amplifier (DT) converts the collected optical signal into an electrical signal for subsequent signal transmission. The cavity length of this system is 65.6 mm, and the theoretical effective optical path length of 10.1 m is obtained, and the chamber volume is 8.3 mL.
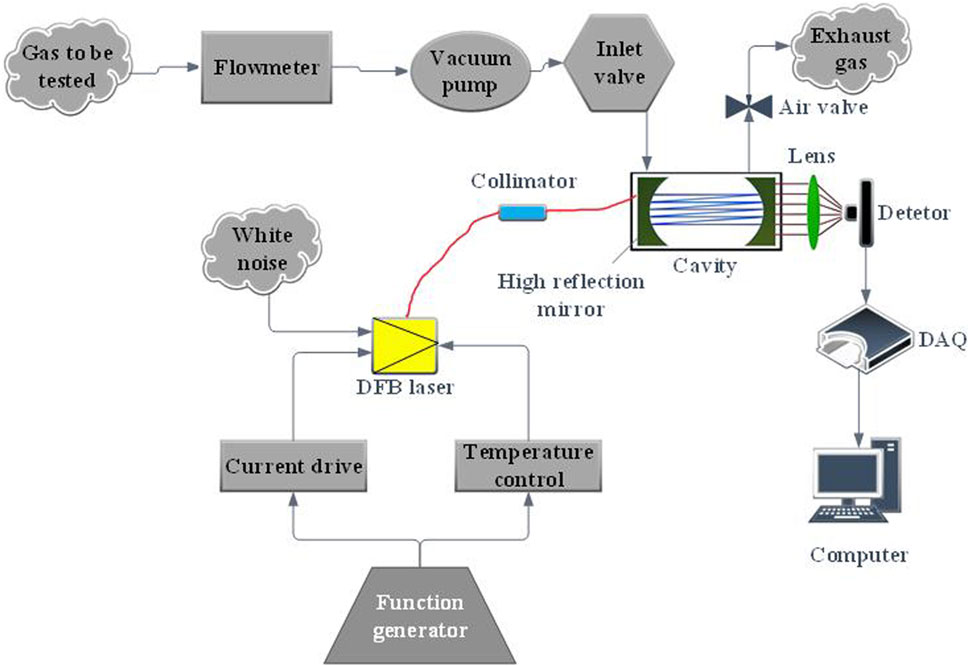
Figure 1. Structural diagram of a methane measurement system with direct absorption of an off-axis integral cavity.
In the driver module, the DFB laser is controlled by a laser temperature controller and a current driver to produce a light source in the corresponding wavelength band. White noise is injected into the DFB laser to perturbate the laser output of the light source, introducing additional light field fluctuations that result in a broadening of the laser spectrum so that the energy of the mode noise is redistributed over a wider spectrum. A data acquisition card (DAQ) is used to acquire an electrical signal that has been amplified after passing through a resonator and a probe amplifier. The digital signal in the acquired electrical signal is converted into an analog signal. Finally, the obtained analog signal is transmitted to the computer through the USB data transmission channel, and the data is received and processed through the computer.
In order to control the pressure in the chamber, a pressure sensor is installed for monitoring, and if the pressure is unstable, it is adjusted by means of a proportional valve. And a flow meter is used to control the methane gas flow. The last residual gas in the system is discharged through the gas valve. The system will be put into practical use after integration and is expected to be operational within 4 months.
2.2 Spectral line selection
In this study, a high-power distributed feedback (DFB) laser was used to construct a methane gas measurement system, and the core wavelength of 1.6537 μm was selected based on a rigorous molecular spectroscopy verification process. Through the search of HITRAN2020 database, it was found that methane had characteristic absorption lines in the near-infrared band of 1.6530–1.6540 μm, and its central wavelength was 1.6537 μm. It is worth noting that there is multiple absorption interference of water vapor at 1.6512 μm and 1.6545 μm in this spectral region.
In order to accurately evaluate the effect of cross-interference, the absorption spectrum of methane in the 1.6530–1.6540 μm band was simulated, and the simulated parameters were set strictly according to the typical environmental conditions: The mixed gas system is composed of 1,000 ppm methane, 10,000 ppm water vapor, and 10,000 ppm carbon dioxide, the temperature was controlled at 298 K, and the pressure was stabilized at 101 kPa. By simulating the absorption spectrum of methane in the 1.6530–1.6540 μm band, as shown in Figure 2, It can be observed that the influence of water vapor and carbon dioxide on the methane absorption spectrum at the 1.6537 μm wavelength band is very minor and can be neglected, so 1.6537 μm is selected as the central wavelength in this paper.
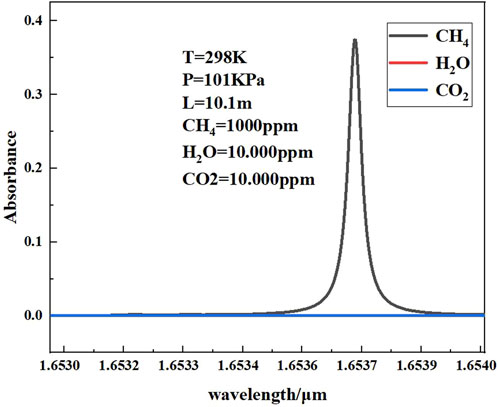
Figure 2. Absorption lines at 1.653–1.654 μm, 1,000 ppm methane and 10,000 ppm water vapor.
3 Basic measurement principle
3.1 Measurement principle
In a conventional cavity, when the laser light is incident along the axis of the optical cavity, the light rays form a stable standing wave resonance between the two highly reflective mirrors. This periodic reflection excites a specific cavity mode (resonance mode), producing sharp noise peaks that can significantly interfere with the gas absorption signal. The laser light of the OA-ICOS system is in climatically incident at a slight angle to the optical cavity. This design forces the light to be reflected non-coplanarly between the walls of the cavity, creating a disordered “spot maze.” Its core advantage is that the resonance conditions are destroyed, so that the light cannot form a stable standing wave, and the cavity mode noise is fundamentally suppressed. The optical path is extended, so that the reflection path causes the photon to undergo hundreds of reflections before escaping, effectively improving the optical path. And it can homogenize the energy distribution, so that the light field diffuses into a continuous background in the cavity, and the noise is converted into a flat substrate. When the laser light is delivered in an off-axis trajectory into an optical cavity constructed of a mirror with an extremely high reflectivity (up to 99.99%), the unique off-axis design cleverly prevents direct reflection of light in the direction of the optical axis. As a result, the laser is forced to undergo multiple reflection processes in the cavity, which generates a complex and dense interference pattern in the cavity space, and the off-axis structure can effectively inhibit the generation of high-order transverse modes. Because the excitation of higher-order transverse modes tends to introduce mode noise, its suppression means that the interference of mode noise is reduced. There is a strong correlation between the number of times light is reflected in the cavity (N) and the specular reflectance. It is because of this relationship that the effective optical path (Leff) of the optical cavity can be extended to an extremely considerable length under certain conditions, ranging from hundreds to thousands of meters. This significantly improves the light absorption efficiency of the sample. The significant increase in the effective optical path length further increases the measurement sensitivity for gas absorption. The absorption of light by the gas in the cavity follows Beer-Lambert’s law, which states that the intensity of light is attenuated by absorption after passing through the absorbing medium. Assuming that the initial light intensity is I0, after passing through the absorption medium with the length of the absorption path L and the gas concentration of C, the outgoing light intensity I is Equation 1:
Among them, α is the absorption coefficient of the gas, which is related to the type of gas, the wavelength of light, and other factors. The absorption coefficient α quantitatively describes the gas absorption capability, reflecting the strength of light absorption at specific wavelengths. A higher α value indicates stronger absorption of light at that wavelength by the gas, and vice versa. For instance, different gases exhibit distinct α values in the infrared band, which forms the fundamental basis for gas composition detection using infrared spectroscopy.
Calculation of the gas concentration in the off-axis integrating cavity: For a stable off-axis integrating cavity with a reflectivity of H and a geometric length of d, the volume fraction C of the gas in the integrating cavity can be expressed as Equation 2.
where P0 and T0 are the values in the standard state, NL = 2.6868*1019 molecule/cm3, T and P represent the temperature and pressure during the experiment, and A is the absorption area of the absorption spectrum measured by the experiment. S indicates the linear strength of methane, which is a fixed value in the database.
The effective optical path length is determined by the reflectance of the cavity mirror (H) and the length of the cavity (d), as shown in Equation 3:
When considering sample absorption, the total loss includes the mirror loss (1-H) and the absorption loss (αd), at which point the effective optical path is modified to Equation 4:
3.2 Joint optimization of white noise and S-G filtering algorithm
Existing noise injection methods include RF white noise modulation, RF Gaussian noise modulation, etc. However, these methods require additional dedicated hardware, which is complex and has a narrow range. In contrast, white noise perturbation is generated by broadband random noise from a signal generator, eliminating the need for specialized custom narrowband RF noise sources. This can reduce system complexity and cost. Moreover, white noise offers significant advantages over frequency modulation. For example, compared to sinusoidal wave modulation, white noise exhibits a flat power spectral density, uniformly perturbing the laser frequency across the entire frequency range while disrupting the coherence of all cavity mode frequencies. In contrast, sinusoidal wave jitter only introduces perturbations at a single frequency and its harmonics, leaving cavity mode noise in unperturbed frequency bands unaffected.
As a key factor affecting the performance of laser systems, the effective suppression of residual cavity mode noise has always been the focus of research. The principle of injecting white noise into a laser system to suppress residual cavity mode noise contains a rich physical mechanism. The evolution of the mode power Pm of white noise induced by multi-membrane oscillation through a nonlinear effect can be described by Equation 5.
Gm and Lm are the gain and loss of the m-th mode, respectively. Gmn is the coupling coefficient between the models; Rnoise is a random driver term introduced by white noise.
Under ideal conditions, the power spectral density is constant, and the white noise exhibits broadband random disturbances covering all frequencies. When white noise is injected, the phase ϕk(t) of the laser output will also undergo rapid random fluctuations, as described in Equation 6:
Here, δϕnoise(t) is a random process with zero mean. In the evolution of the interference noise term, the phase difference ϕmn(t) = ϕm(t)−ϕn(t) between modes m and n is perturbed by white noise, becoming a stochastic process, as shown in Equation 7:
The interference term cos(ϕmn(t)) then transforms into Equation 8:
Here, ϕ0mn(t) represents the unperturbed phase difference, while Δϕrand(t) denotes the random phase offset induced by white noise. The stochastic nature of white noise causes Δϕran(t) to be uniformly distributed in the time domain. The time-averaged interference noise term is given by Equation 9:
The physical representation can be expressed by Equation 10:
Thus, it can be concluded that the white noise drives the time-averaged interference noise term to zero, thereby suppressing the cavity mode noise.
However, after white noise optimization, there is still noise interference. Gas concentration retrieval relies on the characteristics of absorption spectra such as peak height, peak width, and area (e.g., the characteristic peak of methane at 1.6537 μm). Any filtering algorithm must preserve the original spectral shape to the greatest extent. As a local polynomial fitting algorithm, S-G can smooth noise while precisely maintaining the first derivative (slope) and second derivative of spectral lines. However, threshold processing in wavelet denoising may flatten weak absorption peaks (e.g., in low concentration scenarios ppm), and improper selection of basis functions may lead to false peaks. Kalman filtering requires preset state equations, and the coupling model of laser noise and gas absorption is difficult to model accurately, so the S-G filter algorithm is further used to reduce the noise. The S-G algorithm can effectively suppress noise, and is efficient and concise [29, 30], and can well retain the characteristics and shape of the original spectrum, and its working principle [31, 32].
The S-G filter has two parameters, which are the polynomial order k and the window size b. According to the residual minimization criterion, the selected S-G filter parameters are: k = 3 (cubic polynomial), b = 21 (window width). We chose k = 3 because a third-order polynomial can accurately fit the curvature characteristics of the methane absorption peak (with a peak width of approximately 0.1 nm), and also resist high-frequency noise. Based on the analysis of the noise power spectrum, the main frequency of the noise near the methane absorption peak is 40–60 Hz (sampling rate 1 kHz). The window width b = 21 corresponds to 21 ms in the time domain, which can cover 2 to 3 noise cycles and achieve optimal suppression. The mathematical formula of the S-G filter is as shown in Equation 11:
K is the order of the polynomial; n is the coefficient of the polynomial; m is the half-width of the smooth window, the width of the smooth window b = 2m + 1, and the S–G algorithm uses the least-squares criterion to obtain the coefficient an as shown in Equation 12:
s(i) is the original signal, Equation 12 gives k + 1 simultaneous equation for calculating the unknown coefficient an, Equation 12 gives a0 when i = 0, and also a1a2…an, so Equation 13 is derived:
4 Analysis & results
4.1 Effect of white noise on absorption spectra
By mixing methane gas with pure nitrogen to prepare 1,000 ppm methane gas, a noise intervention scheme was adopted to set up six different modulation depths of white noise (0%/10%/20%/30%/40%/50%) to disturb the OA-ICOS system, and Figure 3 shows the direct absorption spectrum of 1,000 ppm methane (0% (black)/10% (red)/20% (blue)/30% (green)/40% (violet)/50% (brown)) under six modulation depths of white noise.

Figure 3. Direct absorption spectra of 1,000 ppm methane at different wattages of white noise (0% (black)/10% (red)/20% (blue)/30% (green), 40% (purple), 50% (brown).
It was found that the intensity of the methane absorption spectrum with white noise was not much different from the original absorption spectrum intensity, and the absorbance of the absorption spectrum was 0.3913, 0.3881, 0.3765, 0.3779, 0.3821 and 0.3805 under different white noise disturbances, respectively. It can be seen that the effect of white noise on absorbance is negligible, which further indicates the advantage of adding white noise perturbation. The system noise levels corresponding to the white noise at different modulation depths are 0.09879 V, 0.05231, 0.04370, 0.03454, 0.02991, and 0.02547, respectively. Based on these noise levels, the signal-to-noise ratios (SNRs) are calculated to be 3.899, 7.471, 8.673, 11.01, 12.87, and 13.03, respectively. Experiments show that the signal-to-noise ratio of the original system is improved by 2.82 times compared with the white noise at a modulation depth of 30%. Finally, we selected 30% of the white noise with a modulation depth as the disturbance noise for subsequent system optimization. We refer to the system with white noise added as WNP-OA-ICOS.
4.2 Further noise reduction by Savitzky-Golay
It can be clearly observed that there is still a certain amount of noise interference in the 1,000 ppm methane direct absorption spectrum after 30% modulation depth. Therefore, the S-G filtering algorithm is further used to reduce the noise, and the absorption spectrum curve after noise reduction is shown in Figure 4.
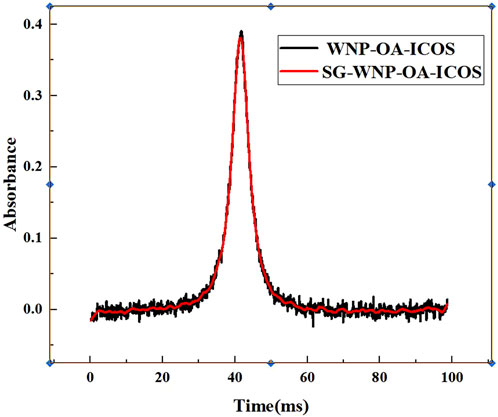
Figure 4. 1000 ppm methane direct absorption spectra at 30% modulation depth (black (not S-G filtered)/red (after S-G filtering)).
By comparing the red curve with the black curve in Figure 4, it can be observed that the interference of direct absorption spectral noise after applying S-G filtering is further improved, and it also confirms the advantages of S-G filtering method in dealing with noise. In the following, we will refer to the system in which white noise and S-G filtering are added at the same time as SG-WNP-OA-ICOS. The noise level of the 30% white noise system with no S-G filtering is 0.03454 V(1σ), and the noise level is 0.03134 V(1σ) after S-G filtering. The signal-to-noise ratio (SNR) was calculated to be 11.01 and 12.31, respectively, which was about 3.16 times higher than that of the original OA-ICOS system.
4.3 CH4 calibration and lower limit
4.3.1 CH4 calibration
In this section, machine learning is employed for methane concentration prediction, a method that has been widely applied to various gas concentration predictions [33–35]. In this experiment, a modularly designed gas detection chamber was used to mix methane with nitrogen to prepare five CH4 gases with concentrations ranging from 900 ppm to 1,400 ppm under the conditions of strict temperature control (298 ± 0.1 K) and stable pressure (101 ± 0.05 kPa), and the dynamic test of these five concentrations of methane gas was carried out for 2 h. Among them, the experimental group used a real-time white noise injection device combined with S-G filtering, the control group maintained the original detection state, and the two groups collected data separately. The absorbed signal intensity was measured in the original state and under the condition of white noise with 30% modulation depth applied and combined with S-G filtering. After the experimental data were analyzed by quadratic polynomial modeling, the concentration-absorption peak (Ada) correlation curve as shown in Figure 5 was obtained, and the mathematical relationship was quantitatively described by Equation 14. Comparing the goodness of fit of the two systems, the curve fitting degree of the original system (black color curve) was 0.99897, A system with white noise optimization applied in combination with S-G filtering (red color curve) was increased to 0.99949. It is confirmed that the method of introducing specific power white noise combined with S-G filtering can effectively improve the fitting quality of the sensor response curve.
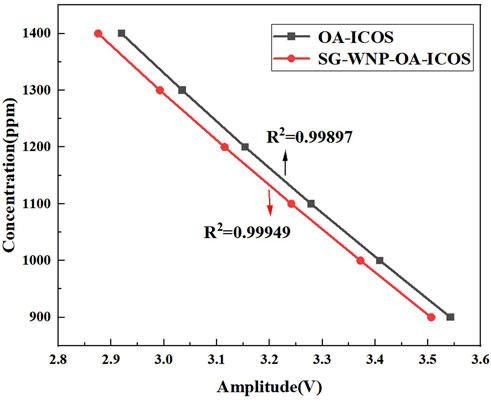
Figure 5. Fitting curves of CH4 concentration and direct absorption peak (Ada) under the original, SG-WNP-OA-ICOS system.
A quadratic polynomial is a linear representation of two sets of data fitted:
Comparing the goodness of fit of the two systems, the curve fitting degree of the original system (black color curve) was 0.99897, while the white noise optimization system (red color curve) was increased to 0.99949. It is confirmed that the enhancement method of introducing specific power white noise can effectively improve the fitting quality of the sensor response curve.
4.3.2 Determine the measurement limit and system stability
This system is specifically designed for dedicated gas leakage detection applications. The experiment employs a modularly designed gas detection chamber operating under strictly controlled temperature (298 ± 0.1 K) and pressure (101 ± 0.05 kPa) conditions. To better approximate actual measurement scenarios, a 1,000 ppm methane standard gas was prepared by mixing nitrogen and oxygen in a 7:2 volume ratio for subsequent experimental use. A continuous monitoring experiment was carried out on a 1,000 ppm methane gas sample using the system. During the 1 h observation period, the system performed data acquisition at a frequency of concentration analysis after every five sampling cycles.
The Allan deviation parameters of OA-ICOS system and SG-WNP-OA-IOS system were calculated respectively. Figure 6B illustrates the evolution of the Allan deviation curve. The experimental data show that when the integration time reaches 112 s, the SG-WNP-OA-IOS system achieves the minimum measurement limit of 2.22 ppm, which is about 2.4 times higher than that of the ordinary OA-ICOS system (measurement limit of 5.32 ppm).
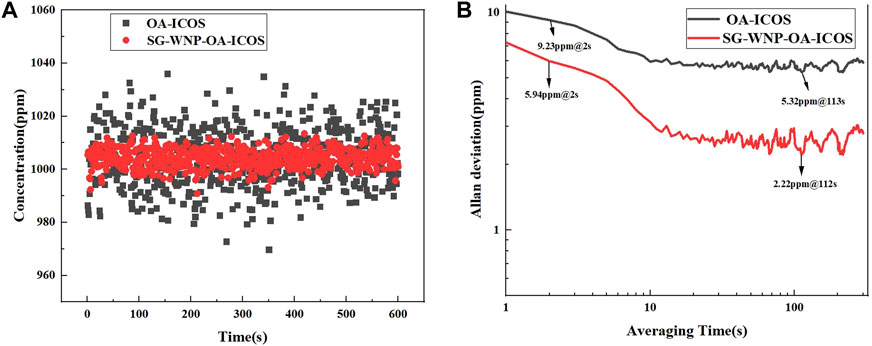
Figure 6. (A) Raw concentrations acquired by the original sensing system under the SG-WNP-OA-ICOS system with a primitive, modulation depth of 30% (black)/30% (red)); (B) The original Allan bias (blue)/30% (red)) in the SG-WNP-OA-ICOS system with a modulation depth of 30%.
The in-depth analysis shows that the introduction of white noise optimizes the system performance through the following mechanisms: firstly, the broadband noise energy effectively suppresses the low-frequency 1/f noise component of the sensor; Secondly, the stochastic perturbation breaks the original periodic error correlation of the system, and changes the noise substrate from a correlated type to an uncorrelated distribution.
In this experiment, we collected the concentration data of the sensing system in the original state and the SG-WNP-OA-ICOS system, respectively. In order to visualize the measurement results more visually, we plot them as Figure 6A. It is clear from the graph that the concentration data measured by the original sensing system (corresponding to the black curve in the graph) fluctuates throughout the measurement process. After careful analysis, it was found that the concentration fluctuation range was always in the range of less than ±40 ppmv. In stark contrast, the SG-WNP-OA-ICOS system (which corresponds to the curve in another red color in the figure) has a significantly lower fluctuation in the concentration data. Further indepth analysis shows that the concentration fluctuation range of the system with 30% modulation depth is greatly reduced to ±10 ppmV.
Through this remarkable comparison, we can clearly conclude that the stability of the sensing system when measuring concentration data is significantly improved by adding white noise with a modulation depth of 30%, and the addition of white noise plays a positive and critical role in improving the performance of the sensing system.
4.4 Methane concentration measurement experiments
To evaluate the performance of the SG-WNP-OA-ICOS system in measuring methane gas concentration in this study, we precisely simulated the actual environment during gas leakage and employed a scientific and rigorous experimental approach. A 600 ppm methane standard gas was prepared by mixing nitrogen and oxygen in a 7:2 volume ratio for subsequent experimental use. Subsequently, we carried out detailed measurements of methane gas using the designed SG-WNP-OA-ICOS system. The measurement process covers a total of 4 complete cycles, aiming to obtain comprehensive and accurate data on the performance of the sensor over different time periods. In order to visualize the measurement results more intuitively, we organized the data of the four cycles of the sensor measurement sample and plotted it into a Figure 7. The system starts to rise from 0.14 min, ends at 0.35 min, continues to rise for 0.21 min in the middle, starts to decline from 0.56 min, and ends at 0.76 min for 0.2 min, with an average response time of about 1 min. This data shows that the sensor is able to re-act to changes in the concentration of methane gas in a short period of time and maintains good stability over the entire measurement cycle, with little fluctuation in the measurement results.
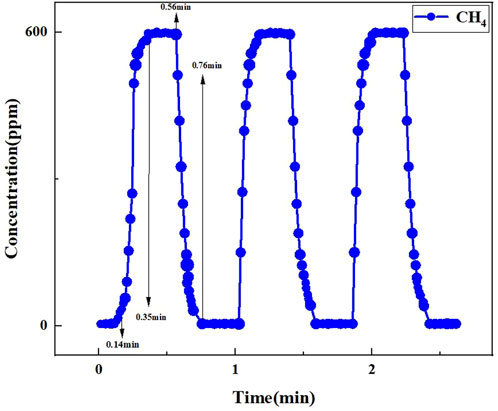
Figure 7. The sensor measures the results of 4 cycles of the sample.
In summary, through this experiment and the analysis of the measurement results, it is fully proved that the sensor has certain advantages in measuring methane, and its key performance indicators such as average response time and stability have reached a relatively ideal level.
4.5 Long-term measurement stability
To comprehensively evaluate the long-term measurement stability of the sensor, a 4-h sampling of CH4 gas at a concentration of 1,000 ppm was conducted with a 1-s sampling interval. The data was averaged every 10 s as shown in Figure 8, The concentration data were collected by the sensor in OA-ICOS mode (black) and SG-WNP-OA-ICOS mode (red), respectively. The results demonstrate that the SG-WNP-OA-ICOS mode exhibits greater stability compared to the OA-ICOS mode. The maximum measurement errors for the SG-WNP-OA-ICOS and OA-ICOS modes were 20 ppm and 40 ppm, respectively. The measured concentration varied over pro-longed sensor operation, likely due to the gradual increase in system temperature.
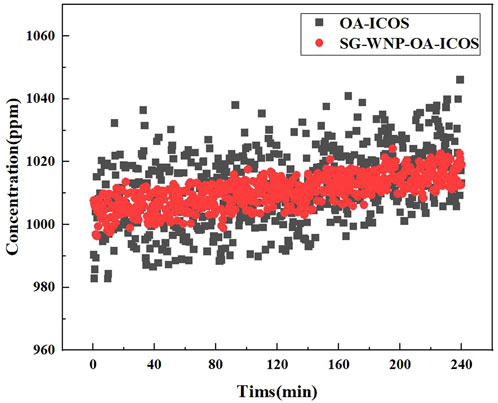
Figure 8. The concentration data was collected by the sensor in OA-ICOS mode (black) and SG-WNP-OA-ICOS mode (red).
According to the statistical calculation, the standard deviation of the OA-ICOS system is σ = 11.47334, and the standard deviation of the SG-WNP-OA-ICOS system is σ = 5.091592, and the SG-WNP-OA-IOS system still has good stability under long-term operation.
5 Conclusion
In this study, we propose a noise reduction method for OA-ICOS system based on white noise injection, which effectively suppresses cavity-mode noise by applying a 30% modulation depth broadband white noise disturbance to the DFB laser and combining with the S-G filtering algorithm. The experimental results show that the signal-to-noise ratio of the system is increased by 3.16 times, the methane measurement limit is optimized from 5.32 ppm to 2.22 ppm, the fluctuation range is reduced from ±40 ppm to ±10 ppm, and the dynamic test response time is about 1 min. At the same time, the SG-WNP-OA-IOS system also exhibits excellent stability during long-term measurements. This technology provides an innovative solution for high-precision dissolved methane measurement and greenhouse gas monitoring.
However, the system still has limitations. Primarily, the filtering algorithm could be further improved by integrating artificial intelligence and deep learning for enhanced innovation. In addition, the operational capability of the equipment under extreme working conditions is also of great importance. We will conduct further research on the above issues in the future. For instance, when facing external temperature and pressure variations, the system can be expanded by incorporating temperature-control and pressure-control modules to ensure measurement stability. Additionally, filtration devices can be integrated to filter dust particles, thereby enhancing anti-interference capabilities.
Data availability statement
The original contributions presented in the study are included in the article/supplementary material, further inquiries can be directed to the corresponding authors.
Author contributions
CY: Writing – review and editing. ZC: Writing – review and editing. CC: Writing – review and editing. CL: Software, Writing – original draft. SL: Validation, Writing – original draft. JH: Validation, Writing – original draft. YL: Formal Analysis, Writing – original draft. LS: Investigation, Writing – original draft. HL: Formal Analysis, Writing – original draft.
Funding
The author(s) declare that financial support was received for the research and/or publication of this article. This work was supported in part by the National Key R&D Program of China under (Grant No. 2024YFC2814300), in part by the Industrial Technology Research and Development Project of Jilin Provincial Development and Reform Commission under Grant 2024C007-5.
Conflict of interest
The authors declare that the research was conducted in the absence of any commercial or financial relationships that could be construed as a potential conflict of interest.
Generative AI statement
The author(s) declare that no Generative AI was used in the creation of this manuscript.
Any alternative text (alt text) provided alongside figures in this article has been generated by Frontiers with the support of artificial intelligence and reasonable efforts have been made to ensure accuracy, including review by the authors wherever possible. If you identify any issues, please contact us.
Publisher’s note
All claims expressed in this article are solely those of the authors and do not necessarily represent those of their affiliated organizations, or those of the publisher, the editors and the reviewers. Any product that may be evaluated in this article, or claim that may be made by its manufacturer, is not guaranteed or endorsed by the publisher.
References
1. M E, Kluyver TD, Wright N, Omosalewa O, Macreadie PI. Including methane emissions from agricultural ponds in national greenhouse gas inventories. Environ Sci Technol (2024) 58:8349–59. doi:10.1021/acs.est.3c08898
2. Bloj M-D, George Ripeanu R, Diniță A, Ovidiu Oprea V, Tănase M. Comprehensive review of hydrogen-natural gas blending: global project insights with a focus on implementation and impact in Romanian gas networks. Heliyon (2025) 11(6):e43090. doi:10.1016/j.heliyon.2025.e43090
3. Danny Harvey LD. A guide to global warming potentials (GWPs). Energy Policy (1993) 21(1):24–34. doi:10.1016/0301-4215(93)90205-t
4. Hu L, Zheng C, Zhang M, Zheng K, Zheng J, Song Z, et al. Long-distance in-situ methane detection using near-infrared light-induced thermo-elastic spectroscopy. Photoacoustics (2021) 21:100230. doi:10.1016/j.pacs.2020.100230
5. Liu J, Qiulin T, Zhang W, Chenyang X, Guo T, Xiong J. Miniature low-power IR monitor for methane measurement. Measurement (2011) 44(5):823–31. doi:10.1016/j.measurement.2011.01.021
6. Luo DF, Yang JH, Zhong CG. Measurement technology of methane gas concentration based on infrared absorption spectrum. Guang Pu Xue Yu Guang Pu Fen Xi. (2011) 31(2):384–386. doi:10.3964/j.issn.1000-0593(2011)02-0384-03
7. Werle P. A review of recent advances in semiconductor laser based gas monitors. Spectrochimica Acta A: Mol Biomol Spectrosc (1998) 54(2):197–236. doi:10.1016/s1386-1425(97)00227-8
8. Liu Y, Gu M, Yang C, Pan N, Liu K, Wang G, et al. High-precision in situ sensor for methane isotope (δ13C) measurement based on the near-infrared off-axis integrated cavity output spectroscopy. Measurement (2025) 244:116561. doi:10.1016/j.measurement.2024.116561
9. De Palo R, Ardito N, Zifarelli A, Sampaolo A, Giglio M, Patimisco P, et al. Greenhouse gases detection exploiting a multi-wavelength interband Cascade laser source in a quartz-enhanced photoacoustic sensor. Sensors (2025) 25:2442. doi:10.3390/s25082442
10. Strahl T, Steinebrunner J, Weber C, Wöllenstein J, Schmitt K. Photoacoustic methane detection inside a MEMS microphone. Photoacoustics (2023) 29:100428. doi:10.1016/j.pacs.2022.100428
11. Zhang H, Wang Z, Wang Q, Borri S, Galli I, Sampaolo A, et al. Parts-per-billion-level detection of hydrogen sulfide based on doubly resonant photoacoustic spectroscopy with line-locking. Photoacoustics (2023) 29:100436. doi:10.1016/j.pacs.2022.100436
12. Wu H, Dong L, Yin X, Sampaolo A, Patimisco P, Ma W, et al. Atmospheric CH4 measurement near a landfill using an ICL-Based QEPAS sensor with V-T relaxation self-calibration. Sensors Actuators B: Chem (2019) 297:126753. doi:10.1016/j.snb.2019.126753
13. Shen X, Zhang Y, Cui R, Tian D, Cheng M, Patimisco P, et al. A sulfur dioxide detection platform based on photoacoustic spectroscopy and a 266.22 nm high-power stabilized LD-pumped solid-state Q-switched laser. Photoacoustics (2025) 42:100702. doi:10.1016/j.pacs.2025.100702
14. Sander G, Essen M., Visser P, Ahmad M, Mokhov A, Sepman A, et al. Measurement of H2S, SO2 and NO2 in CO2 at pressures ranging from 1- 40bar by using broadband absorption spectroscopy in the UV/VIS range. Energ Proced (2014) 63:2570–82. doi:10.1016/j.egypro.2014.11.279
15. Xu H, Zhang Y, Ren X, Jin Z, Zhang J, Yang Y, et al. A novel fluorescent probe utilizing Michael addition for the rapid detection of sulfur dioxide derivatives in food. Spectrochimica Acta Part A: Mol Biomol Spectrosc (2025) 334:125946. doi:10.1016/j.saa.2025.125946
16. Huang W, Sun H, Zhao C, Wang K, Yang J, Fang Y, et al. Investigation into ethanol film thicknesses in the evaporation, injection, and flow processes by an online measurement system based on absorption spectroscopy. Measurement (2024) 238:115285. doi:10.1016/j.measurement.2024.115285
17. Huang W, Sun H, Liu Z, Wang K, Su M, Yang H. Investigation into injection and falling film flow processes of diesel. Measurement (2023) 218:113120. doi:10.1016/j.measurement.2023.113120
18. Sun K, Wang SK, Sur R, Chao X, Jeffries JB, Hanson RK. Time-resolved in situ detection of CO in a shock tube using cavity-enhanced absorption spectroscopy with a quantum-cascade laser near 46µm. Opt Express (2014) 22:24559–65. doi:10.1364/oe.22.024559
19. Shen G, Chao X, Sun K. Modeling the optical field in off-axis integrated-cavity-output spectroscopy using the decentered Gaussian beam model. Appl Opt (2018) 57:2947. doi:10.1364/ao.57.002947
20. Chao X, Shen G, Sun K, Wang Z, Meng Q, Wang S, et al. Cavity-enhanced absorption spectroscopy for shocktubes: design and optimization. Proc Combust Inst (2019) 37:1345–53. doi:10.1016/j.proci.2018.06.230
21. Li G, Zhao Y, Liu Y, Li L, Zhang S, Dong E, et al. Near-infrared real-time trace NH3 sensor based on WM-OA-ICOS and EEMD assisted optical denoising. Measurement (2025) 245:116658. doi:10.1016/j.measurement.2025.116658
22. Yuan Z, Huang Y, Zhao Q, Zhang L, Lu X, Huang J, et al. Dual-path coupling V-shaped structure off-axis integrated cavity output spectroscopy (V-OA-ICOS) for water vapor stable isotope detection at 3.66 μm. Sensors Actuators B: Chem (2024) 410:135676. doi:10.1016/j.snb.2024.135676
23. Wang JJ, Tian X, Dong Y, Zhu G, Chen J, Tan T, et al. Enhancing off-axis integrated cavity output spectroscopy (OA-ICOS) with radio frequency white noise for gas sensing. Opt Express (2019) 27:30517–29. doi:10.1364/oe.27.030517
24. Zheng K, Zheng C, Li J, Ma N, Liu Z, Zhang Y, et al. Near-infrared methane sensor system using off-axis integrated cavity output spectroscopy with novel dual-input dual-output coupling scheme for mode noise suppression. Sensors Actuators B: Chem (2020) 308:127674. doi:10.1016/j.snb.2020.127674
25. Wang K, Ligang S, Jiajin C, Guishi W, Kun L, Tan T, et al. A dual-laser sensor based on off-axis integrated cavity output spectroscopy and time-division multiplexing method. Sensors.SCI (2020) 21:6192. doi:10.3390/s20216192
26. Zhang J, Mouazen AM. A novel non-integer order Savitzky–Golay derivative function of visible and near-infrared spectra for improving prediction accuracy of phosphorus in pig manure. Chemometrics Intell Lab Syst (2023) 240:104917. doi:10.1016/j.chemolab.2023.104917
27. Su X, Zhang Y, Zhang Y, Liu J, Xu M, Jia P. An enhanced multilayer Res-Informer with Savitzky-Golay filter for predicting mixed CO and NOx emissions in gas turbines. Chemometrics Intell Lab Syst (2025) 2025:105379. doi:10.1016/j.chemolab.2025.105379
28. Liu X, Qiao S, Ma Y. Highly sensitive methane detection based on light-induced thermoelastic spectroscopy with a 2.33 µm diode laser and adaptive Savitzky-Golay filtering. Opt Express (2022) 30:1304–13. doi:10.1364/oe.446294
29. Liu J, Li T, Tang Q, Wang Y, Su Y, Gou J, et al. The life prediction of PEMFC based on group method of data handling with Savitzky–Golay smoothing. Energ Rep (2022) 8(Suppl. 16):565–73. doi:10.1016/j.egyr.2022.10.256
30. Wen S, Zhang W, Sun Y, Li Z, Huang B, Bian S, et al. An enhanced principal component analysis method with Savitzky–Golay filter and clustering algorithm for sensor fault detection and diagnosis. Appl Energ (2023) 337:120862. doi:10.1016/j.apenergy.2023.120862
31. Ji J, Huang Y, Pi M, Zhao H, Peng Z, Li C, et al. Performance improvement of on-chip mid-infrared waveguide methane sensor using wavelet denoising and Savitzky-Golay filtering. Infrared Phys Technol (2022) 127:104469. doi:10.1016/j.infrared.2022.104469
32. Zhang G, He H, Wang Y, Jiang Y, Shi J, Yu J, et al. Optimized adaptive Savitzky-Golay filtering algorithm based on deep learning network for absorption spectroscopy. Spectrochimica Acta Part A: Mol Biomol Spectrosc (2021) 263:120187. doi:10.1016/j.saa.2021.120187
33. Musiałek F, Wojtas J. Calibration-free, machine learning based wavelength modulation spectroscopy sensor for fast gas concentration measurements. Eng Appl Artif Intelligence (2025) 155:111026. doi:10.1016/j.engappai.2025.111026
34. Liu S, Xue J, Liang X, Qiu J, Yang H, Xu R, et al. Machine learning-driven gas concentration forecasting: a case study with WS2 nanoflower gas sensor. Mater Sci Eng B (2024) 307:117455. doi:10.1016/j.mseb.2024.117455
Keywords: methane measurement, OA-ICOS, white noise perturbation, Savitzky-Golay filtering, enhancing measurement limit, cavity mode noise
Citation: Yang C, Chen Z, Chen C, Li C, Liu S, Huang J, Li Y, Song L and Li H (2025) Enhancing methane detection limit of OA-ICOS: a combined approach of white noise perturbation and Savitzky-Golay filtering. Front. Phys. 13:1666117. doi: 10.3389/fphy.2025.1666117
Received: 15 July 2025; Accepted: 04 September 2025;
Published: 18 September 2025.
Edited by:
Karol Krzempek, Wrocław University of Science and Technology, PolandReviewed by:
Huadan Zheng, Jinan University, ChinaGang Cheng, Anhui University of Science and Technology, China
Copyright © 2025 Yang, Chen, Chen, Li, Liu, Huang, Li, Song and Li. This is an open-access article distributed under the terms of the Creative Commons Attribution License (CC BY). The use, distribution or reproduction in other forums is permitted, provided the original author(s) and the copyright owner(s) are credited and that the original publication in this journal is cited, in accordance with accepted academic practice. No use, distribution or reproduction is permitted which does not comply with these terms.
*Correspondence: Zongheng Chen, Y3pvbmdoZW5nQG1haWwuY2dzLmdvdi5jbg==; Chen Chen, Y2NoZW5Aamx1LmVkdS5jbg==