- 1School of Artificial Intelligence, China University of Mining and Technology-Beijing, Beijing, China
- 2School of Electronics, Peking University, Beijing, China
The Global Navigation Satellite System (GNSS) is generally combined with the Inertial Navigation System (INS) to deliver reliable and high-performance navigation, particularly in scenarios where GNSS signals may be compromised. This integration leverages the inherent strengths of both systems to ensure continuous and accurate positioning. To enhance the robustness and accuracy of navigation systems in challenging environments, this paper proposes a novel hybrid integration (HI) approach for GNSS/INS fusion. The system incorporates a Multiple State Inspection of GNSS Observations (MSI-GO) mechanism, which dynamically selects the optimal integration mode based on the number of visible satellites (NoS) and position dilution of precision (PDoP), thereby achieving a balance between positioning performance and computational efficiency. Simulation results using an open dataset demonstrate that, compared to traditional loosely coupled (LC) and tightly coupled (TC) methods, the HI scheme improves positioning accuracy by approximately
1 Introduction
To achieve globally available, accurate, and dependable navigation services, integration of the Global Navigation Satellite System (GNSS) [1] and the Inertial Navigation System (INS) is essential [2]. Together, they ensure seamless coverage with enhanced positioning performance [3, 4]. The INS is capable of continuously delivering information on a vehicle’s position, velocity, and orientation, thereby effectively supporting and improving the accuracy of GPS-based navigation and positioning [5]. When GNSS signals become weak or unavailable, the integrated GNSS/INS system can rely on INS-derived position data to maintain continuous navigation support [6, 7]. Moreover, the high-precision positioning output from GPS can be used to update the INS through filtering techniques, effectively mitigating the accumulated drift in INS navigation parameters and enhancing the overall accuracy of the system [8, 9]. Therefore, the strengths and weaknesses of GNSS and INS effectively offset each other, making their integration one of the most efficient and reliable approaches to achieve robust navigation [10, 11].
Based on the degree of data integration and fusion complexity, GNSS/INS coupled navigation systems can be classified into loosely coupled (LC), tightly coupled (TC), and deeply coupled (DC) types [12–14]. Developing a deeply coupled GNSS/INS system requires utilizing specific variables from the GNSS receiver’s signal tracking loop, which differentiates it from LC/TC GNSS/INS systems [15, 16]. Since the GPS receiver typically provides the user’s position, velocity, and associated mean square error estimates, LC integration can be achieved when the outputs from the GNSS receiver and the INS subsystem are synchronized and match in value [17]. This makes it feasible for virtually anyone to implement GNSS/INS integration. Furthermore, if the receiver offers detailed GPS observations along with their associated mean square errors, the essential requirements for TC GNSS/INS integration are fulfilled [18, 19]. Given their low implementation complexity and strong robustness, research on LC/TC GNSS/INS systems remains highly valuable and relevant in practical applications [20–23]. Currently, the research directions can be classified into four categories: (1) Data Processing Software and Algorithms; (2) Navigation Algorithm; (3) Performance Evaluation and Optimization; (4) Fusion with Other Sensors.
(1) Data Processing Software and Algorithms: fundamental research [15]. Places strong emphasis on the precision and dependability of the software’s performance, recognizing them as essential for achieving consistent and trustworthy results. Additionally, the article rigorously tests the software under diverse operational conditions–including dynamic, obstructed, and GNSS-denied environments–and benchmarks its performance against comparable systems, highlighting its competitive advantages in accuracy, stability, and resilience [24]. Introduces GINav, a MATLAB-based software specifically developed for processing and analyzing data from GNSS/INS integrated navigation systems. The software supports a range of functions, including data visualization and error analysis, making it a valuable resource for research and practical implementation. These efforts underscore the crucial role of GNSS/INS data processing platforms in diverse application fields and demonstrate how targeted software development and validation can significantly enhance navigational accuracy and system reliability. (2) Navigation Algorithm: traditional research [25]. Proposes an algorithm to further low-end GNSS/INS systems used for land vehicle navigation [26]. Introduces using of “signals of opportunity” to enhance the performance of an INS [27]. Explores the application of a cubature Kalman filter with enhanced adaptability and robustness in TC GNSS/INS systems. (3) Performance Evaluation and Optimization: engineering research [28]. Suggests employing Allan variance to assess the relative accuracy of GNSS/INS on different time scales [29]. Also evaluates the performance of TC GPS/BDS/INS integration based on carrier phase measurements under GNSS-degraded and GNSS-denied conditions [30]. Assesses the accuracy and reliability of LC/TC GNSS/INS systems in practical urban environments [31]. Suggests a multi-receiver strategy to improve the performance of TC GNSS/MEMS-IMU systems. Moreover [32], Investigates how adaptive and fading factors influence the performance of filtering algorithms in GNSS/INS systems, and [33] proposes a low-cost GNSS/INS combination method for developed land vehicle performance [34]. Proposes a robust vehicular navigation solution by integrating multi-antenna GNSS with inertial sensors/odometer measurements [35]. Presents a motion-constrained GNSS/INS integration approach utilizing a backpropagation (BP) neural network for enhanced navigation accuracy. Collectively, these investigations promote the progressive optimization of GNSS/INS fusion strategies, emphasizing higher accuracy, improved system resilience, and broader environmental adaptability. (4) Fusion with Other Sensors: frontier research [36]. Improves GNSS/INS navigation performance in harsh environments through the application of adaptive information fusion techniques [37]. Introduces a real-time kinematic (RTK) solution supported by an inertial navigation algorithm tailored for smartphone-based pedestrian tracking, which significantly enhances positioning accuracy in challenging urban environments [27]. Introduces a novel fuzzy strong tracking cubature Kalman filter (KF) tailored for GNSS/INS integration, demonstrating superior navigation accuracy and robustness compared to conventional algorithms [38]. Proposes a MEMS-IMU-based autonomous navigation algorithm designed to enhance the positioning accuracy of UAV platforms. Navigation accuracy and robustness under various flight scenarios have been successfully verified. Additionally, studies by other researchers demonstrate that integrating an RTK receiver into GNSS/INS systems improves positioning precision in both railway measurement [39] and hydrographic survey [40] tasks, with analyses revealing performance gains and influencing parameters. A novel selective integration framework using weighted DOP is proposed by [41] to combine GNSS, visual sensing, and inertial measurements for robust navigation in GNSS-denied or degraded environments. Collectively, this body of work contributes valuable knowledge and innovative solutions to bolster the performance and robustness of GNSS/INS integration in land and air vehicles, which is essential for the development of autonomous vehicles and unmanned systems.
Based on the literature review, achieving both high accuracy and low computational complexity is critical for real-time positioning applications Tang et al. [42]; Li et al. [43]; Tang et al. [44]. Tightly Coupled (TC) GNSS/INS systems provide superior positional accuracy compared to Loosely Coupled (LC) GNSS/INS, especially in environments where GNSS signals are degraded. However, LC GNSS/INS systems are simpler to implement and deliver reliable positioning results when GNSS signals are strong, making them advantageous in such conditions. Given this existing gap, it is both necessary and timely to develop a novel method that reduces computational demands without compromising accuracy [45]. To address this, we propose the HI GNSS/INS system, which integrates the strengths of both LC and TC modes and employs Multiple State Inspection of GNSS Observations (MSI-GO) for data processing. Our approach effectively lowers computational complexity while ensuring the required positioning accuracy.
2 Fundamental theory
An overview of the commonly used LC and TC GNSS/INS integration architectures is presented in this section [17]. Conventional GNSS/INS integration commonly relies on the Kalman Filter [46, 47]. This section aims to provide readers with a comprehensive and clear explanation of the mathematical principles and architectural designs behind LC and TC methods.
2.1 GNSS/INS basic mechanisation
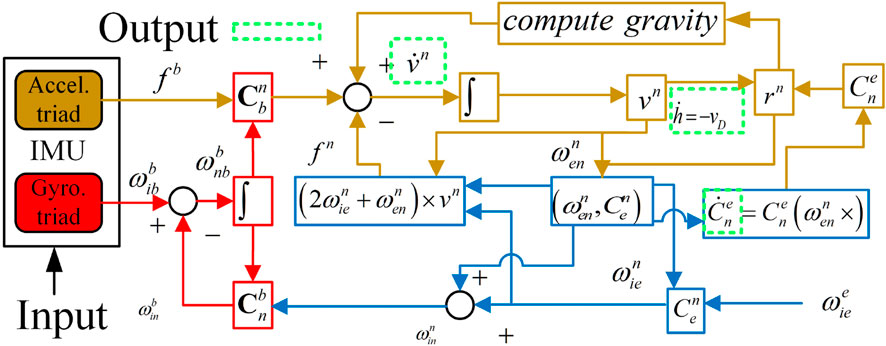
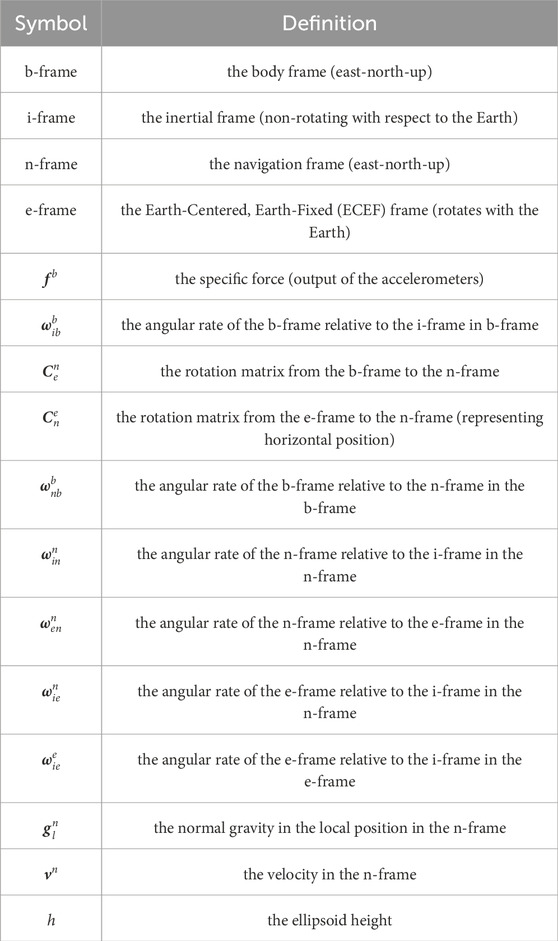
Practically, GNSS receivers obtain pseudorange and its rate by tracking the carrier and code phase of the signals received. These data are then used to estimate the receiver’s absolute location, accounting for errors such as atmospheric interference and noise, thereby improving positional accuracy. Currently, most GNSS/INS systems utilize Strapdown INS (SINS). The overall framework of the standard SINS algorithm is shown in Figure 1.
The horizontal position estimation here is virtually accomplished through the update of
The INS works discretely, and the IMU typically provides results for delta-angle
where
The quaternion form is utilized to update the position, as shown in Equation 5, for the horizontal position (latitude and longitude) to prevent numerical integration errors. The height can be updated independently using Equation 6.
The attitude quaternion update algorithm can be written as Equation 7.
where
2.2 Common loosely coupled GNSS/INS architecture
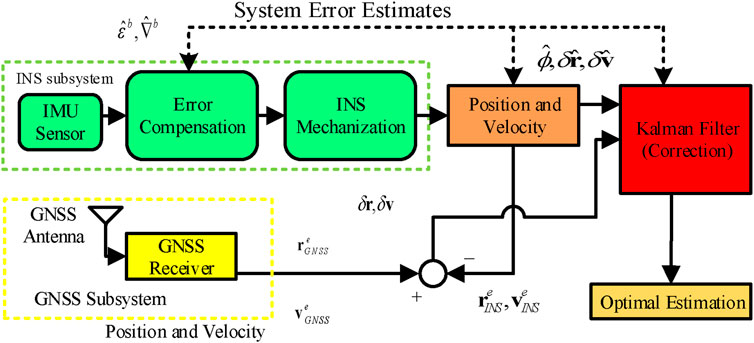
Figure 2 illustrates the architecture of the LC GNSS/INS system, where position and velocity outputs from the GNSS are fed into the Kalman filter to be fused with the inertial navigation data. In this system, the KF estimates error states (i.e.,
2.2.1 System dynamics analysis model
A typical error state vector used in case of LC GNSS/INS architecture is shown in Equation 9.
where misalignment vector is denoted as
where
where
2.2.2 Measurement model
The LC GNSS/INS utilizes the GNSS receiver-derived position and velocity (denoted as
As shown in Figure 3, GNSS antenna and IMU are fixed at different positions, forming the lever-arm vector
where
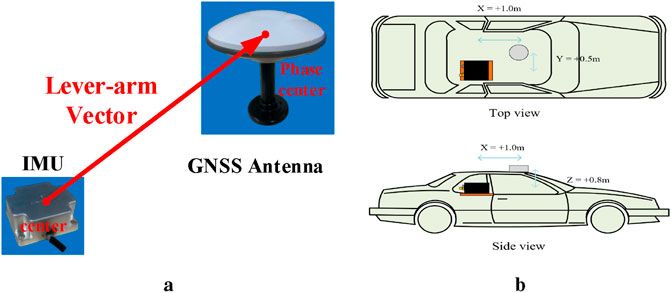
Figure 3. The lever-arm vector description. (a) The lever-arm vector
2.2.3 Kalman filter
The state-space model for LC GNSS/INS can be expressed more straightforward in a simpler linear form shown in Equation 16.
Assuming the state-space model is exact and the measurement noises follow a zero-mean Gaussian distribution, it is possible to solve Equations 16, 17 through standard KF. This approach is based on optimizing the objective function formulated in Equation 18.
where
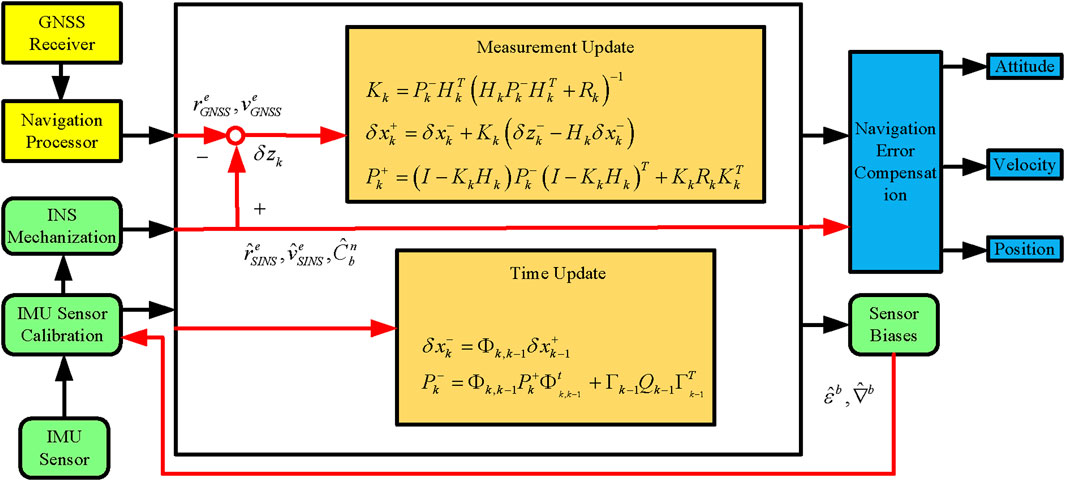
The solution of standard KF (i.e., optimal estimates of navigation errors and inertial sensor biases) is obtained by solving this least-square problem. However, it is important to note that this solution is highly sensitive to model errors. Therefore, in the LC GNSS/INS system, a standard KF is utilized, as illustrated in Figure 4.
2.3 Common tigtly coupled GNSS/INS architecture
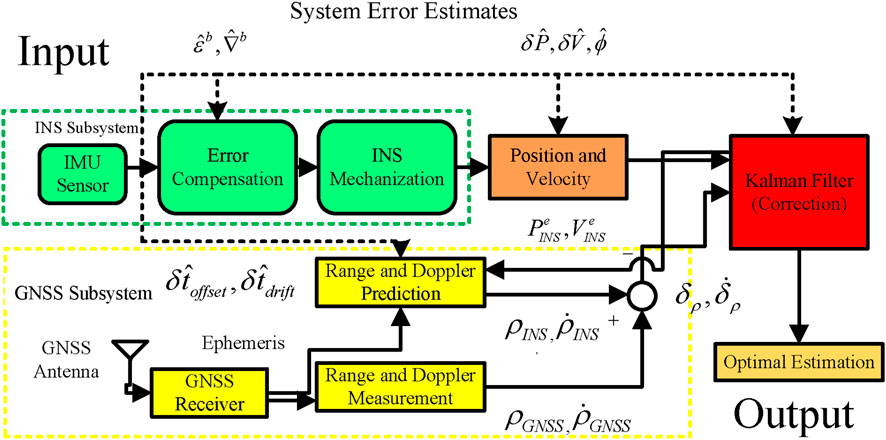
Unlike conventional LC integration, the TC model utilizes raw GNSS observations such as pseudorange, doppler shift, carrier-phase, instead of relying on GNSS solutions such as position and velocity. This approach enables more comprehensive data fusion. Figure 5 presents the structure of the TC GNSS/INS algorithm. and highlights the differences between LC and TC in the yellow dashed box.
2.3.1 System dynamics analysis model
In the TC system model, GNSS-related error states
where
where
where
2.3.2 Measurement model
The TC GNSS/INS integration method utilizes raw observations such as pseudorange
where
where
where
To obtain Equation 27, substitute Equation 26 into Equation 25 and perform Taylor series expansion.
Then, Equation 27 can be written in the matrix form as expressed in Equation 28.
where
Based on the preceding derivations, it is evident that the Tightly Coupled (TC) GNSS/INS integration method outperforms the Loosely Coupled (LC) approach in several key areas. Firstly, the TC framework implicitly accounts for variations in satellite geometry through the measurement model, effectively incorporating the effects of Position Dilution of Precision (PDoP). This provides the TC system with greater robustness against unfavorable satellite configurations. Secondly, TC integration maintains the ability to provide continuous navigation support even when fewer than four satellites are visible, which is a critical advantage in challenging environments. Nevertheless, a limitation of the traditional TC approach is its inherent vulnerability to GNSS measurement outliers, as it lacks built-in mechanisms to reject or mitigate such anomalies.
3 Evaluation: performance and computational complexity
This section is dedicated to evaluating and contrasting the performance and computational burden of LC and TC GNSS/INS integration strategies. To facilitate this comparison, our team developed an outdoor pre-experiment platform, which enabled us to assess and validate both approaches. Some initial experimental results, accompanied by a brief analysis, have already been presented. In the subsequent content, a deeper investigation of the pre-experiment is conducted to identify the potential causes of HI GNSS/INS anomalies.
3.1 Performance comparison
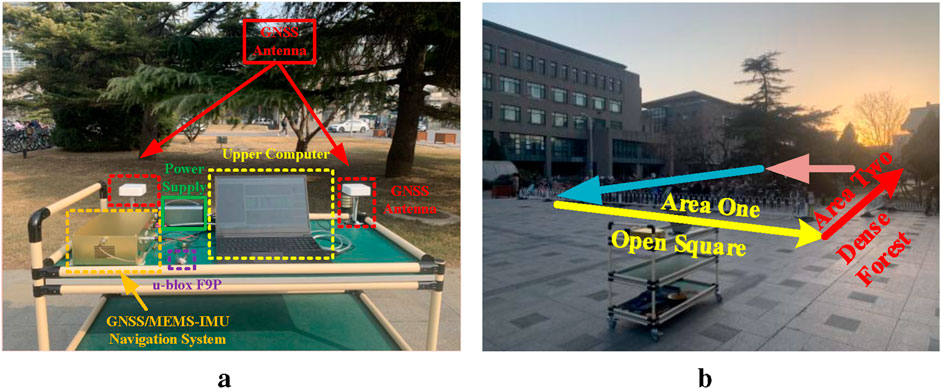
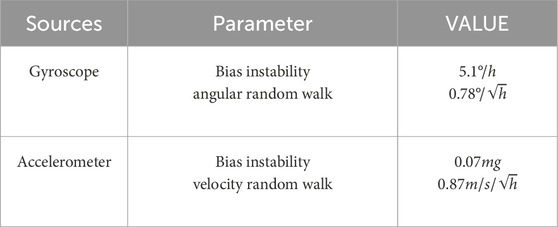
The pre-experiment was carried out on the campus of Peking University (PKU) in Beijing, China. As shown in Figure 6, the Programmable Logic (PL) of ZynqⓇ SoC is used for GNSS baseband signal processing and MEMS-IMU data collection. While GNSS positioning algorithm, INS mechanization and ESKF are implemented with Processing System (PS) of the chip. Table 2 gives the observation rate of GNSS receiver and MEMS-IMU. In Figure 7a, we designed and assembled a dedicated experimental system. The GNSS/MEMS-IMU navigation unit (blue component) executes both LC and TC algorithms independently under identical environmental conditions to derive their respective position outputs. Since the performance of the IMU plays a crucial role in the positioning accuracy of GNSS/INS integration, we include detailed specifications of the MEMS-IMU employed in the test. These specifications are summarized in Table 3. Additionally, a u-blox F9P receiver was utilized to capture high-precision position data, serving as the ground truth reference.
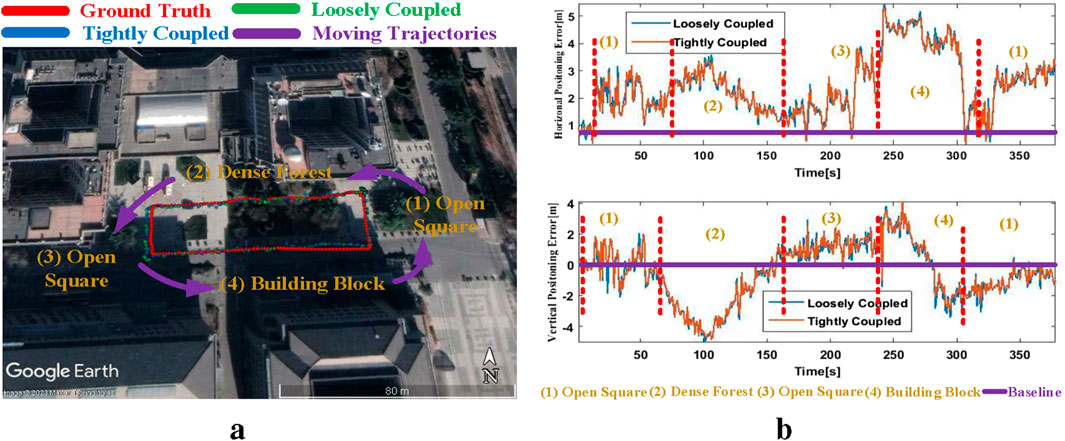
As illustrated in Figure 7b, the receiver travels from Area One to Area Two, corresponding to an open square and dense forest. This route allows for the assessment of positioning performance under varying GNSS signal conditions. The resulting trajectories are visualized using Google Earth. Figure 8a presents the movement paths derived from the receiver shown in Figure 7a. Figure 8b depicts the horizontal and vertical position errors, clearly indicating that dense vegetation and surrounding buildings negatively affect positioning accuracy. The trajectory in Figure 8a reveals that the receiver traverses four distinct environments, eventually forming a closed-loop path. These four regions and their corresponding baselines are approximately marked in Figure 8b. It is evident that both LC and TC achieve lower positioning errors in the open square (1) and open square (3), confirming that the quality of GNSS signals has a direct influence on accuracy. This further highlights that LC performs more reliably when signal conditions are favorable.
To quantitatively assess this impact, we adopted the Root Mean Square Error (RMSE) as the evaluation metric. As defined in Equation 30, RMSE is commonly utilized to measure the discrepancy between the observed position
The results of this pre-experiment demonstrate that both LC and TC methods exhibit a significant improvement in positioning accuracy when operating in environments with strong GNSS signals, such as open squares. Under practical conditions, the positioning error of TC GNSS/INS in these areas is observed to be smaller than that of LC GNSS/INS. This finding indicates that LC is capable of delivering high-precision positioning when GNSS signal conditions are favorable. Moreover, the comparative analysis between LC and TC suggests that LC remains a dependable solution for real-world navigation tasks in scenarios where signal quality is sufficient. Hence, it can be concluded that the quality of GNSS signals is a decisive factor in achieving reliable and accurate navigation.
3.2 Computational complexity evaluation
The results of the pre-experiment reveal that GNSS signal quality plays a pivotal role in the performance of both LC and TC systems in real-world scenarios. TC exhibits greater robustness under varying signal conditions, while LC is capable of achieving acceptable positioning accuracy when GNSS signals remain strong and stable. Notably, TC leverages Kalman filtering for more sophisticated GNSS data processing, which enhances accuracy but also introduces higher computational costs. In contrast, LC features a straightforward structure and ease of implementation, making it highly practical for resource-constrained applications. Against this backdrop, this study aims to investigate the potential advantages of combining the complementary features of LC and TC. Before delving into the integration strategy, it is essential to first analyze and compare the computational complexity of the LC and TC frameworks, as presented in the following part.
The computational complexity of the KF correlates with the dimensions of the state
The over all COST
4 Hybrid integration of GNSS/INS
4.1 Hybrid integration of GNSS/INS architecture
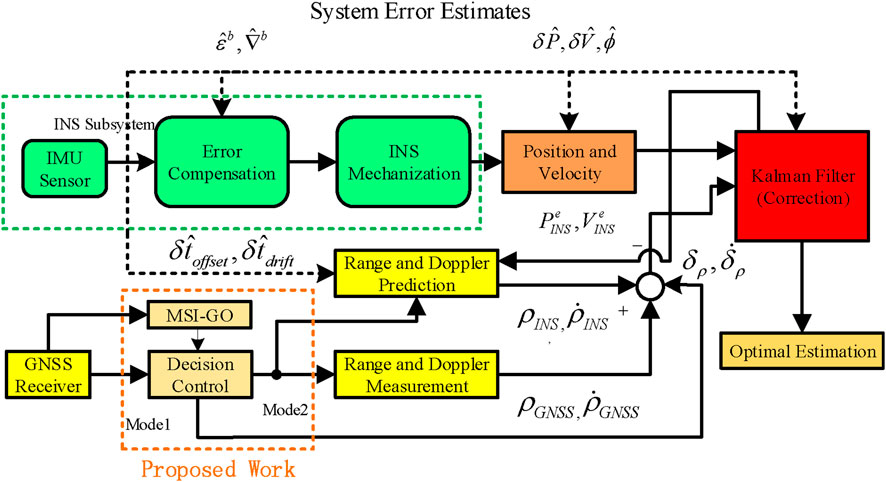
The HI GNSS/INS system leverages the strengths of both LC and TC approaches. By dynamically switching between positioning modes under the management of the MSI-GO, HI GNSS/INS achieves a balance between positioning accuracy and computational efficiency. As illustrated in Figure 9, the system architecture integrates both LC and TC modes. The components proposed in this study are highlighted within the brown dashed box in Figure 9.
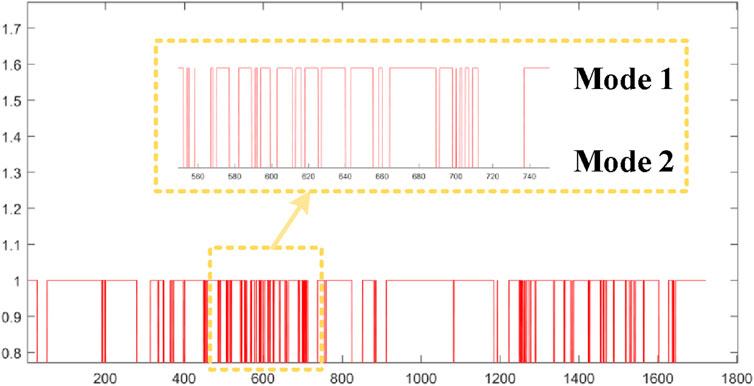
MSI-GO functions primarily as a mode selection mechanism, relying on Position Dilution of Precision (PDoP) and the Number of Satellites (NoS) as key indicators. The selection criteria are formulated based on the evaluation of position outputs and satellite observation data from both LC and TC modes over a specific time window. A detailed mathematical formulation of this process is provided in Section 4.2. The operational workflow of MSI-GO involves continuously monitoring GNSS signal conditions upon reception of satellite data, generating control signals, and subsequently determining the appropriate system mode. The output of MSI-GO is a decision matrix, denoted as
Although the overall architecture of the HI GNSS/INS system remains relatively straightforward, its key innovation lies in the integration of the MSI-GO module for intelligent mode selection. As such, it is crucial to conduct an in-depth investigation into two core aspects of the HI GNSS/INS framework: positioning accuracy and computational complexity. Initially, MSI-GO performs a quantitative evaluation of positioning accuracy and GNSS signal quality under both LC and TC modes to determine which modes meet predefined accuracy thresholds. This process ensures that the system maintains optimal positioning performance. Furthermore, if the LC mode meets the required accuracy standard, MSI-GO generates a control signal that prompts the system to operate in the LC combination mode. Given the previously analyzed computational complexity of LC and TC, this strategy enables the system to significantly reduce the computational complexity of the system. A comprehensive mathematical formulation of MSI-GO within the HI GNSS/INS system is presented in the subsequent section.
4.2 Multiple state inspection of GNSS observations (MSI-GO)
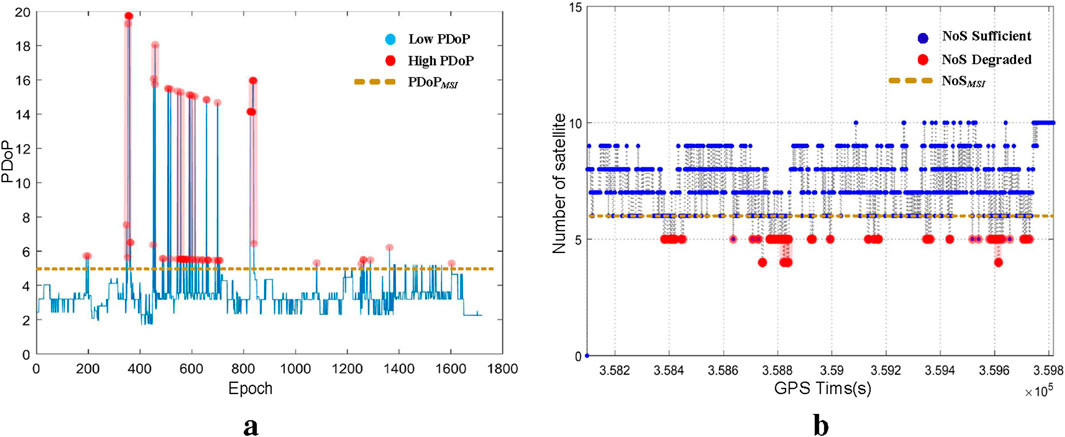
MSI-GO is primarily based on two observations: PDoP and NoS. The generation process of MSI-GO parameters (
The
where
The
where
As shown in Equation 34, the computation of
5 Simulation
5.1 Data generation
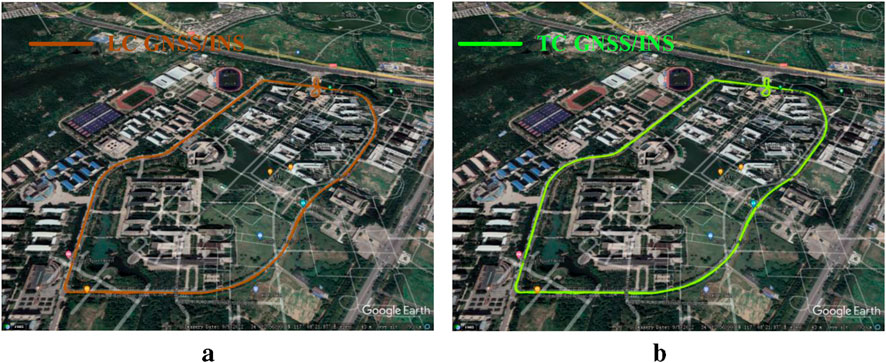
The HI GNSS/INS system relies on accurately synchronized GNSS and INS data. To validate the effectiveness of the proposed method, we employ the MATLAB-based open-source software GINav in conjunction with the publicly available CPT dataset. GINav is a versatile GNSS/INS data processing platform that supports integrated navigation analysis. It is capable of handling multi-constellation and multi-frequency GNSS data, making it well-suited for our evaluation tasks [24]. It provides a flexible and user-friendly platform for testing newly developed algorithms and experimental features. The CPT dataset, used in this study, was collected in a suburban driving environment. The data acquisition system includes a Trimble R10 GNSS receiver and a tactical-grade IMU, with high-precision reference solutions provided by the NovAtel SPAN-CPT system. This dataset enables comprehensive evaluation of various GNSS/INS navigation modes. In this work, we adopt LC SPP (Standard Point Positioning)/INS and TC SPP/INS configurations to validate the performance of the proposed HI GNSS/INS system. The data processing procedure is directly aligned with the mathematical formulation of the MSI-GO algorithm presented earlier. The trajectories of LC and TC, corresponding to
Figure 12 illustrates the PDoP and NoS values for LC and TC within the HI GNSS/INS framework. These datasets correspond to the parameters defined in Equation 31 and are utilized in the calculation of the
5.2 Results
The specific results of the
Based on Equation 34 and
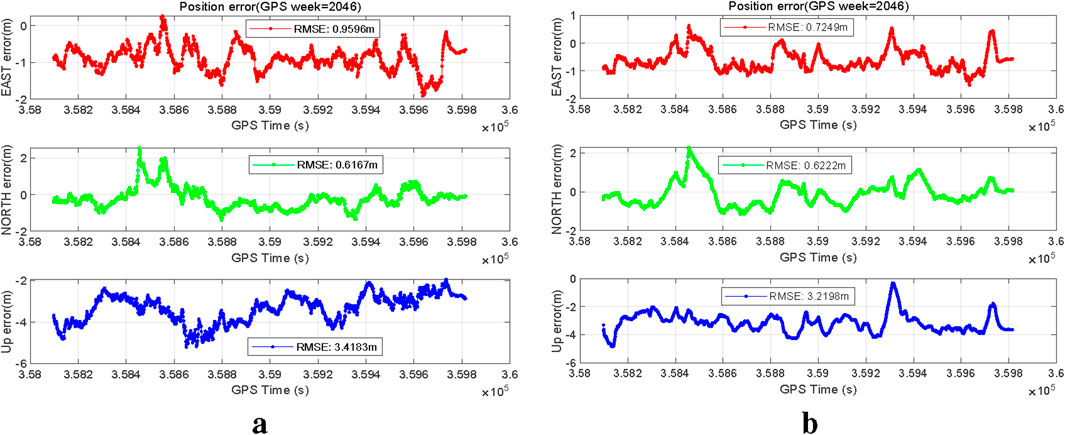
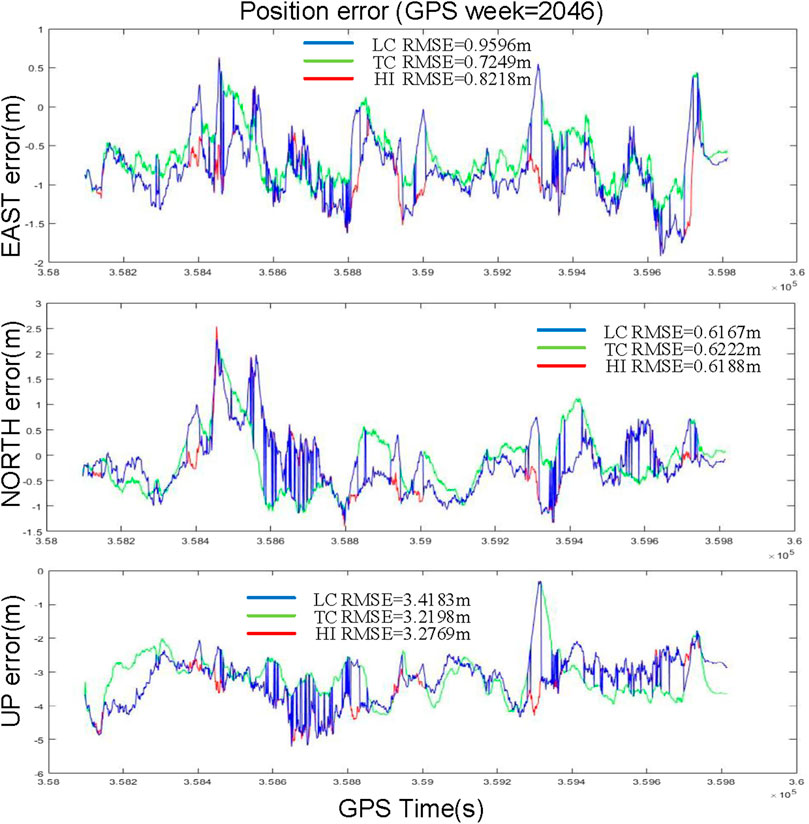
Figure 14 presents the trajectory results of the HI GNSS/INS system, which overall exhibits satisfactory positioning performance. Figure 15 compares the positioning errors of LC, TC, and HI. As shown, the RMSE values of HI in the east, north, and up directions are moderately distributed. This suggests that under the control of MSI-GO, HI employs a mode-switching strategy that maintains acceptable positioning accuracy while moderately compromising accuracy to achieve lower computational cost.
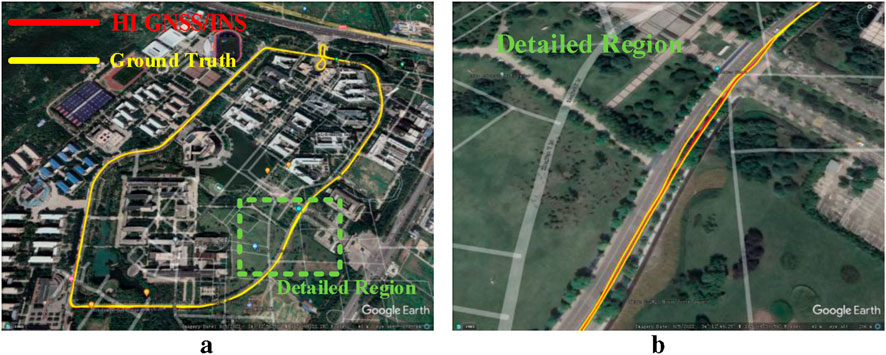
Figure 14. Trajectories of HI GNSS/INS. (a) Trajectories shown on Google Earth. (b) Trajectories in detailed region.
In other words, the adaptive mode-switching mechanism of HI effectively reduces computational complexity without significantly degrading positioning performance, thus improving the overall system efficiency. This strategy is especially beneficial in scenarios where system resources are limited and ultra-high positioning accuracy is not a strict requirement. Moreover, the relatively moderate RMSE values indicate that the trade-off strategy adopted by HI does not significantly impair system performance, making it a practical solution for real-world applications.
To provide a more intuitive evaluation of the positioning performance of HI, the Average Position Error (APE), defined in Equation 35, is introduced. APE quantifies the positional deviation in terms of three-dimensional distance. Furthermore, computational complexity is assessed by integrating the Number of Satellites (NoS) observed in each epoch. The results shown in Table 7 indicate that the HI system achieves lower computational complexity compared to TC, while also delivering better positioning accuracy than LC. These results highlight the strong practical potential of the HI GNSS/INS approach in real-world applications.
The results presented in Table 7 indicate that the HI GNSS/INS system, under the control of MSI-GO, achieves a favorable trade-off by reducing computational complexity at the expense of a slight loss in positioning accuracy. This has significant implications for the design of positioning systems intended for use in computationally constrained environments, offering a practical strategy to balance accuracy and processing demands. In summary, the HI GNSS/INS framework provides a promising approach for developing navigation systems capable of maintaining reliable performance under limited computational resources. By leveraging this strategy, system designers can achieve a balance between efficiency and accuracy, enabling broader applicability and improved adaptability across various practical scenarios.
5.3 Discussion
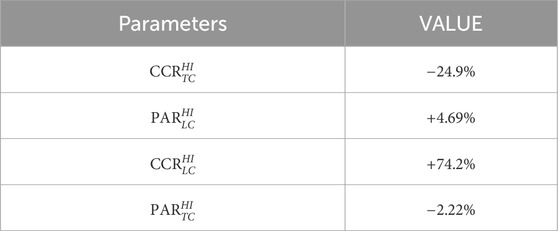
Based on the positioning results, a quantitative evaluation of positioning accuracy and computational complexity can be conducted, allowing for direct comparison with LC GNSS/INS and TC GNSS/INS systems. Subsequently, the limitations and potential drawbacks of the HI GNSS/INS approach are discussed. To facilitate this comparison, the Computational Complexity Ratio (CCR) and the Position Accuracy Ratio (PAR) are defined and formulated in Equation 36 and Equation 37, respectively.
CCR represents the ratio of the reduction in computational complexity of
Moreover, the results confirm that HI is capable of effectively balancing positioning accuracy and computational complexity across varying GNSS signal conditions. In addition, Table 5 provides the per-epoch computational costs for LC and TC. The ratio of LC to TC epochs under MSI-GO was observed during the experiments. The reported 25% in Table 8 saving for HI was estimated by combining these two components, rather than from separately measured wall-clock runtime. The thresholds used in the experiments were selected from observable statistics of PDoP and NoS to approximate the knee of this trade-off, striking a balance between accuracy and runtime. Importantly, no ground truth was used during threshold selection, so the design avoids overfitting and preserves generalizability. The reported results already include the LC baseline (lowest cost, highest error), the TC baseline (highest cost, lowest error), and the HI policy operating point in between. These three points effectively capture the outer bounds and the achieved compromise. Any ablation sweep of thresholds would simply interpolate between these reported endpoints, reproducing the monotonic trade-off already demonstrated in the results.
Although the HI GNSS/INS technology demonstrates strong potential for navigation applications, several limitations must be addressed to fully realize its capabilities: (1) First, the current HI GNSS/INS framework is not capable of real-time operation. Achieving real-time functionality requires the integration of various complex processes and system-level optimizations, which warrant further research and development. (2) Second, the validation and deployment of HI GNSS/INS are constrained by the limited diversity of test environments. To ensure system robustness and reliability, it is crucial to assess its performance under a wide range of challenging conditions, such as varying GNSS signal strengths, environmental dynamics, and application contexts. In addition, more inclusive data acquisition and analysis strategies should be adopted to ensure adaptability across diverse user needs and usage scenarios. (3) Third, the selection of the optimal
In conclusion, further research and development are essential to build a reliable and efficient HI GNSS/INS system capable of real-time operation. Moreover, enhancements in testing and evaluation methodologies are required to thoroughly verify the system’s robustness and reliability under diverse conditions. Despite these challenges, the design of MSI-GO lays a solid foundation for the continued refinement of HI GNSS/INS technology and presents promising opportunities for future advancements. In particular, a deeper exploration of the theoretical basis of MSI-GO is critical, and continued research in this domain is both necessary and valuable.
6 Conclusion
In this work, we propose a Hybrid Integration (HI) GNSS/INS framework that effectively combines the strengths of traditional LC and TC methods. The core innovation of the HI GNSS/INS system lies in its adoption of MSI-GO, which enables feature-based learning from GNSS observations. This mechanism allows the system to autonomously switch to the most suitable operating mode based on real-time signal characteristics, thereby reducing computational burden while maintaining high positioning accuracy. Simulation results demonstrate that the proposed HI GNSS/INS system achieves superior overall performance compared to conventional LC and TC approaches. Notably, the HI system reduces computational complexity by approximately
Data availability statement
The original contributions presented in the study are included in the article/supplementary material, further inquiries can be directed to the corresponding author.
Author contributions
SW: Writing – original draft, Writing – review and editing. HH: Data curation, Methodology, Writing – original draft. FT: Formal Analysis, Project administration, Writing – original draft. BZ: Funding acquisition, Resources, Writing – review and editing.
Funding
The author(s) declare that financial support was received for the research and/or publication of this article.
Acknowledgements
The authors would like to thank the editors and reviewers for their efforts in supporting the publication of this paper.
Conflict of interest
The authors declare that the research was conducted in the absence of any commercial or financial relationships that could be construed as a potential conflict of interest.
The authors declare that this study received funding from the Laboratory of Science and Technology on Marine Navigation and Control, China State Shipbuilding Corporation (Grant No. 2024010104). The funder had the following involvement in the study: researching on algorithms related to GNSS/INS integrated navigation.
Generative AI statement
The author(s) declare that no Generative AI was used in the creation of this manuscript.
Any alternative text (alt text) provided alongside figures in this article has been generated by Frontiers with the support of artificial intelligence and reasonable efforts have been made to ensure accuracy, including review by the authors wherever possible. If you identify any issues, please contact us.
Publisher’s note
All claims expressed in this article are solely those of the authors and do not necessarily represent those of their affiliated organizations, or those of the publisher, the editors and the reviewers. Any product that may be evaluated in this article, or claim that may be made by its manufacturer, is not guaranteed or endorsed by the publisher.
References
1. Boguspayev N, Akhmedov D, Raskaliyev A, Kim A, Sukhenko A. A comprehensive review of gnss/ins integration techniques for land and air vehicle applications. Appl Sci (2023) 13:4819. doi:10.3390/app13084819
2. Li X, Xia C, Li S, Zhou Y, Shen Z, Qin Z. A filter-based integration of gnss, ins, and stereo vision in tight mode with optimal smoothing. IEEE Sensors J (2023) 23:23238–54. doi:10.1109/JSEN.2023.3295816
3. Yang C, Shi W, Chen W. Robust M–m unscented kalman filtering for gps/imu navigation. J Geodesy (2019) 93:1093–104. doi:10.1007/s00190-018-01227-5
4. Shuai Q, Pang Q, Tang F, Niu Z, Zhu B. An enhanced precise carrier phase positioning method for vehicle navigation. IEEE Access (2025) 13:122484–95. doi:10.1109/ACCESS.2023.3285818
5. Xiao K, Sun F, He M, Zhang L, Zhu X. Inertial aided bds triple-frequency integer ambiguity rounding method. Adv Space Res (2021) 67:1638–55. doi:10.1016/j.asr.2020.12.013
6. Wu Y, Wang J, Hu D. A new technique for ins/gnss attitude and parameter estimation using online optimization. IEEE Trans Signal Process (2014) 62:2642–55. doi:10.1109/tsp.2014.2312317
7. Xia C, Li X, He F, Li S, Zhou Y. Accurate and rapidly-convergent gnss/ins/lidar tightly-coupled integration via invariant ekf based on two-frame group. IEEE Trans Automation Sci Eng (2025) 22:7992–8005. doi:10.1109/TASE.2024.3476069
8. Wen ZC, Li Y, Guo XL, Zhang XX. Design and evaluation of gnss/ins tightly-coupled navigation software for land vehicles. The Int Arch Photogrammetry, Remote Sensing Spat Inf Sci XLVI-3/W1-2022 (2022) 213–8. doi:10.5194/isprs-archives-XLVI-3-W1-2022-213-2022
9. Zhao J, Sun W, Ding W, Li Y, Sun P, Sun P. Vehicle cooperative positioning with tightly coupled gnss/ins/uwb integration based on improved multiple fading factors and adaptive cost function. IEEE Trans Intell Transportation Syst (2025) 26:9740–54. doi:10.1109/TITS.2025.3575812
10. Yokota Y, Ishikawa T, Watanabe S-i., Nakamura Y. Kilometer-scale sound speed structure that affects gnss-a observation: case study off the kii channel. Front Earth Sci (2020) 8:331–2020. doi:10.3389/feart.2020.00331
11. Wang H, Tang F, Wei J, Zhu B, Wang Y, Zhang K. Online semi-supervised transformer for resilient vehicle gnss/ins navigation. IEEE Trans Vehicular Technology (2024) 73:16295–311. doi:10.1109/TVT.2024.3422680
12. Wang S, Zhan X, Zhai Y, Liu B. Fault detection and exclusion for tightly coupled gnss/ins system considering fault in state prediction. Sensors (Basel) (2020) 20:590. doi:10.3390/s20030590
13. Chang J, Zhang Y, Fan S, Huang F, Xu D, Hsu L-T. An anti-spoofing model based on mvm and mccm for a loosely-coupled gnss/ins/lidar kalman filter. IEEE Trans Intell Vehicles (2024) 9:1744–55. doi:10.1109/TIV.2023.3335356
14. Lv C, Yang J, Ben Y, Li Q, Wang K, Yao J. Residual clustering analysis-based fault detection and exclusion for gnss/ins tightly coupled integration. IEEE Sensors J (2025) 25:7053–67. doi:10.1109/JSEN.2025.3526803
15. Niu X, Zhang Q, Gong L, Liu C, Zhang H, Shi C, et al. Development and evaluation of gnss/ins data processing software for position and orientation systems. Surv Rev (2015) 47:87–98. doi:10.1179/1752270614y.0000000099
16. Zhu F, Xiao T, Xu Z, Zhang Y, Lv J, Guo F, et al. Uncertainty modeling for plane and line features to improve consistency in rtk/ins/lidar integrated navigation. IEEE Trans Intell Transportation Syst (2024) 25:21002–20. doi:10.1109/TITS.2024.3474093
17. Wang D, Dong Y, Li Z, Li Q, Wu J. Constrained mems-based gnss/ins tightly coupled system with robust kalman filter for accurate land vehicular navigation. IEEE Trans Instrumentation Meas (2020) 69:5138–48. doi:10.1109/tim.2019.2955798
18. Shen K, Wang M, Fu M, Yang Y, Yin Z. Observability analysis and adaptive information fusion for integrated navigation of unmanned ground vehicles. IEEE Trans Ind Electronics (2020) 67:7659–68. doi:10.1109/tie.2019.2946564
19. Zeng Y, Lu Z, Xie Y, Ren B, Yu Y, Ni S. Overview of development and challenges of attitude determination for rotary wing uavs based on gnss. Front Phys (2025) 13:1487136–2025. doi:10.3389/fphy.2025.1487136
20. Shao XY, Gao BB, Gao SS, Gao R, Zhang J. Variational bayesian-based adaptive unscented particle filter for bds/ins integration. In: Proceedings of 2017 ieee 7th international conference on electronics information and emergency communication iceiec (2017). p. 37–40.
21. Wang H, Wei J, Qin J, Zhu N, Ren M, Zhao Z, et al. Dynamic process noise covariance adjustment in gnss/ins integrated navigation using gru-sac for enhanced positioning accuracy. IEEE Trans Intell Transportation Syst (2025) 26:9047–64. doi:10.1109/TITS.2025.3540205
22. Wu Z, Li X, Shen Z, Xu Z, Li S, Zhou Y, et al. A failure-resistant, lightweight, and tightly coupled gnss/ins/vision vehicle integration for complex urban environments. IEEE Trans Instrumentation Meas (2024) 73:1–13. doi:10.1109/TIM.2024.3406814
23. Shen Z, Li X, Li X (2024). Advancing high-precision navigation: leveraging homogeneous sensors in tightly coupled ppp-rtk/imu integration. IEEE Trans Ind Electron, 71, 15100–10. doi:10.1109/TIE.2024.3363741
24. Chen K, Chang G, Chen C. Ginav: a matlab-based software for the data processing and analysis of a gnss/ins integrated navigation system. GPS Solutions (2021) 25:108. doi:10.1007/s10291-021-01144-9
25. Zhang Q, Niu X, Zhang H, Shi C. Algorithm improvement of the low-end gnss/ins systems for land vehicles navigation. Math Probl Eng (2013) 2013:1–12. doi:10.1155/2013/435286
26. Wen W, Pfeifer T, Bai X, Hsu L-T. Factor graph optimization for gnss/ins integration: a comparison with the extended kalman filter. NAVIGATION: J Inst Navigation (2021) 68:315–31. doi:10.1002/navi.421
27. Chang Y, Wang Y, Shen Y, Ji C. A new fuzzy strong tracking cubature kalman filter for ins/gnss. GPS Solutions (2021) 25:120. doi:10.1007/s10291-021-01148-5
28. Zhang Q, Niu X, Chen Q, Zhang H, Shi C. Using allan variance to evaluate the relative accuracy on different time scales of gnss/ins systems. Meas Sci Technology (2013) 24:085006. doi:10.1088/0957-0233/24/8/085006
29. Han H, Wang J, Wang J, Tan X. Performance analysis on carrier phase-based tightly-coupled gps/bds/ins integration in gnss degraded and denied environments. Sensors (Basel) (2015) 15:8685–711. doi:10.3390/s150408685
30. Falco G, Pini M, Marucco G. Loose and tight gnss/ins integrations: comparison of performance assessed in real urban scenarios. Sensors (Basel, Switzerland) (2017) 17:E255. doi:10.3390/s17020255
31. Zhu Z, Jiang C, Bo Y. Performance enhancement of gnss/mems-imu tightly integration navigation system using multiple receivers. IEEE Access (2020) 8:52941–9. doi:10.1109/access.2020.2981769
32. Jiang C, Zhang S, Li H, Li Z. Performance evaluation of the filters with adaptive factor and fading factor for gnss/ins integrated systems. GPS Solutions (2021) 25:130. doi:10.1007/s10291-021-01165-4
33. Elsheikh M, Abdelfatah W, Nourledin A, Iqbal U, Korenberg M. Low-cost real-time ppp/ins integration for automated land vehicles. Sensors (Basel) (2019) 19:4896. doi:10.3390/s19224896
34. Vagle N, Broumandan A, Lachapelle G. Multiantenna gnss and inertial sensors/odometer coupling for robust vehicular navigation. IEEE Internet Things J (2018) 5:4816–28. doi:10.1109/JIOT.2018.2822264
35. Xu Y, Wang K, Jiang C, Li Z, Yang C, Liu D, et al. Motion-constrained gnss/ins integrated navigation method based on bp neural network. Remote Sensing (2023) 15:154. doi:10.3390/rs15010154
36. Ma Y, Fang J, Wang W, Li J. Decoupled observability analyses of error states in ins/gps integration. J Navigation (2014) 67:473–94. doi:10.1017/s0373463313000829
37. Niu Z, Nie P, Tao L, Sun J, Zhu B. Rtk with the assistance of an imu-based pedestrian navigation algorithm for smartphones. Sensors (2019) 19:3228. doi:10.3390/s19143228
38. Song X, Liao S, Wang X, Lu C, Wang M, Miao C. A high precision autonomous navigation algorithm of uav based on mems sensor. In: 2019 IEEE international conference on unmanned systems (ICUS) (2019). p. 904–8. doi:10.1109/ICUS48101.2019.8996061
39. Specht M, Specht C, Stateczny A, Burdziakowski P, Dąbrowski P, Lewicka O. Study on the positioning accuracy of the gnss/ins system supported by the rtk receiver for railway measurements. Energies (2022) 15:4094. doi:10.3390/en15114094
40. Stateczny A, Specht C, Specht M, Brčić D, Jugović A, Widźgowski S, et al. Study on the positioning accuracy of gnss/ins systems supported by dgps and rtk receivers for hydrographic surveys. Energies (2021) 14:7413. doi:10.3390/en14217413
41. Won DH, Lee E, Heo M, Lee S-W, Lee J, Kim J, et al. Selective integration of gnss, vision sensor, and ins using weighted dop under gnss-challenged environments. IEEE Trans Instrumentation Meas (2014) 63:2288–98. doi:10.1109/TIM.2014.2304365
42. Tang F, Zhang S, Zhu B, Sun J. Enhanced lidar odometry for autonomous vehicular positioning system using local feature enhancement and global motion constraint. IEEE Trans Vehicular Technology (2025) 1–16. doi:10.1109/TVT.2025.3566776
43. Li G, Tang F, Sun J, Sun Y, Zhu B. Implementation of zupt aided gnss/mems-imu deeply coupled navigation system. In: 2023 international conference on microwave and millimeter wave Technology (ICMMT) (2023). p. 1–3. doi:10.1109/ICMMT58241.2023.10276622
44. Tang F, Zhu B, Sun J. Gradient enhancement techniques and motion consistency constraints for moving object segmentation in 3d lidar point clouds. Remote Sensing (2025) 17:195. doi:10.3390/rs17020195
45. Tang F, Zhang S, Zhu B, Sun J. Outdoor large-scene 3d point cloud reconstruction based on transformer. Front Phys (2024) Volume:1474797–2024. doi:10.3389/fphy.2024.1474797
46. Tang F, Wang Z, Cheng Y. Simultaneous parameter and state estimation with extended kalman filter for dynamic parameters. In: 2024 IEEE MTT-S International Wireless Symposium (IWS) (2024). p. 1–3. doi:10.1109/IWS61525.2024.10713488
47. Tang F, Li G, Sun Y, Sun J, Zhu B. Comparison of performance between loosely and tightly coupled gnss/ins in real scenarios. In: 2023 international conference on microwave and millimeter wave Technology (ICMMT) (2023). p. 1–3. doi:10.1109/ICMMT58241.2023.10276464
Keywords: GNSS/INS, hybrid integration, state inspection, position accuracy, computational complexity
Citation: Wang S, Huang H, Tang F and Zhu B (2025) Robust GNSS/INS hybrid integration based on multi-state validation of GNSS measurements. Front. Phys. 13:1666410. doi: 10.3389/fphy.2025.1666410
Received: 15 July 2025; Accepted: 13 October 2025;
Published: 07 November 2025.
Edited by:
Jian Dong, Central South University, ChinaReviewed by:
Sunita Khichar, Chulalongkorn University, ThailandTomohiro Ozeki, Electronic Navigation Research Institute, Japan
Copyright © 2025 Wang, Huang, Tang and Zhu. This is an open-access article distributed under the terms of the Creative Commons Attribution License (CC BY). The use, distribution or reproduction in other forums is permitted, provided the original author(s) and the copyright owner(s) are credited and that the original publication in this journal is cited, in accordance with accepted academic practice. No use, distribution or reproduction is permitted which does not comply with these terms.
*Correspondence: Shan Wang, d2FuZ3NoYW5AY3VtdGIuZWR1LmNu
 Shan Wang
 Haotang Huang
 Fangzhou Tang2