Your new experience awaits. Try the new design now and help us make it even better

ORIGINAL RESEARCH article

Front. Phys., 03 October 2025

Sec. Fusion Plasma Physics

Volume 13 - 2025 | https://doi.org/10.3389/fphy.2025.1666941

This article is part of the Research TopicHigh-Intensity Laser Driven Probes for Applications, HED, and Fusion SciencesView all articles

Energy partition of fast ions and fast electrons in foil plasma expansion under continuous irradiation with kJ petawatt laser light

Natsumi Iwata
Natsumi Iwata*Yasuhiko SentokuYasuhiko Sentoku
  • Institute of Laser Engineering, The University of Osaka, Osaka, Japan

Kilojoule-class relativistic-intensity lasers with multi-picosecond (ps) pulse durations can efficiently produce fast ions in interactions with thin foil plasmas via target normal sheath acceleration (TNSA). We derive the energy partition between fast ions and fast electrons during the expansion of a thin foil plasma irradiated by a relativistic-intensity laser over picosecond timescales. As the expansion proceeds with continuous laser heating, both ion and electron energies increase simultaneously. In this study, we show that the energy partition between fast electrons and fast ions converges to a steady-state level on a ps timescale. This level is determined by the time dependence of the effective temperature of fast electrons and the dimensionality of momentum space. The steady-state level is verified by particle-in-cell simulations. The theory can be used to predict the energy conversion efficiency from the laser to fast ions for applications such as laser-driven proton sources.

1 Introduction

Laser-driven ion acceleration has gained a lot of interest as an application of high-power lasers with relativistic intensities over 1018W/cm2 [1, 2]. Recently, kilojoule (kJ)-class petawatt lasers have become available worldwide [36], opening a distinguished regime of ion acceleration with high efficiency. Experiments using the kJ-class lasers and thin foil targets demonstrate proton maximum energies of 10 MeV–50 MeV at intensity levels of 101819W/cm2, and the energy conversion rate from laser to fast protons with energies above several MeV [711] via target normal sheath acceleration (TNSA) is observed to be approximately 5% [1]. Such high-energy and high-flux ion beams can be used in applications such as radiography of dense plasmas [12, 13], neutron generation [14, 15], and fast ignition-based laser fusion [16, 17].

Modeling the energy conversion rate from laser to fast ions in the kJ laser-driven TNSA is important for the applications. In relativistic laser–foil interactions, electrons at the laser-irradiated front surface of the foil are accelerated by the laser field and launched into the overdense foil plasma. The laser-accelerated fast electrons create an electric field surrounding the foil, which accelerates ions, leading to a quasi-neutral plasma expansion. Hence, in TNSA, the laser energy is initially converted predominantly into fast electrons, after which a portion of the electron energy is transferred to fast ions during the expansion. The quasi-neutral plasma expansion proceeds with the timescale of ion fluid motion characterized by 2πωpi1, where ωpi=(4πniZ2e2/Mi)1/2 is the ion plasma frequency, ni is the ion density, Z is the ion charge state, e is the elementary charge, and Mi is the ion mass. The timescale 2πωpi1 at the critical density nc=meωL2/(4πe2) is in the order of 100  femtoseconds (fs) for the laser wavelength of λL=1  μm, where ωL is the laser frequency and me is the rest mass of an electron. Therefore, when a laser pulse with relativistic intensity and a multi-picosecond (ps) pulse duration irradiates a foil target, as in the case of kJ petawatt lasers, electron heating by the laser and ion energy gain through plasma expansion occur simultaneously, which is different from the adiabatic expansion [1820].

When the laser pulse duration is sub-ps or shorter, the effective temperature of fast electrons Te remains near the ponderomotive temperature Tp=(γe1)mec2, where γe=(1+a02/2)1/2 is the average relativistic factor of fast electrons determined by the electron oscillation energy in the linearly polarized laser electric field with the normalized amplitude a0=eEL/mecωL (where EL is the laser electric field and c is the speed of light) [21]. On the other hand, when the pulse duration is over-ps, Te increases temporally beyond Tp during the interaction [2225], while the plasma expands on a similar timescale. This indicates that a portion of the laser energy is used to heat fast electrons, while the remainder is converted into the kinetic energy of fast ions.

In this paper, we derive the temporal evolution of energies of fast electrons and ions in the expanding plasma under relativistic-intensity laser irradiation based on the non-isothermal plasma expansion model [26], which takes into account the temporal evolution of the effective fast electron temperature during the interaction. The energy partition between fast ions and fast electrons converges to a steady-state level on a ps timescale. The level is determined by the time-dependence of the effective fast electron temperature and the dimensionality of the momentum distribution of fast electrons. The theory derived in Section 2 is verified by one-dimensional (1D) and two-dimensional (2D) particle-in-cell (PIC) simulations in Section 3. Section 4 presents a discussion on the energy conversion efficiency in proton acceleration and provides the conclusion.

2 Theory

We consider the quasi-neutral expansion of a thin foil plasma irradiated by a laser light with a relativistic amplitude a0>1. The expanding plasma is composed of ions and fast electrons with an effective temperature Te, following a Boltzmann distribution. In this study, we refer to the ions in the expanding plasma as ‘fast ions’ to distinguish them from the bulk ions in the foil. We model the plasma expansion in 1D geometry since the kJ lasers have large spot sizes that are typically over 50 μm, and the expansion can be treated as 1D up to several ps without lateral energy loss [27]. We limit the discussion here to a non-relativistic regime for ions, where the ion sound velocity Cs=(ZTe/Mi)1/2 is much slower than c and the ions are cold, Ti0.

We define the areal energy density of ions in the expanding plasma in the rear side of the foil as follows:

UitRxf12Mivi2x,tnix,tdx.(1)

We define that of fast electrons as follows:

UetRxfN2Tetnex,tdx,(2)

where N is the degree of freedom of fast electrons in momentum space, vi is the ion fluid velocity, and ne=ni/Z is the electron density. Here, the plasma occupies the area of x0 initially with an ion density ni0 and expands from x=R to the front position xf(t), where the quasi-neutral condition is satisfied for x<xf. Here,

Rt=0tCstdt,(3)

which is the scale length of the expansion at time t. Ui, obtained using Equation 1, is the ion kinetic energy associated with the expansion per unit area, and Ue, obtained using Equation 2, corresponds to the internal energy owned by fast electrons with an effective temperature Te per unit area.

Here, we use ni and vi derived using the non-isothermal plasma expansion model [26].

nix,t=ni0exp1+xR+ε22xR,(4)
vix,t=Cs1+xRε2xR,(5)

which takes into account the time evolution of Te up to the first order of the smallness parameter εdefined as

εtRĊsCs2.(6)

ε<1 indicates that the timescale of the temperature evolution, (d(logTe)/dt)1=(2Ċs/Cs)1, is slower than that of the plasma expansion R/Cs, where the dot denotes the time derivative and R is given by Equation 3. For ε=0, Equations 4, 5 reproduce the self-similar solution for the isothermal plasma expansion [28, 29]. The model is applicable for the timescale ωpit1.

Substituting Equations 4, 5 into Equations 1, 2 and using the relation Cs2=ne0Te/(ni0Mi), we obtain the following:

Uit=ni0MiCs2R1+ε/2exp3ε2×A1A2expxfR+11+ε2,(7)
Uet=N2ni0MiCs2R1+ε/2exp3ε2×1expxfR+11+ε2,(8)

where the coefficients A1 and A2 are given by the following Equations 9, 10.

A1=1ε1+ε/22+ε2+ε,(9)
A2=1+xf/R21ε2+1+xf/R221ε1+ε/2+ε+A1,(10)

and the terms of order εn (n2) are neglected. The time dependence is included in the scale length R, the smallness parameter ε, and the front position xf, which is given by

xftRττlnτ+τ2+1τ2+1+1,(11)

with an approximation RCst as the isothermal model [29], where τ=ωpi0t/2exp(1) and ωpi0 is the ion plasma frequency at ni=ni0.

We plot Equations 7, 8 for N=3 normalized by the total areal energy density UUi+Ue in Figure 1a as a function of xf/R, which is the front position normalized by the expansion scale length.

Figure 1
Graph (a) shows normalized energy ratios, \( U_i/U \) in red and \( U_e/U \) in blue, against \( x_f/R \). Two epsilon values are highlighted: \( \varepsilon = 0 \) (dashed lines) and \( \varepsilon = 0.2 \) (solid lines). Graph (b) presents \( x_f/R \) against time in picoseconds, displaying a curve increasing from 2 to 10.

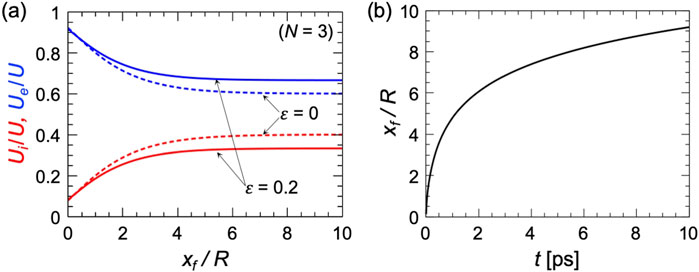
Figure 1. (a) Energy partitions of fast electrons Ue/U (blue) and fast ions Ui/U (red) for N=3 as a function of xf/R. Dashed lines are Equations 8, 7 with ε=0, and solid lines are those with ε=0.2. (b) Dependence of xf/R on the time given by Equation 11, where ωpi0 is evaluated for deuteron ions at the critical density for an electromagnetic wavelength of 1  μm.

The dashed and solid lines are represent ε=0 and ε=0.2, respectively. Note that ε=0 is the case where the effective electron temperature Te is constant temporally, and ε=0.2 denotes that Te increases gradually during the expansion. The temporal evolution of xf/R given by Equation 11 is shown in Figure 1b, where ωpi0 is evaluated for deuteron ions at the critical density ni0=nc for the laser wavelength λL=1  μm, i.e., 2πωpi01200  fs. In the early stage, where xf/R1 is not satisfied, fast electrons carry the dominant share of the energy. The ion energy partition increases afterward, and in the later stage xf/R5, the energy partition converges to a steady-state level, i.e., Ui/U=0.4 for ε=0. Note that Equation 11 is valid under the approximation RCst, and therefore, Figure 1b has an accuracy of the zeroth order of ε. The steady-state level of the energy partition is derived under the long time approximation xf/R1, by which Equations 7, 8 are reduced to the following:

Uit=ni0MiCs2R1+ε/2A1exp3ε2,(12)
Uet=ni0MiCs2R1+ε/2N2exp3ε2.(13)

The energy partitions Ui/U and Ue/U are then obtained from Equations 12, 13 as follows:

UiU=22+N13ε2N2+N,(14)
UeU=N2+N1+3ε222+N,(15)

in the first order of ε. When the time evolution of ε is negligible, Equations 14, 15 are time-independent, which denotes that the energy partition reaches to a quasi-steady-state on the long timescale xf/R1. The steady-state levels of Equations 14, 15 are determined by the temporal evolution of the fast electron effective temperature represented by ε and the dimensionality of the momentum distribution of fast electrons N. The values of Ui/U and Ue/U for ε=0 are shown in Table 1.

Table 1
www.frontiersin.org

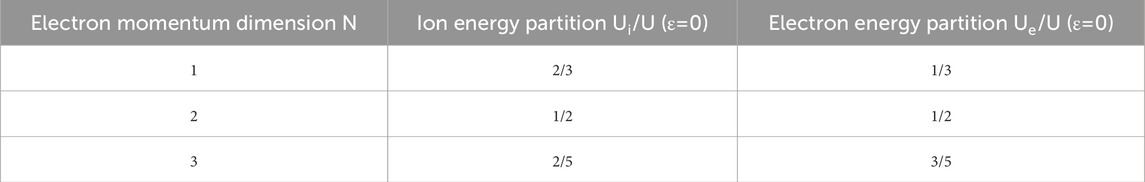
Table 1. Ratio of the ion energy Ui and electron energy Ue given by Equations 14, 15 for ε=0.

The energy partition of fast ions decreases as N increases because the momentum coupling from fast electrons to the 1D ion expansion becomes weaker. In the laser–foil interaction, the plasma expansion that takes place both at the front and rear sides of the foil is nearly symmetrical [11, 30, 31] due to the recirculation of fast electrons in the expanding plasma. Therefore, the total areal energy densities of fast ions and fast electrons in the foil expansion on both sides are expected to be twice those given by Equations 12, 13, while their ratios, Equations 14, 15, remain valid for the expansion on both sides.

After the laser irradiation ends, the plasma expansion becomes adiabatic. In the ideal case where the interaction after the laser irradiation is 1D without energy dissipation, the ion energy partition increases while satisfying the energy conservation d(Ue+Ui+Ufield)/dt=0 [19, 20], where Ufield is the areal energy density of the field. In this case, Ui/U1 can be achieved eventually after electron cooling by the expansion. In multidimensional situations, the lateral energy loss limits Ui/U in the adiabatic expansion. The energy gain of fast ions will then be dominated by the acceleration during the laser energy input, especially for the case of multi-ps pulse lasers. In contrast, when the laser pulse duration is shorter than 2πωpi1, which is approximately 200  fs for ni=nc for deuterium plasmas, the adiabatic process after the pulse time plays an important role in determining the ion energy gain. Therefore, the energy partitions given by Equations 14, 15 are applicable to describe TNSA by the kJ lasers that have pulse durations much longer than 2πωpi1 and spot sizes that are sufficiently larger than the expansion length.

As shown in Figure 1a, the energy partitions converge to the values described by Equations 14, 15 when xf/R5. The time t for this condition is estimated on the zeroth order of ε from Equation 11 as follows:

ωpi0texp4ln239,(16)

where we used the approximation ωpi0t1 in Equation 11. For ωpi0 of deuteron ions at the critical density for the laser wavelength λL=1  μm, Equation 16 yields t1.2  ps. Hence, one can expect that the steady-state energy levels given by Equations 12, 13 are achieved on a ps timescale.

3 PIC simulation

We verify the above theoretical model by 1D and 2D PIC simulations using the PICLS code [32]. In the simulations, a foil plasma is irradiated by a laser from the left side with a wavelength of 1  μm and p-polarization. The foil is modeled as a fully ionized deuterium (D) plasma, and the initial electron and ion temperatures are 0. The laser amplitude a0 increases exponentially with a Gaussian profile of temporal width τrise to the peak amplitude â0, and it stays constant afterward.

To examine the expansion with N=1, i.e., a 1D electron momentum distribution, we use a 1D PIC simulation that does not include Coulomb collisions. The foil thickness is 5  μm, and the initial density of the foil is 233nc. We place a pre-plasma having an exponential profile with a scale length of 5  μm. The foil surface is located initially at x=453  μm in the 1000  μm-long simulation box. t=0 is the time at which the laser front reaches the foil surface position. The laser peak amplitude is â0=2, and the rise time is τrise=70  fs. The mesh size is 0.017  μm, and 15 particles per cell are used for each species.

The temporal evolution of energy in the 1D simulation system is shown in Figure 2a. The values are normalized by the total input laser energy Ein up to the final time of the simulation, t=4.5  ps. The electron energy increases rapidly at early time t<0.5 ps, and the ion energy catches up to the electron energy on a ps timescale by the plasma expansion. The ion expansion front at the rear-side at the final time t=4.5  ps is approximately 200  μm away from the initial target position, as shown in (b), which presents the ion distribution in the xpx plane.

Figure 2
The image consists of three panels: (a) shows a graph of energy over time with three lines representing electrons and ions, ions, and electrons separately; (b) displays a plot of momentum versus position for ions with a color gradient indicating normalized ion density; (c) features a momentum plot for electrons with normalized electron density indicated by color.

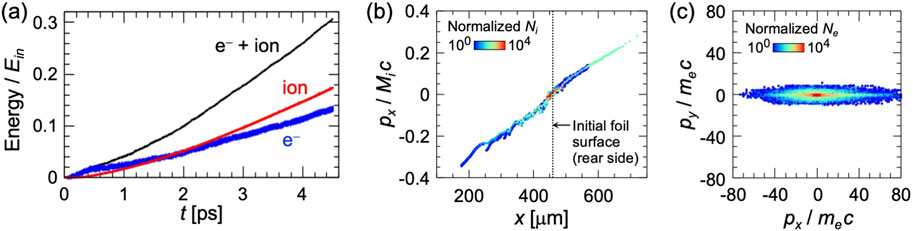
Figure 2. One-dimensional PIC simulation result. (a) Temporal evolution of energies of electrons (blue) and ions (red). The black line is the sum of the electron and ion energies. The values are normalized by the total input laser energy Ein up to the final time of the simulation, t=4.5  ps. (b) Ion distribution in the phase space xpx at t=4.5  ps. The initial foil surface position at the rear side is indicated by the dotted line. (c) Electron distribution in momentum space pxpy at t=4.5  ps.

In (b), the maximum absolute value of px at the front side is approximately 1.2 times larger than that at the rear side, while the ratio of the total energy of ions at the front side x<453  μm, Ef, and that at the rear side x>458  μm, Er, was Ef:Er=0.39:0.61. The expansion is, thus, not completely symmetric, which can cause a deviation of the simulation results from the theoretical prediction. Figure 2c shows the electron distribution in the momentum space pxpy. The distribution is almost 1D, pypx, and therefore, N=1 is applicable for this interaction.

The slope temperature of fast electrons increases temporally, as observed from the electron energy distributions in Figure 3a, where the distributions are composed of all the electrons in the simulation system. In Figure 3b, the slope temperatures Te obtained by the fitting of the electron energy distribution is shown by crosses, where the Maxwell distribution proportional to exp(Ee/Te) is assumed for the fitting. Here, Ee is the electron energy, and the fitting lines are shown by the black dashed lines in (a). Circles filled with blue in (b) are the average energy Eav of electrons whose energies are above 0.2 MeV, which is approximately half of the ponderomotive energy. The value of Eav is approximately half of the slope temperature Te at the same time, which indicates that the relation Eav=TeN/2 with N=1, i.e., the 1D momentum distribution of the fast electrons, is satisfied in this interaction. Here, we fit Eav with Eav=T0(1+(t/τ)α)N/2 for N=1 and α=1, as shown by the blue dashed line in (b). This fit yields the parameter values T0=1.6  MeV and τ=2.7  ps. The temporal evolution of Te is then obtained from the relation Te=2Eav/N, and the smallness parameter ε defined by Equation 6 is calculated for N=1 as shown in Figure 3c. As shown in Figure 3c, ε<0.3 is maintained during the simulation, and therefore, the theory in Section 2 that assumes ε1 is applicable.

Figure 3
Panel (a) shows a graph of electron energy spectra at different times (0.5 ps, 2.5 ps, 4.5 ps) with a decreasing trend. Panel (b) illustrates electron energy over time with a linear trend line showing average energy and slope. Panel (c) depicts the smallness parameter over time, showing an increasing curve. Panel (d) presents a graph of the ratio of electron and ion energy over total energy, with opposite trends intersecting near 1.5 ps.

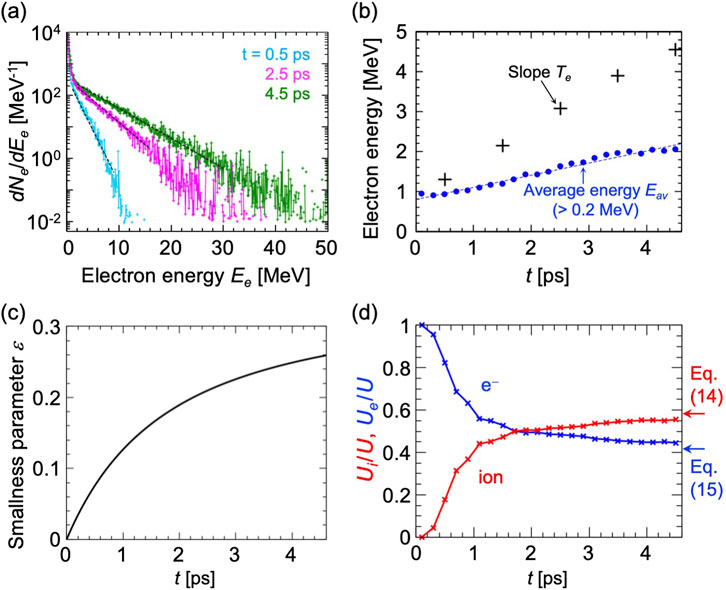
Figure 3. (a) Temporal evolution of the electron energy distribution in the 1D PIC simulation. The vertical axis is in logarithmic scale. (b) Temporal evolution of the average energy Eav of electrons whose energies are above 0.2 MeV (filled circles), and the slope temperature Te of fast electrons (crosses). Te is obtained by the fitting of the energy distributions as the black dotted lines in (a) with Maxwell distributions proportional to exp(Ee/Te). The dotted line in (b) is a fitting line of the average energy Eav using Eav=T0(1+(t/τ)α)N/2 for N=1 and α=1, which results in T0=1.6  MeV and τ=2.7  ps. (c) Temporal evolution of the smallness parameter ε obtained from the fitting line in (b). (d) Temporal evolution of the energy partition of fast ions Ui/U and fast electrons Ue/U. The arrows on the right side of panel (d) indicate the values of Ui/U and Ue/U calculated from Equations 14, 15 for N=1 and ε at the final time of the simulation t=4.5  ps in (c).

Figure 3d presents the temporal evolution of the energy partitions of the fast electrons and fast ions in the 1D simulation. For fast electrons, we calculated the sum of the energies of electrons whose energies are above 0.2 MeV. This corresponds to Ue defined by Equation 2 multiplied by the length of the simulation box in the y-direction. For fast ions, we calculated the sum of energy of ions whose energies are above 1 MeV as the corresponding value for Ui. The calculated values are then divided by the total particle energy, U=Ue+Ui, to show the energy partitions Ue/U and Ui/U. The fast ion energy partition increases and tends to saturate after approximately 1.5  ps. This timescale agrees with that indicated by Equation 16, i.e., t1.2  ps for ωpi0 of deuteron ions at the critical density. Theoretical values of Ui/U and Ue/U under the long time approximation xf/R1 in Equations 14, 15 are indicated by red and blue arrows, respectively. Here, we substitute N=1, and ε=0.26, which is obtained from Figure 3c at the final time of the simulation. The theory well-predicts the saturation values of the energy partition.

To investigate the energy partition with a multidimensional electron momentum distribution, we perform 2D PIC simulations. The 2D simulation includes Coulomb collisions, and a hydrogen plasma layer is attached to the backside of the deuterium foil to model a realistic TNSA by a kJ laser. The laser peak amplitude is â0=1.6, the spot radius is r=25  μm, and the laser amplitude a0 increases with a Gaussian profile, having a temporal width of 1.7  ps, to the peak amplitude â0 and remains constant afterward. The thicknesses of the deuterium foil and the hydrogen layer are 3.4  μm and 100nm, respectively, and the plasma is distributed uniformly in the y-direction, initially with a density of 103nc for the deuterium foil and 100nc for the hydrogen layer. The initial position of the front surface of the foil is x=216  μm. The laser front reaches the foil surface position at t=0 with a normalized amplitude of a0=0.1. The amplitude at the foil surface exceeds a0=1 at t=1.02  ps, assuming that the laser propagation speed is c. In front of the deuterium foil, pre-plasma is initially distributed at a scale length of 14  μm. The simulation box size is (x,y)=(500  μm,198  μm), the mesh size is 0.025  μm, and the number of particles per cell per species is 15.

The energy of ions increases gradually with the plasma expansion after approximately 1.5   ps, as shown in Figure 4a, which shows the temporal evolution of particle energies in the simulation system normalized by the input laser energy Ein. Figure 4b presents the spatial distributions of the electric field in the x-direction Ex averaged over the laser cycle, i.e., the sheath electric field, at t=4.3  ps. The front position of the positive Ex field represents the plasma expansion front. The expansion front is approximately 110  μm away from the initial position of the backside surface of the foil, indicated by the black dotted line. As shown in Figures 4c, d, the electron momentum distribution is three-dimensional and nearly isotropic, differing from the 1D case shown in Figure 2c. Here, the momentum distributions are observed within the central area |y|r/2, where r is the laser spot radius.

Figure 4
(a) Line graph displaying energy over time for different particle combinations: electrons, deuterium, and hydrogen. (b) Color map showing electric field distribution across a plane with x and y axes in micrometers. (c) and (d) Scatter plots showing normalized electron momentum distributions in different planes, with p_x versus p_y and p_y versus p_z, respectively. Each plot has a color bar indicating normalized electron count.

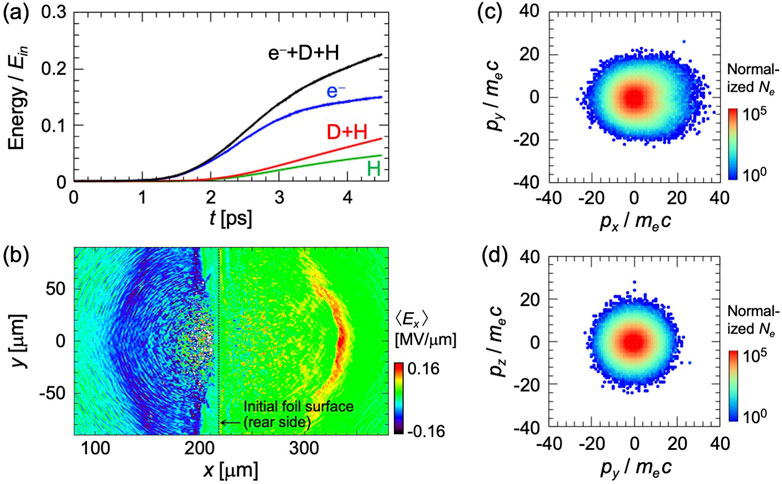
Figure 4. Two-dimensional PIC simulation result. (a) Temporal evolution of the energies of electrons (blue), protons (green), and all ions, including deuterium ions and protons (red). The black line is the sum of the electron and ion energies. The values are normalized by the total input laser energy Ein up to the final time of the simulation t=4.5  ps. (b) Electric field in the x-direction Ex at t=4.3  ps averaged over the laser period. The initial foil surface position at the rear side is indicated by the dotted line. Electron distribution in momentum space (c) pxpy and (d) pypz at t=4.3  ps. The color indicates the normalized number of electrons.

From the electron energy distributions in |y|r/2 shown in Figure  5a, we obtained the average energy Eav and the slope temperature Te of fast electrons in (b) using the same procedure as in the 1D PIC simulation. The ratio between Te and Eav at the same time is 0.75 (average). Assuming the relation Te=2Eav/N, the effective degree of freedom in the electron momentum space is N=2.66, which is between 3D (N=3) and 2D (N=2). This reflects the momentum distribution in Figures  4c,d, which is not perfectly isotropic. We fit Eav with Eav=T0(1+((tt0)/τ)α)N/2 for N=3, α=1/2, and t0=1  ps, as shown by the blue dashed line in Figure 5b. This fit yields the parameter values T0=0.11  MeV and τ=0.045  ps. Note that, at approximately t=1  ps, the laser amplitude at the foil surface exceeds a0=1 in this simulation. Figure 5c shows the smallness parameter ε of Equation 6 calculated for N=3 using the fitting line in Figure 5b and the relation Te=2Eav/N. It is observed that ε1 is also satisfied in this 2D simulation. Compared with the 1D simulation, Eav and ε in Figures 5b, c increase rapidly just after t=1  ps. This is attributed to the increase in energy absorption due to a multidimensional effect associated with the plasma surface modulation occurring on the timescale of the electron plasma frequency [33].

Figure 5
(a) Graph of electron energy distribution over time, showing three curves for 1.3, 2.3, and 4.5 picoseconds, decreasing with energy. (b) Graph of electron energy versus time displaying average energy and slope, with rising dots. (c) Graph of smallness parameter versus time, beginning at zero and leveling at around 0.2. (d) Graph of energy ratios for electrons and ions over time, with electrons decreasing and ions increasing, referencing Equations 14 and 15.

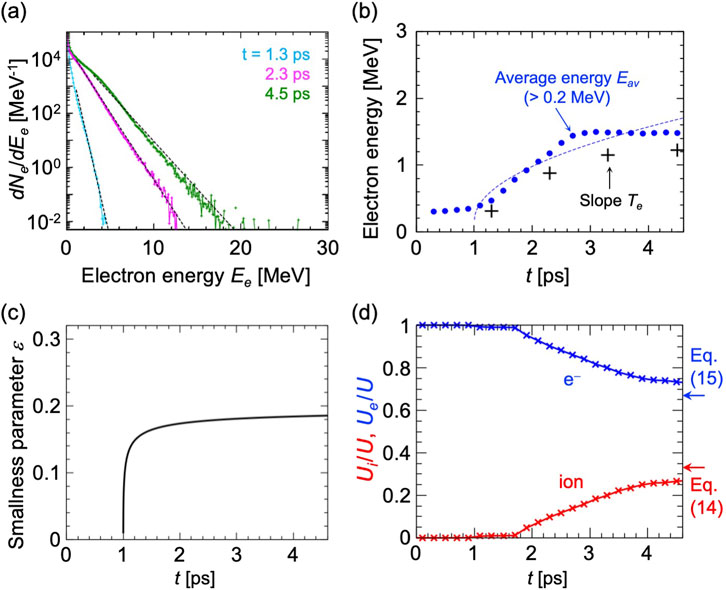
Figure 5. (a) Temporal evolution of the electron energy distribution in the 2D PIC simulation. The vertical axis is in logarithmic scale. (b) Temporal evolution of the average energy Eav of electrons whose energies are above 0.2 MeV (filled circles) and the slope temperature Te of fast electrons (crosses). Te is obtained by the fitting of the energy distributions as the black dotted lines in (a) with Maxwell distributions proportional to exp(Ee/Te). The dotted line in (b) is a fitting line of the average energy Eav using Eav=TeN/2 and Te=T0(1+((tt0)/τ)α) for N=3, α=0.5, and t0=1  ps, which results in T0=0.11  MeV and τ=0.045  ps. (c) Temporal evolution of the smallness parameter ε obtained from the fitting line in (b). (d) Temporal evolution of the energy partition of fast ions Ui/U and fast electrons Ue/U. The arrows on the right side of the panel (d) indicate the values of Ui/U and Ue/U calculated from Equations 14, 15 for N=3 and ε at the final time of the simulation t=4.5  ps in (c).

In Figure 5d, we show the temporal evolution of the energy partitions of fast electrons and fast ions in |y|r/2 in the 2D simulation, which are calculated using the same method as in the 1D simulation. The ion energy partition Ui/U (red) increases temporally and tends to saturate, as predicted by the theory, after approximately t=4  ps. The saturation levels of Ui/U and Ue/U derived from Equations 14, 15 are indicated by the arrows on the right side of the panel (d), where we substitute N=3 and ε=0.19, which is the final value of ε in Figure 5c, into Equations 14, 15. The simulation and theoretical results are close, but the ion energy partition Ui/U in the simulation is approximately 20% lower than the theoretical value. The reduction is due to the multidimensionality of the plasma expansion, i.e., the expansion length becomes larger than the laser spot diameter, as shown in Figure 4b during the multi-ps interaction, and also due to errors in fitting the average energy of fast electrons in Figure 5b.

4 Discussion and conclusion

Equations 14, 15 can be used to predict the energy conversion efficiency ηi from laser to protons accelerated by TNSA at the rear side of the foil when the laser absorption rate from laser to plasma, ηab, is known. We assume that the absorbed energy is converted to the particle energies in the expanding plasma at the front and rear sides of the foil equally. The energy conversion efficiency to fast ions at the rear side of the foil is then written as

ηi=ηab2UiU,(17)

where Ui/U is given by Equation 14. In most cases, the rear-side plasma is occupied by protons from the contaminant layer, and thus, Equation 17 corresponds to the energy conversion efficiency from laser to protons. Equation 17 indicates that, for the multidimensional case N=3, the absorbed energy is converted to the fast protons at a rate of 1/(2+N)=1/5 at the maximum by TNSA during the laser irradiation.

For the 2D simulation in Section 3, the black line in Figure 4a indicates ηab=0.23 at a final time t=4.5  ps, and Equation 14 yields Ui/U=0.33, as indicated by the red arrow in Figure 5d. Substituting them into Equation 17, we obtain ηi=3.8 %. In the simulation, Figure 4a shows that the ratio of the total proton energy and the input energy, which is equivalent to ηi, is 4.6% at t=4.5  ps (green line). Hence, the theoretical and simulation results are in close agreement, with a relative error of 17%. Although protons gain energy further in the adiabatic expansion after the pulse irradiation, the energy gain during the pulse irradiation dominantly determines the energy conversion efficiency to protons in the kJ laser interactions [34] because of the large-scale plasma expansion within the multi-ps pulse time.

In conclusion, we derived the energy partition of fast ions and fast electrons in a foil plasma expansion under kJ relativistic laser irradiation. The expansion proceeds with the over-picosecond laser heating, and energies of both fast ions and fast electrons increase simultaneously. Based on the non-isothermal quasi-neutral plasma expansion theory in 1D geometry, we find that the energy partition between fast ions and fast electrons converges to a steady-state level on a ps timescale. The level is determined by the time dependence of the effective temperature of fast electrons and their momentum distribution dimensionality. The theory is tested by PIC simulations in 1D and 2D geometry with a large laser spot (r=25  μm). In both cases, the energy partition converges to a steady-state level close to that predicted by the theory. The derived formula can be used to predict the energy conversion efficiency to fast ions in kJ laser experiments, which is important for applications of laser-driven ion sources, such as proton radiography and plasma heating in laser fusion.

Data availability statement

The original contributions presented in the study are included in the article/supplementary material; further inquiries can be directed to the corresponding author.

Author contributions

NI: Conceptualization, Writing – original draft, Formal analysis. YS: Conceptualization, Writing – review and editing.

Funding

The author(s) declare that financial support was received for the research and/or publication of this article. This study was supported by JSPS KAKENHI (grant numbers JP23K03354, JP24H00204, and JP23K20038) and JST PRESTO (grant no. JPMJPR21O1).

Acknowledgments

The authors are grateful to A. J. Kemp and S. C. Wilks for helpful discussions.

Conflict of interest

The authors declare that the research was conducted in the absence of any commercial or financial relationships that could be construed as a potential conflict of interest.

Generative AI statement

The author(s) declare that no Generative AI was used in the creation of this manuscript.

Any alternative text (alt text) provided alongside figures in this article has been generated by Frontiers with the support of artificial intelligence and reasonable efforts have been made to ensure accuracy, including review by the authors wherever possible. If you identify any issues, please contact us.

Publisher’s note

All claims expressed in this article are solely those of the authors and do not necessarily represent those of their affiliated organizations, or those of the publisher, the editors and the reviewers. Any product that may be evaluated in this article, or claim that may be made by its manufacturer, is not guaranteed or endorsed by the publisher.

References

1. Macchi A, Borghesi M, Passoni M. Ion acceleration by superintense laser-plasma interaction. Rev Mod Phys (2013) 85:751–93. doi:10.1103/RevModPhys.85.751

CrossRef Full Text | Google Scholar

2. Daido H, Nishiuchi M, Pirozhkov AS. Review of laser-driven ion sources and their applications. Rep Prog Phys (2012) 75:056401. doi:10.1088/0034-4885/75/5/056401

PubMed Abstract | CrossRef Full Text | Google Scholar

3. Miyanaga N, Azechi H, Tanaka KA, Kanabe T, Jitsuno T, Kawanaka J, et al. 10-kj pw laser for the firex-i program. J Phys IV France (2006) 133:81–7. doi:10.1051/jp4:2006133016

CrossRef Full Text | Google Scholar

4. Crane JK, Tietbohl G, Arnold P, Bliss ES, Boley C, Britten G, et al. Progress on converting a nif quad to eight, petawatt beams for advanced radiography. J Phys Conf Ser (2010) 244:032003. doi:10.1088/1742-6596/244/3/032003

CrossRef Full Text | Google Scholar

5. Maywar DN, Kelly JH, Waxer LJ, Morse SFB, Begishev IA, Bromage J, et al. Omega ep high-energy petawatt laser: progress and prospects. J Phys Conf Ser (2008) 112:032007. doi:10.1088/1742-6596/112/3/032007

CrossRef Full Text | Google Scholar

6. Miquel J-L, Prene E. LMJ and PETAL status and program overview. Nucl Fusion (2018) 59:032005. doi:10.1088/1741-4326/aac343

CrossRef Full Text | Google Scholar

7. Yogo A, Mima K, Iwata N, Tosaki S, Morace A, Arikawa Y, et al. Boosting laser-ion acceleration with multi-picosecond pulses. Scientific Rep (2017) 7:42451. doi:10.1038/srep42451

PubMed Abstract | CrossRef Full Text | Google Scholar

8. Mariscal D, Ma T, Wilks SC, Kemp AJ, Williams GJ, Michel P, et al. First demonstration of arc-accelerated proton beams at the national ignition facility. Phys Plasmas (2019) 26:043110. doi:10.1063/1.5085787

CrossRef Full Text | Google Scholar

9. Margarone D, Morace A, Bonvalet J, Abe Y, Kantarelou V, Raffestin D, et al. Generation of alpha-particle beams with a multi-kj, peta-watt class laser system. Front Phys (2020) 8:343. doi:10.3389/fphy.2020.00343

CrossRef Full Text | Google Scholar

10. Raffestin D, Lecherbourg L, Lantuéjoul I, Vauzour B, Masson-Laborde PE, Davoine X, et al. Enhanced ion acceleration using the high-energy petawatt petal laser. Matter Radiat Extremes (2021) 6:056901. doi:10.1063/5.0046679

CrossRef Full Text | Google Scholar

11. Campbell PT, Canning D, Hussein AE, Ratnayaka KDW, Thomas AGR, Krushelnick K, et al. Proton beam emittance growth in multipicosecond laser-solid interactions. New J Phys (2019) 21:103021. doi:10.1088/1367-2630/ab4721

CrossRef Full Text | Google Scholar

12. Mackinnon AJ, Patel PK, Borghesi M, Clarke RC, Freeman RR, Habara H, et al. Proton radiography of a laser-driven implosion. Phys Rev Lett (2006) 97:045001. doi:10.1103/PhysRevLett.97.045001

PubMed Abstract | CrossRef Full Text | Google Scholar

13. Simpson RA, Mariscal DA, Kim J, Scott GG, Williams GJ, Grace E, et al. Demonstration of tnsa proton radiography on the national ignition facility advanced radiographic capability (nif-arc) laser. Plasma Phys Controlled Fusion (2021) 63:124006. doi:10.1088/1361-6587/ac2349

CrossRef Full Text | Google Scholar

14. Yogo A, Lan Z, Arikawa Y, Abe Y, Mirfayzi SR, Wei T, et al. Laser-driven neutron generation realizing single-shot resonance spectroscopy. Phys Rev X (2023) 13:011011. doi:10.1103/PhysRevX.13.011011

CrossRef Full Text | Google Scholar

15. Kleinschmidt A, Bagnoud V, Deppert O, Favalli A, Frydrych S, Hornung J, et al. Intense, directed neutron beams from a laser-driven neutron source at phelix. Phys Plasmas (2018) 25:053101. doi:10.1063/1.5006613

CrossRef Full Text | Google Scholar

16. Tabak M, Hammer J, Glinsky ME, Kruer WL, Wilks SC, Woodworth J, et al. Ignition and high gain with ultrapowerful lasers. Phys Plasmas (1994) 1:1626–34. doi:10.1063/1.870664

CrossRef Full Text | Google Scholar

17. Atzeni S, Temporal M, Honrubia J. A first analysis of fast ignition of precompressed icf fuel by laser-accelerated protons. Nucl Fusion (2002) 42:L1–4. doi:10.1088/0029-5515/42/3/101

CrossRef Full Text | Google Scholar

18. Baitin AV, Kuzanyan KM. A self-similar solution for expansion into a vacuum of a collisionless plasma bunch. J Plasma Phys (1998) 59:83–90. doi:10.1017/S0022377897005916

CrossRef Full Text | Google Scholar

19. True MA, Albritton JR, Williams EA. Fast ion production by suprathermal electrons in laser fusion plasmas. The Phys Fluids (1981) 24:1885–93. doi:10.1063/1.863270

CrossRef Full Text | Google Scholar

20. Mora P. Thin-foil expansion into a vacuum. Phys Rev E (2005) 72:056401. doi:10.1103/PhysRevE.72.056401

PubMed Abstract | CrossRef Full Text | Google Scholar

21. Wilks SC, Kruer WL, Tabak M, Langdon AB. Absorption of ultra-intense laser pulses. Phys Rev Lett (1992) 69:1383–6. doi:10.1103/PhysRevLett.69.1383

PubMed Abstract | CrossRef Full Text | Google Scholar

22. Kemp AJ, Divol L. Interaction physics of multipicosecond petawatt laser pulses with overdense plasma. Phys Rev Lett (2012) 109:195005. doi:10.1103/PhysRevLett.109.195005

PubMed Abstract | CrossRef Full Text | Google Scholar

23. Sorokovikova A, Arefiev AV, McGuffey C, Qiao B, Robinson APL, Wei MS, et al. Generation of superponderomotive electrons in multipicosecond interactions of kilojoule laser beams with solid-density plasmas. Phys Rev Lett (2016) 116:155001. doi:10.1103/PhysRevLett.116.155001

PubMed Abstract | CrossRef Full Text | Google Scholar

24. Iwata N, Kojima S, Sentoku Y, Hata M, Mima K. Plasma density limits for hole boring by intense laser pulses. Nat Commun (2018) 9:623. doi:10.1038/s41467-018-02829-5

PubMed Abstract | CrossRef Full Text | Google Scholar

25. Kemp AJ, Wilks SC. Direct electron acceleration in multi-kilojoule, multi-picosecond laser pulses. Phys Plasmas (2020) 27:103106. doi:10.1063/5.0007159

CrossRef Full Text | Google Scholar

26. Iwata N, Mima K, Sentoku Y, Yogo A, Nagatomo H, Nishimura H, et al. Fast ion acceleration in a foil plasma heated by a multi-picosecond high intensity laser. Phys Plasmas (2017) 24:073111. doi:10.1063/1.4990703

CrossRef Full Text | Google Scholar

27. Iwata N, Kemp AJ, Wilks SC, Mima K, Mariscal D, Ma T, et al. Lateral confinement of fast electrons and its impact on laser ion acceleration. Phys Rev Res (2021) 3:023193. doi:10.1103/PhysRevResearch.3.023193

CrossRef Full Text | Google Scholar

28. Crow JE, Auer PL, Allen JE. The expansion of a plasma into a vacuum. J Plasma Phys (1975) 14:65–76. doi:10.1017/S0022377800025538

CrossRef Full Text | Google Scholar

29. Mora P. Plasma expansion into a vacuum. Phys Rev Lett (2003) 90:185002. doi:10.1103/PhysRevLett.90.185002

PubMed Abstract | CrossRef Full Text | Google Scholar

30. Simpson RA, Mariscal DA, Kim J, Lemos N, Grace ES, Swanson KK, et al. Investigation of boosted proton energies through proton radiography of target normal sheath acceleration fields in the multi-ps regime. Phys Plasmas (2023) 30:103103. doi:10.1063/5.0157214

CrossRef Full Text | Google Scholar

31. Iwata N, Sentoku Y, Sano T, Mima K. Plasma expansion accompanying superthermal electrons in over-picosecond relativistic laser-foil interactions. Plasma Phys Controlled Fusion (2019) 62:014011. doi:10.1088/1361-6587/ab4d02

CrossRef Full Text | Google Scholar

32. Sentoku Y, Kemp A. Numerical methods for particle simulations at extreme densities and temperatures: weighted particles, relativistic collisions and reduced currents. J Comput Phys (2008) 227:6846–61. doi:10.1016/j.jcp.2008.03.043

CrossRef Full Text | Google Scholar

33. Sentoku Y, Mima K, Kojima S-i., Ruhl H. Magnetic instability by the relativistic laser pulses in overdense plasmas. Phys Plasmas (2000) 7:689–95. doi:10.1063/1.873853

CrossRef Full Text | Google Scholar

34. Kim J, Kemp AJ, Wilks SC, Kalantar DH, Kerr S, Mariscal D, et al. Computational modeling of proton acceleration with multi-picosecond and high energy, kilojoule, lasers. Phys Plasmas (2018) 25:083109. doi:10.1063/1.5040410

CrossRef Full Text | Google Scholar

Keywords: ion acceleration, kJ petawatt laser, high-intensity laser plasma interaction, plasma expansion, particle-in-cell simulation

Citation: Iwata N and Sentoku Y (2025) Energy partition of fast ions and fast electrons in foil plasma expansion under continuous irradiation with kJ petawatt laser light. Front. Phys. 13:1666941. doi: 10.3389/fphy.2025.1666941

Received: 16 July 2025; Accepted: 29 August 2025;
Published: 03 October 2025.

Edited by:

Chris Armstrong, Science and Technology Facilities Council, United Kingdom

Reviewed by:

Jose A. Pérez-Hernández, Centro de Láseres Pulsados, Spain
Bhooshan Paradkar, UM-DAE Centre for Excellence in Basic Sciences, India

Copyright © 2025 Iwata and Sentoku. This is an open-access article distributed under the terms of the Creative Commons Attribution License (CC BY). The use, distribution or reproduction in other forums is permitted, provided the original author(s) and the copyright owner(s) are credited and that the original publication in this journal is cited, in accordance with accepted academic practice. No use, distribution or reproduction is permitted which does not comply with these terms.

*Correspondence: Natsumi Iwata, aXdhdGEubmF0c3VtaS5pbGVAb3Nha2EtdS5hYy5qcA==

Disclaimer: All claims expressed in this article are solely those of the authors and do not necessarily represent those of their affiliated organizations, or those of the publisher, the editors and the reviewers. Any product that may be evaluated in this article or claim that may be made by its manufacturer is not guaranteed or endorsed by the publisher.