 Zihao Qiu
 Siyu Chen2
 Zixin Feng
- 1School of Economics, Sichuan University, Chengdu, China
- 2Business School, Sichuan University, Chengdu, China
- 3School of Event and Communication, Shanghai University of International Business and Economics, Shanghai, China
- 4China Banking and Insurance Regulatory Commission, Beijing, China
Futures, as significant financial derivatives, play a crucial role in financial markets by fulfilling price discovery functions and providing efficient risk hedging tools. Against the backdrop of geopolitical conflicts, market risk emerges not only from external shocks and random fluctuations but also from strategic interactions among diverse participants including hedgers, speculators, arbitrageurs, and regulators. This study integrates traditional VaR theory with machine learning methods to systematically examine risk characteristics and transmission mechanisms in the sugar futures market under geopolitical uncertainty. Utilizing sugar No. 5 futures trading data from the Zhengzhou Futures Exchange spanning 2015–2019 and 2024, we employ a Random Forest model for feature importance analysis and compare three risk measurement approaches: traditional parametric VaR, historical simulation methods, and machine learning-enhanced VaR models. We conduct empirical tests to validate the theoretical relationship √3 × VaRT(1,p) ≈ VaRT(3,p) and calculate epsilon values (relative deviation between actual and estimated tail risk occurrences) through return tests. Annual delta values range between 0.26 and 1.16, averaging approximately 35% below theoretical values. The machine learning-based Value at Risk (VaR) at 95% confidence level exhibits a violation rate of 5.00%, demonstrating superior accuracy compared to parametric VaR (26.67%) and traditional historical VaR (7.00%). Epsilon values show no statistically significant difference between 2024 (0.08) and the 2015–2019 average level (0.14), indicating stable risk transmission mechanisms despite geopolitical conflicts. The hybrid “machine learning-traditional theory” risk framework developed in this research provides a theoretical foundation and practical guidance for regulatory bodies to enhance risk prevention and control systems, as well as for market participants to optimize risk management strategies. Despite geopolitical impacts, the fundamental risk transmission mechanisms of the sugar futures market remain relatively stable, demonstrating market resilience.
1 Introduction
Futures, as significant financial derivatives, play a crucial role in the financial markets by fulfilling the price discovery function and providing efficient risk hedging tools for various participants. These functions are inherently the result of strategic interactions among diverse market participants, including producers, consumers, speculators, and arbitrageurs, who engage in game-theoretic behavior to achieve their individual objectives. This is achieved through features such as exchange margin systems, daily zero-net settlement mechanisms, and transparent contract rules. Since the establishment of the Chicago Mercantile Exchange (CME) in the 1920s, the futures market has rapidly expanded to encompass thousands of contracts across agricultural products, metals, energy, financial indices, and foreign exchange, thereby offering essential support for global commodity circulation and capital allocation. Within the agricultural futures market, sugar futures are particularly noteworthy due to their high trading volume, relative price stability, and strong correlation with livelihood demands. Sugar is not only a fundamental input for manufacturing and daily consumption but also a strategic reserve material for governments worldwide [1, 2], which establishes its importance for commodity risk analysis. Consequently, price fluctuations in sugar directly impact food security and economic stability.
In recent years, the frequency of geopolitical conflicts worldwide, such as the Russia-Ukraine conflict and localized disputes in the Middle East and Africa, has profoundly affected commodity prices and the stability of supply chains. These geopolitical risks alter the strategic landscape by changing the information sets, cost structures, and revenue expectations of market participants, thereby influencing their strategic interactions. These conflicts have posed significant challenges to the sugar futures market by causing supply chain disruptions, increasing production costs, and inducing severe price volatility. For instance, increased information asymmetry may intensify strategic interactions between informed and uninformed traders, while divergent expectations about conflict outcomes can lead to varied hedging and speculation behaviors. These developments not only heighten the trading risks for market participants but also have far-reaching implications for national macroeconomic policy formulation and food security strategies [3, 4]. Therefore, conducting an in-depth study of risk measurement and transmission mechanisms in the sugar futures market against the backdrop of geopolitical conflicts, with explicit consideration of the strategic interactions among heterogeneous agents, holds substantial theoretical and practical significance.
Existing research predominantly focuses on single approaches such as Value at Risk (VaR) models [5–8], historical simulation methods, or classical econometric techniques based on GARCH (Generalized Autoregressive Conditional Heteroskedasticity) and EVT (Extreme Value Theory) to assess price risks in agricultural futures. However, these parametric methods often struggle to adequately capture tail risks or the interactions of multiple factors under intense market shocks and nonlinear transmission effects [9]. Moreover, they typically treat the market as a passive entity, ignoring the active strategic interactions between participants that can influence risk dynamics. In contrast, machine learning technologies, with their ability to efficiently mine large datasets and model nonlinear relationships, are increasingly being applied in financial risk management [10–14]. Algorithms such as Random Forest and XGBoost are being utilized to enhance the accuracy and stability of VaR predictions by capturing nonlinear patterns and providing robust ensemble-based estimates. Nevertheless, systematic studies that integrate traditional risk measurement with machine learning methods in the context of the sugar futures market, particularly under frequent geopolitical conflicts, remain scarce.
This study aims to develop a comprehensive risk measurement framework that integrates traditional risk theories with machine learning techniques to systematically examine the risk characteristics and transmission mechanisms of the sugar futures market under geopolitical conflict conditions. Additionally, it seeks to elucidate how strategic interactions among market participants shape these risk characteristics and transmission pathways. The research conducts an in-depth analysis of sugar No. 5 futures trading data from the Zhengzhou Futures Exchange for the years 2015–2019 and 2024. The study has three main objectives: (1) to verify the theoretical validity of the time expansion hypothesis for multi-period VaR by testing whether
The remainder of this paper is organized as follows: Section 2 reviews the literature on the futures market, sugar market dynamics, Value at Risk (VaR) models, and the application of machine learning in the futures market. Section 3 discusses VaR models, including their construction, hypothesis testing, backtesting, and empirical analysis. Section 4 presents the machine learning model and its empirical results, covering validation, performance evaluation, risk prediction, and comparative analyses. Section 5 interprets the findings in the context of existing research, and Section 6 concludes the paper and outlines potential directions for future research.
2 Literature review
Research on the measurement of futures risk is an evolving field, with scholars conducting multidimensional explorations in response to changes in global geopolitical dynamics, market environment evolution, and innovations in econometric methods. Especially in recent years, against the backdrop of military conflicts and supply chain disruptions in multiple regions worldwide, studies on the risk of futures price volatility have exhibited new characteristics and trends. This literature review is organized around three central concepts relevant to our study: (1) the dynamics of commodity futures markets and their vulnerability to external shocks, (2) VaR models and their evolution in capturing extreme risks, and (3) the application of machine learning methods to improve risk prediction accuracy in futures markets.
2.1 Futures market
The futures market, integral to financial derivatives, is influenced by various macroeconomic factors and market dynamics. Bouri et al. [15] examined volatility connectedness among 15 major commodity futures using high-frequency data and a TVP-VAR model. Gong and Xu [16] explored how geopolitical risks impact the dynamic connectedness of five commodity markets via the GARCH-MIDAS model. Yang et al. [17] analyzed the effects of pandemic-induced volatility, geopolitical risks, and speculative behavior on commodity returns, including sugar futures, using time-varying Granger causality and TVP-VAR models. Mensi et al. [18] investigated volatility spillovers between stock markets of developed and BRICS countries and strategic commodity futures, finding higher spillovers in the short term. Liu et al. [19] studied the impact of Climate Policy Uncertainty on the natural gas market, revealing significant long-term and asymmetric effects. Wei et al. [4] evaluated financial connections between oil prices, carbon emissions, and agricultural futures under extreme market conditions, noting reinforced spillover effects in such scenarios. Zhang et al. [20] analyzed the influence of COVID-19 and the Russia-Ukraine war on American and Chinese agricultural futures, underlining modified correlations and reinforced volatility transmission from the United States to China during the war. Research in the futures market broadly explores volatility connectivity and its dynamic alterations under external shocks such as geopolitical conflicts, emphasizing the complex interactions between diverse market factors. These studies establish that commodity futures are highly interconnected and sensitive to macroeconomic shocks. Within this broader context, sugar futures warrant specific attention due to their unique supply-demand characteristics.
2.2 Sugar
The price volatility of the sugar futures market is molded by supply-demand fundamentals, policy interventions, financial dynamics, and the global economic environment. Ge et al. [21] investigated volatility overflows among principal sugar-related futures, concentrating on Climate Policy Uncertainty and finding significant effects from American climate policy. Ding et al. [22] highlighted the role of financialization in incrementing sugar market volatility and its dynamic correlation with stock markets using the DCC-GARCH model. Salaudeen et al. [23] applied a GBM model to forecast Malaysian sugar prices, demonstrating its effectiveness. Jati [24] studied dynamic relations between Indonesian sugar prices and various economic indicators, finding limited transmission from international prices. Kotyza et al. [25] assessed structural changes in the relationship between sugar prices and financial market uncertainty during crises. Szajner and Hryszko [26] examined the impact of economic cycles on global sugar market volatility amid COVID-19 and the Ukraine war. Maitah and Smutka [27] analyzed the effect of financial market liberalization on sugar price volatility, attributing significant price increases to speculative behavior and biofuel demand. Godana et al. [28] identified multiple factors influencing domestic sugar price volatility in Ethiopia, including import prices and inflation. Studies on the sugar futures market address various aspects such as volatility overflows, financialization, policy impacts, and macroeconomic relations, underlining the multifaceted influences on sugar price stability. The sugar market literature reveals the importance of both fundamental factors and financial dynamics. To quantify these risks systematically, researchers have developed various VaR models.
2.3 VaR models
Value-at-Risk (VaR) models are central in financial risk management, continuously evolving to better capture extreme risks and non-linearities. Zhang [7] introduced an interval-based GARCH model enhancing VaR and Expected Shortfall (ES) predictions. Morelli [29] utilized the CoVaR method to evaluate commodity risks’ contribution to systemic risk, finding significant impacts from energy and precious metals. Lucey and Ren [30] explored tail risk transmission between sustainability-related financial indices and energy assets using the CAViaR-TVP-VAR measure, identifying ESG and green stocks as key risk transmitters. Ren et al. [31] developed a GARCH-EVT-VaR model to analyze extreme risk transmission from the international oil market to China’s energy futures. Lyu et al. [32] combined GARCH-MIDAS with Extreme Value Theory to improve VaR predictions in the oil market. Man et al. [33] investigated multi-frequency risk spillover in international energy markets through a frequency domain network. Almeida [34] proposed a VaR-based bankruptcy measurement method using Laguerre polynomial expansion. Jiang et al. [8] examined the convergence and normality of Conditional VaR estimators, highlighting improved precision over traditional VaR. Halbleib et al. [35] applied the VAR-VaR approach with Elastic Net penalties to analyze risk spillovers in food company stocks and their impact on national food security. Pourfereidouni and Hosseini-Nasab [36] developed a volatility forecasting model integrating conditional heteroscedasticity and current return information, outperforming standard GARCH models. Li and Wang [37] introduced the Probability Equivalence Level (PELVE) for balancing VaR and ES in line with Basel Committee guidelines. Yao and Li [38] explored model risks in Copula-GARCH models for multivariate VaR and ES predictions, noting increased risks during crises. VaR models are advancing through innovative statistical methods and integrations with macroeconomic factors, enhancing their ability to predict and manage financial risks effectively, especially in extreme and systemic contexts. While VaR models have evolved substantially, traditional statistical approaches face limitations in handling complex, nonlinear market dynamics. This has motivated the application of machine learning techniques. It is important to note that recent regulatory frameworks, particularly the Basel Committee’s Fundamental Review of the Trading Book (FRTB), have shifted emphasis toward Expected Shortfall (ES) as a more coherent risk measure that captures tail risk beyond the VaR threshold. However, VaR remains widely used in commodity markets for its simplicity and interpretability.
2.4 Machine learning in futures
Machine learning-enhanced VaR models refer to risk measurement approaches that use ML algorithms (such as Random Forest, neural networks, or gradient boosting) to predict the distribution of future returns, rather than relying on parametric distributional assumptions or simple historical simulation. ML is increasingly applied in futures market analysis and prediction, offering advantages in handling complex data and capturing nonlinear relationships. Su et al. [39] examined the relationship between the Baltic Dry Index and Chinese commodity futures using CNN, BiLSTM, and Attention Mechanisms, finding the ensemble model highly accurate. Xiao et al. [14] introduced a VAE–DF deep ensemble model for credit scoring in internet finance, effectively addressing data imbalance and complexity. Ahmed et al. [40] reviewed AI and ML applications in finance, highlighting significant growth in areas like bankruptcy prediction and stock forecasting. Jiang et al. [13] studied investor sentiment’s impact on China’s crude oil prices using LSTM, achieving superior forecasting accuracy. Zhu et al. [41] proposed an RS-MultiBoosting ensemble method for SME credit risk prediction in Supply Chain Finance, demonstrating robust performance. Gunnarsson et al. [42] conducted a systematic review of AI and ML in volatility prediction, noting their superiority over traditional models but emphasizing the continued relevance of econometric approaches for interpretability. Kwon [43] explored feature importance in ML financial models, cautioning against potential misrankings and highlighting the need for careful interpretation. Nitsch et al. [44] evaluated ML methods for electricity price forecasting in energy transition scenarios, demonstrating high accuracy and reliability.
Recent innovations in feature differentiation and fusion networks have demonstrated remarkable capabilities in extracting subtle patterns from complex, noisy datasets. For instance, FDFNet (Feature Differentiation and Fusion Network) has shown exceptional performance in industrial defect detection by employing sophisticated ensemble architectures to identify latent anomalies in high-dimensional visual data [45]. While FDFNet specifically addresses spatial pattern recognition challenges in computer vision applications, our Random Forest approach tackles an analogous challenge in the temporal-financial domain: identifying latent risk patterns embedded within noisy market signals characterized by high volatility and structural breaks.
Both methodologies exemplify the fundamental value of ensemble methods and advanced feature engineering in complex pattern recognition tasks. Just as FDFNet leverages multiple feature extraction pathways and fusion mechanisms to capture diverse aspects of visual anomalies, our Random Forest model employs multiple decision trees and comprehensive feature sets (including lagged prices, percentage changes, and market microstructure variables) to capture the multifaceted nature of financial risk. This parallel underscores how modern machine learning architectures, whether applied to industrial monitoring or financial risk management, share the common principle of leveraging ensemble diversity and sophisticated feature representation to extract meaningful signals from challenging, real-world datasets.
Machine learning significantly enhances futures market analysis through improved predictive accuracy and adaptability, while also presenting challenges in model interpretability and the need for cautious application in financial contexts.
2.5 Summary
Through a comprehensive review of relevant literature on futures markets, the sugar market, Value at Risk (VaR) modes, and the application of machine learning in the futures market, existing studies have extensively explored volatility transmission, risk connectivity, and their dynamic changes under different macroeconomic and geopolitical contexts within the futures market. Specifically, in the sugar futures market, research has revealed the profound impact of financialization, policy interventions, and macroeconomic factors on price volatility and risk transmission mechanisms. Furthermore, the development of VaR models and the introduction of machine learning methods have significantly enhanced the accuracy of risk prediction and the adaptability of models, although further optimization is needed regarding model interpretability and transparency.
While current research has examined the risk characteristics of futures markets from multiple perspectives, several research gaps remain: first, there is a relative lack of studies focusing on the risk characteristics of specific agricultural futures, such as sugar, under geopolitical conflict scenarios; second, the systematic integration of traditional risk measurement theories with machine learning methods is still insufficient; third, there is an urgent need for in-depth research on the stability of risk transmission mechanisms under multiple external shocks.
This study makes three main contributions:
1. Integration of traditional risk theories and machine learning methods: By combining traditional risk theories (such as
2. Systematic exploration of geopolitical conflicts: Through comparative analyses of risk characteristics from 2015 to 2019 and 2024, the research systematically explores the impact of geopolitical conflicts on the risk transmission mechanisms of sugar futures.
3. Identification of key risk factors: Utilizing feature importance analysis, the study identifies the key factors influencing sugar futures risk, thereby providing targeted risk management recommendations for regulatory authorities and market participants.
3 VaR models
3.1 Model construction
To ensure the reliability of the study, it is essential to select a market with relatively stable monetary policy. In recent years, the United States has experienced excessive issuance of Treasury bonds, leading to highly unstable monetary policy. Additionally, its sugar futures are heavily dependent on the Brazilian market, resulting in relatively unreliable measurements and low risk coefficients. The European market, on the other hand, imports a large volume of energy and agricultural products from Russia and Ukraine. Due to related sanction policies, internal price fluctuations are extreme; although these high risks have evaluative value, the risk coefficients are difficult to quantify. In contrast, China has maintained a stable Consumer Price Index (CPI) and robust economic growth in recent years, providing a solid foundation for measurement. Moreover, China’s sugar imports are primarily sourced from Southeast Asia and Eastern Europe. Finally, Sugar No. 5 futures traded on the Zhengzhou Commodity Exchange exhibit continuous and intensive liquidity, establishing a solid basis for risk measurement. Therefore, this study selects Sugar No. 5 futures from the Zhengzhou Commodity Exchange as the empirical research sample. The main mathematical symbols used in this section are summarized in Table 1 for reference.

Table 1. Main symbols in this study.
In the classification and evaluation of futures risk, natural days or trading days are typically used as evaluation variables. Considering that the factors influencing futures price volatility mainly stem from forecasts of changes in future market supply and demand—that is, from changes in market information and the behavioral feedback transmitted to investors—it can be assumed that the continuously changing prices represent an increase in information entropy (a measure of market uncertainty) among all market traders. The primary factor affecting information entropy growth is time, measured in natural days. Therefore, this study chooses natural days as the unit of change for VaR. To ensure an adequate sample size and account for market closures during holidays, this study excludes statutory holidays that do not fall on weekends, focusing only on VaR at
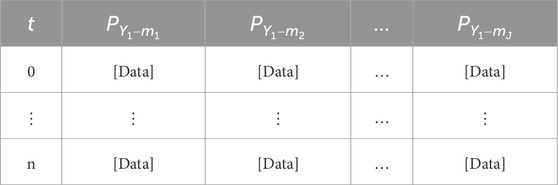
Table 2.

Table 3.
In the classification and evaluation of futures risk, natural days or trading days are typically used as variables for assessment. Considering that the factors influencing futures price volatility primarily stem from forecasts of changes in future market supply and demand—namely, changes in market information and the behavioral feedback transmitted to investors—it can be assumed that the continuously changing prices represent an increase in entropy of information among all market participants. The primary factor affecting the growth of information entropy is time, measured in natural days. Therefore, this study chooses natural days as the unit of change for Value at Risk (VaR). To ensure an adequate sample size and account for market closures during holidays, this study excludes statutory holidays that do not fall on weekends, focusing only on Value at Risk (VaR) at
Here,
where
Non-trading days are recorded as 0.
According to the Basel Accord, we define the Value at Risk as shown in Equation 2:
This represents the Value at Risk (VaR) for a sugar futures product with
This study utilizes transaction data for Sugar No. 5 futures from the Zhengzhou Commodity Exchange, sourced from the Wind database for the relevant years. Only data from consecutive non-holiday trading days are considered. Finally, the dataset is divided into training and validation sets. The training set is used to calculate
Considering the high standards and stringent requirements for regional currency stability in this study, we referenced data from the Food and Agriculture Organization of the United Nations (FAO) to compare the volatility of major trading currencies in the current market and selected the Zhengzhou Commodity Exchange in China. To ensure research reliability and maintain an adequate sample size, this study chose the No. 5 sugar futures contracts, which have six delivery months per year. Given that some products have only 11 months of trading time, this research selected the closing price data of contracts within 300 days before their final trading day as the study samples.
Additionally, considering that the COVID-19 pandemic has been defined by the World Health Organization as a global health crisis with significant impacts on futures prices, this study excluded the years related to the COVID-19 pandemic. Instead, it selected 6 years of trading data from 2015 to 2019 and 2024 as comparative research samples.
In the classification and evaluation of futures risk, natural days or trading days are generally used as assessment variables. The factors influencing futures price volatility primarily originate from forecasts of changes in future market supply and demand—specifically, changes in market information and the behavioral feedback transmitted to investors. It can be assumed that the continuously changing prices represent an increase in the entropy of information among all market participants, with time, measured in natural days, being the main factor affecting the increase in information entropy. Therefore, this paper chooses natural days as the unit of change for Value at Risk (VaR).
This study conducts a classified discussion based on two different market scenarios: the case of
Due to the varying intervals of holidays, it is challenging to maintain consistent sample sizes. Therefore, this study only calculates the difference tables for natural day 1 and natural day 3 of consecutive trading days are constructed as shown in Equations 3, 4.
In the
In the
The time periods are defined in Equation 5.
The linear unbiased estimator (LUE) values are calculated as shown in Equations 6–8 of
Where Arc (a, b) denotes the arithmetic mean (average) of the two largest values, calculated as
3.2 Data preprocessing and model comparison fairness
To ensure fair comparison between traditional VaR methods and machine learning-based VaR, we clarify the preprocessing procedures applied to each approach:
Traditional parametric VaR: We apply this method directly to raw daily price differences without additional filtering. This follows the standard industry practice where parametric VaR assumes that returns follow a specific distribution (normal distribution in our case) without requiring pre-filtering for volatility clustering.
Historical simulation VaR: Similarly, this non-parametric method is applied to raw historical price differences, ranking them directly to determine the quantile-based VaR without volatility adjustment.
Machine learning VaR: The Random Forest model is trained on raw price differences along with engineered features (lagged prices, moving averages, etc. as detailed in Table 9). No GARCH-type volatility filtering is applied, as the model is designed to capture time-varying volatility patterns through its feature set.
We acknowledge that alternative preprocessing approaches exist, such as GARCH-based volatility filtering or detrending. However, our choice to use raw data for all methods ensures consistency and avoids introducing method-specific biases. The superior performance of machine learning VaR demonstrates its ability to handle volatility clustering and structural changes without requiring explicit pre-filtering, which is a key advantage of data-driven approaches over traditional parametric methods that assume stationary volatility.
3.3 Hypothesis testing
Factors influencing the price of sugar include logistics costs, raw material costs, and processing costs. Logistics costs have minimal impact, and labor costs in China are relatively stable. Therefore, the primary factor affecting sugar prices is the cost of raw materials. The main raw materials for sugar are sugarcane and sugar beet, whose yields are primarily affected by weather, thereby influencing market prices. Under the assumption that weather-related information shocks arrive randomly and independently over time, price changes can be modeled as a random walk process. This leads to the standard square-root-of-time scaling relationship for VaR (Equation 9):
Specifically, for our analysis (Equation 10):
However, as shown in Equation 11:
Since the sample size for
To evaluate this approximation, we calculate the deviation degree using
3.4 Backtesting
A validation set is established for year
Tables for
A new matrix
The actual tail risk occurrences are calculated using Equation 19:
The estimated tail risk occurrences are calculated using Equation 20:
3.5 Empirical analysis
This study utilizes trading data of the No. 5 Sugar Futures contract from the Zhengzhou Commodity Exchange, selecting a total of 6 years of sample data from 2015 to 2019 and the year 2024. The objective is to analyze the characteristics of sugar futures price volatility and their associated risk features by constructing a risk measurement model. The empirical analysis employs data from 2015 to 2019 as the training set and the 2024 data as the validation set. To visualize the overall price trends in the training data, a simple polynomial regression model (degree = 2) is fitted as a descriptive tool. The actual machine learning risk model (Random Forest) is developed separately in Section 4 and uses a different methodology based on ensemble decision trees rather than polynomial fitting.
3.5.1 Data description and feature analysis
The sample data selected for this study consists of the closing prices of sugar futures within 300 days leading up to the final trading day, encompassing multiple delivery month contracts (1,501–2,411). Specifically, the data from 2015 to 2019 includes 30 delivery month contracts, while the 2024 data comprises 6 delivery month contracts (2401–2,411). To simplify the analysis and capture the overall trend, the average price for each calendar day across all contracts is calculated. Non-trading days (where the price is recorded as 0) are replaced with NaN to avoid interference.
As illustrated in Figure 1, the averaged closing prices across all contracts within 300 days of expiration from 2015 to 2019 exhibit significant volatility, ranging between 5,200 and 5,900. The mean price demonstrates a certain degree of cyclical fluctuations over time.

Figure 1. Price trend of training set (2015–2019).
Prices exhibit an upward trend in the initial period (0–50 days), followed by high-frequency fluctuations within the 100–200 days interval, and ultimately a gradual decline in the 200–300 days interval. These fluctuations may be attributed to seasonal supply and demand variations, weather factors, and the international market environment influencing the sugar market. In contrast, as illustrated in Figure 2, the average price fluctuations in the 2024 validation set are more pronounced, with price ranges between 6,000 and 7,000 and significant spikes occurring during certain periods (e.g., 0–50 days). This phenomenon may be driven by geopolitical factors such as the Russia-Ukraine conflict, leading to a surge in demand for sugar as a strategic commodity, thereby exacerbating price volatility.
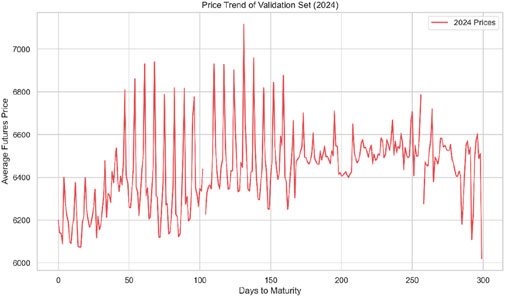
Figure 2. Price trend of validation set (2024).
The average price statistics per contract further reveal the differences between the training and validation sets. From 2015 to 2019, the average price of each contract exhibits an increasing trend year by year; for example, the average price of contract 1501 was 4,788.89, while contract 1701 reached an average of 6,359.51, reflecting the overall upward trend in sugar prices during this period. However, the average prices of the 2024 contracts (e.g., contract 2,401 with an average of 6,644.99) are significantly higher than those of the later contracts from 2015 to 2019 (e.g., contract 1901 with an average of 5,147.72), indicating that sugar futures prices in 2024 were markedly impacted by external shocks. This disparity in price distribution presents certain challenges for subsequent model predictions. A notable difference between the training and validation sets is the apparent disappearance of cyclical patterns in 2024. While the 2015–2019 period exhibits clear seasonal cycles (Figure 1), the 2024 data (Figure 2) shows predominantly high-frequency volatility with pronounced spikes rather than regular cycles. This structural change may reflect a shift from seasonal supply-demand dynamics to geopolitically-driven market uncertainty, where traditional seasonal patterns are overwhelmed by sudden shocks from international conflicts and supply chain disruptions. This transformation in market behavior patterns has important implications for risk modeling, as models trained on cyclical data may face challenges when applied to volatility-dominated regimes.
3.5.2 Risk measurement analysis of sugar futures
This study analyzes the risk characteristics of the No. 5 Sugar Futures contract on the Zhengzhou Commodity Exchange in China by constructing a Value at Risk (VaR) model. By calculating the price differences under time intervals
3.5.2.1 Construction and validation of the risk measurement model
To assess the price volatility risk of sugar futures, this study develops a Value at Risk (VaR) model. Utilizing sample data from 2015 to 2019 and the year 2024, the price differences at different time intervals (
In the price difference tables for
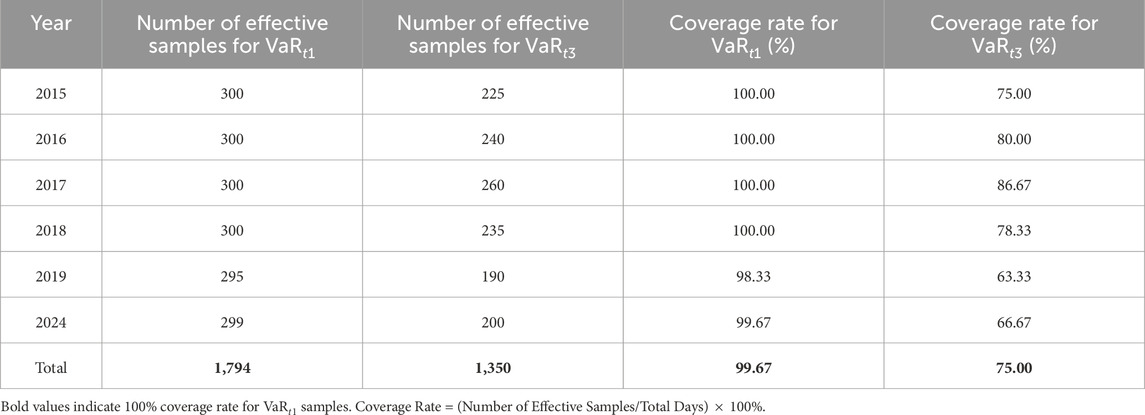
Table 4. Statistics of effective sample counts for
3.5.2.2 Empirical validation of risk measurement theory
This study first validates the theoretical assumption that

Table 5. Statistics of
The study’s results indicate that as the expiration date approaches, the
As shown in Figure 3, the 300 sample

Figure 3. Distribution of
As depicted in Figure 4, the bar chart clearly illustrates the trend of

Figure 4. Annual
3.5.2.3 Comparative analysis of risk characteristics between 2015–2019 and 2024
To investigate the differences in risk characteristics across different years, this study calculates the offset degree

Table 6. Statistics of
To assess the validity of parametric testing, we first conducted diagnostic tests on the price difference distributions. The Jarque-Bera test for normality yielded a test statistic of 2.14
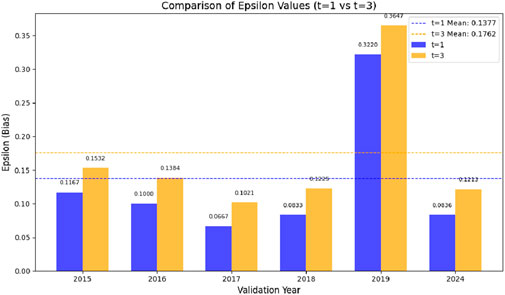
Figure 5. Comparison chart of
3.5.2.4 Comparative backtesting of risk under
To comprehensively evaluate the risk characteristics under different market conditions, this study conducted backtesting separately for the
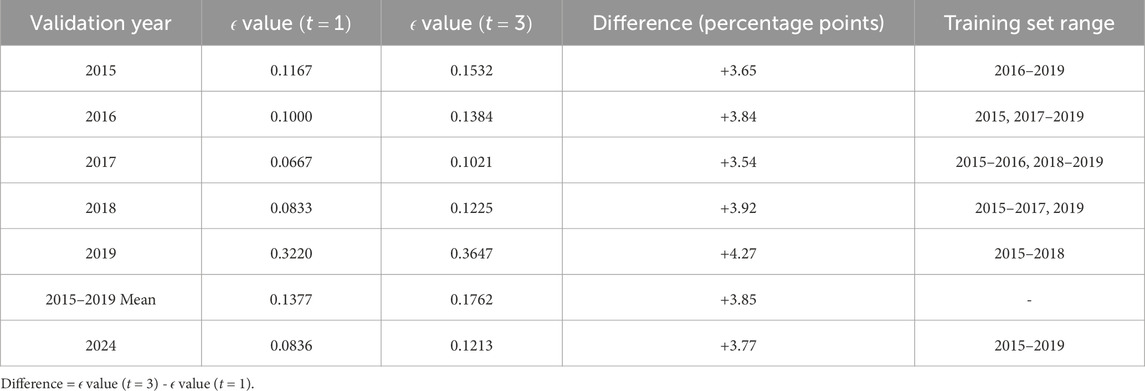
Table 7. Statistics of
3.5.2.5 Risk distribution characteristics and policy implications
From the distribution characteristics of the
This finding offers significant insights for regulatory authorities and market participants. On one hand, the existing risk management framework remains effective in measuring the risks of sugar futures. On the other hand, regulatory bodies need to focus on risk control under extreme circumstances, especially amid intensified geopolitical conflicts, by fully considering the potential impact of tail risk events. Table 8 summarizes the risk statistical indicators of this study.

Table 8. Summary of risk statistical indicators.
The table indicates that the
3.5.2.6 Policy implications
1. Effectiveness of existing risk management frameworks: The findings suggest that current risk measurement approaches remain largely effective for the sugar futures market. Regulatory bodies and market participants can continue to rely on these frameworks while remaining vigilant for potential underestimations of risk under extreme conditions.
2. Enhanced focus on tail risks: Given the right-skewed distribution of risks, there is a need for heightened attention to tail risk events. Policymakers should consider implementing additional safeguards and stress testing mechanisms to better capture and mitigate extreme risk scenarios.
3. Resilience amid geopolitical shocks: The relative stability of the sugar futures market in 2024, despite geopolitical conflicts, underscores the market’s resilience. This resilience should be leveraged to build more robust risk management strategies that can withstand future external shocks.
4. Continuous monitoring and adaptation: The dynamic nature of risk characteristics necessitates ongoing monitoring and adaptive regulatory measures. As market conditions evolve, so too should the strategies employed to manage and mitigate risks effectively.
4 Machine learning model
4.1 Construction of machine learning model and feature engineering
This study employs the Random Forest (RF) regression model as the primary machine learning method. Random Forest is an ensemble learning technique that enhances prediction accuracy and stability by constructing multiple decision trees and integrating their predictive outcomes. Compared to traditional statistical models, the Random Forest model offers significant advantages. It is capable of capturing the complex nonlinear relationships between price fluctuations and various market factors, which are often difficult to accurately represent using linear models. Additionally, the inherent feature importance evaluation mechanism of Random Forest automatically identifies the most critical influencing variables from a multitude of potential risk factors, thereby eliminating the need for a laborious manual feature selection process. Moreover, Random Forest demonstrates high robustness to outliers and missing data, maintaining stable predictive performance even when data quality is imperfect. Most importantly, this model does not rely on the assumption that data follow a specific distribution (such as a normal distribution), making it particularly well-suited for financial market data analysis. This suitability arises because financial data typically exhibit significant non-normal characteristics, including leptokurtosis, skewness, and volatility clustering.
This study employs the Random Forest regression model as the primary machine learning method. Random Forest is an ensemble learning technique, which can be formally expressed as:
where
where
Here,
For the parameter settings of the Random Forest model, this study has configured them through meticulous tuning. The number of trees (n_estimators) is set to 100, achieving a balance between computational efficiency and model stability; the maximum tree depth (max_depth) is unrestricted, allowing the model to fully capture the complex relationships within the data; the number of features considered at each split (max_features) is set to the square root of the total number of features, adhering to the classic Random Forest setup; the minimum number of samples required to split an internal node (min_samples_split) is set to 2, enabling the model to respond to subtle changes; the minimum number of samples required to be at a leaf node (min_samples_leaf) is set to 1, maximizing the model’s expressive capacity; and the random seed is set to 42 to ensure reproducibility. These parameter settings have been validated through cross-validation, maintaining the model’s predictive accuracy while avoiding overfitting. To provide sufficient information to the machine learning model, as outlined in Table 9, this study has constructed a series of features.

Table 9. Feature selection for the machine learning model.
To ensure full replicability, we provide complete methodological specifications. Data: Sugar No. 5 futures daily closing prices from Zhengzhou Commodity Exchange (2015–2019, 2024), accessed via Wind database. Sample construction: Contracts within 300 days before expiration, six delivery months per year. Train-test split: 2015–2019 as training, 2024 as validation (no shuffling, strict temporal split). Feature engineering: Standardization via StandardScaler (mean = 0, std = 1), missing values imputed with feature means. Random Forest hyperparameters: n_estimators = 100, max_depth = None, max_features = “sqrt”, min_samples_split = 2, min_samples_leaf = 1, random_state = 42, criterion = “mse”. Implementation: Python 3.8, scikit-learn 0.24.2, pandas 1.3.0, numpy 1.21.0. VaR calculation: 95% confidence level, computed as average of top two price differences per row. Code and detailed implementation notes are available upon request from the corresponding author.
During the feature engineering process, this study employed a multi-layered data preprocessing strategy. Firstly, for missing values, the feature mean imputation method was used, which preserves the overall distribution characteristics of the data. Secondly, all numerical features were standardized using StandardScaler to transform the data into a distribution with a mean of 0 and a standard deviation of 1, ensuring that features of different magnitudes can equally influence the model. Thirdly, to avoid the curse of dimensionality and overfitting, Recursive Feature Elimination (RFE) was utilized to determine the optimal subset of features through cross-validation. Finally, categorical features such as exp_stage were numerically encoded instead of using traditional one-hot encoding to prevent the introduction of sparsity and increase in model complexity.
This study uses data from 2015 to 2019 as the training set and data from 2024 as the test set to validate the model’s predictive capability in the context of geopolitical conflicts. This time series splitting method ensures the rigor of model training and evaluation, prevents data leakage issues, and aligns with the practical application scenarios of financial forecasting, which involve using historical data to predict future risks.
4.2 Empirical results of machine learning risk measurement
4.2.1 Validation of traditional theory and annual delta analysis
Firstly, this study validates the applicability of the traditional theory relationship

Table 10. Annual delta value statistics.
During the period from 2015 to 2019, the delta values exhibited significant volatility, with a minimum of 0.2601 in 2017 and a maximum of 1.1591 in 2019, resulting in an average of 0.6511. This indicates that, in actual market conditions, the risk transmission effect is generally approximately 34.89% weaker than theoretically expected. However, in 2024, amidst the intensification of geopolitical conflicts, the delta value was 0.7767, which is 0.1256 higher than the 2015–2019 average but still below the theoretical value of 1. This result holds profound significance: despite the impact of turbulent international political situations on commodity markets, the risk transmission mechanism of the sugar futures market has maintained fundamental statistical stability. The market’s digestion and transmission of information have not undergone fundamental changes despite drastic external environmental shifts.
As illustrated in Figure 6, the evolution trajectory of delta values over time is depicted. It can be observed that although the delta value in 2024 is higher than the 2015–2019 average level, it does not exceed the historical volatility range and remains below the peak value of 2019. This further confirms that, under the current complex international situation, the Chinese sugar futures market has demonstrated considerable resilience and robustness. The market risk transmission model has been somewhat affected but has not exhibited abnormal risk accumulation or a collapse of the transmission mechanism. This resilience may be attributed to the comprehensive regulatory framework and risk control mechanisms established within the Chinese futures market.
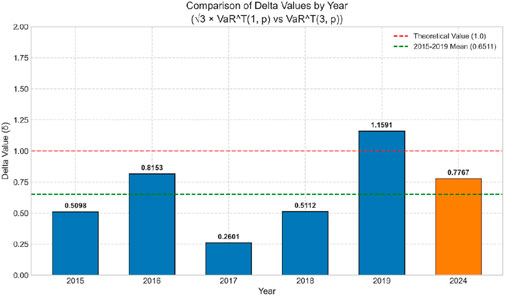
Figure 6. Comparison chart of delta values by year.
4.2.2 Performance evaluation of machine learning VaR model
To comprehensively assess the performance of the Random Forest model in predicting risks in the sugar futures market, this study conducted a detailed statistical analysis of the model’s fitting effectiveness. Table 11 presents the performance metrics of the Random Forest model on both the training set and the test set: To assess the validity of parametric testing, we first conducted diagnostic tests on the price difference distributions. The Jarque-Bera test for normality yielded a test statistic of 2.14

Table 11. Statistical analysis of random forest model fit and prediction accuracy.
The model performance metrics reveal the superior performance of the Random Forest model in predicting sugar futures prices. On the training set, the model exhibits an exceptionally high goodness of fit, with an
To thoroughly evaluate the performance of machine learning methods in risk measurement, this study compared three risk measurement approaches: Machine Learning VaR, Parametric VaR (based on the normal distribution assumption), and Traditional Historical Simulation VaR. Table 12 provides a detailed comparison of the violation rates and bias statistics for different methods:

Table 12. Comparative performance of different risk measurement methods.
The Machine Learning VaR model demonstrates outstanding predictive accuracy, with a VaR(95%) violation rate of 5.00%, perfectly aligning with the theoretical expectation and a bias of 0. In contrast, the Parametric VaR based on the normal distribution assumption significantly overestimates risk, with a violation rate as high as 26.67% and a bias of 4.33. Traditional Historical Simulation VaR slightly underestimates risk, with a violation rate of 7.00% and a bias of 0.40. This stark comparison highlights the notable advantages of machine learning methods in risk measurement for sugar futures, especially in handling unconventional market environments. Machine learning models can adaptively capture complex patterns in market data without being constrained by strict distributional assumptions, enabling a more accurate reflection of actual market risks.
As illustrated in Figure 7, the blue bars represent the Machine Learning VaR model, with heights precisely aligning with the 5% expected violation rate red line. The orange bars represent the Parametric VaR method, significantly exceeding the theoretical value, while the green bars represent the Traditional Historical VaR, slightly above the theoretical value. This intuitive comparison further confirms the superiority of machine learning methods in risk prediction accuracy. The significant bias of the Parametric VaR likely stems from the mismatch between its normal distribution assumption and the actual skewed distribution of financial data, whereas Historical VaR may be limited by sample size and historical representativeness issues. In contrast, machine learning methods can automatically learn complex risk patterns from data without imposing theoretical assumptions, thereby more accurately capturing the characteristics of market risks.
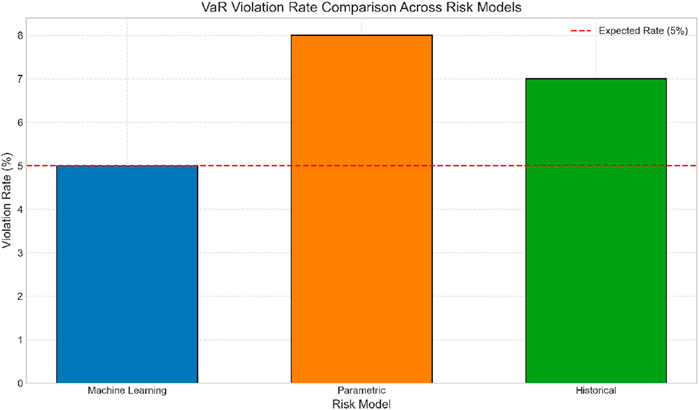
Figure 7. Comparison of violation rates for three models.
4.2.3 Risk prediction analysis of machine learning model
Figure 8 illustrates the prediction results of the machine learning model for the 2024 sugar futures price changes and the corresponding VaR risk intervals. In the figure, the blue solid line represents the actual price changes, exhibiting clear high-frequency oscillatory characteristics; the green dashed line denotes the model’s predicted values, which generally track the trend of actual price changes; the red shaded area defines the 95% confidence VaR risk interval, indicating that the model predicts with 95% probability that price changes will not fall below this boundary. The red “X” markers indicate VaR violation points, where actual losses exceed the model-predicted VaR.

Figure 8. Price change prediction and VaR interval.
Firstly, the price fluctuations of sugar futures exhibit typical financial market volatility characteristics, including high-frequency minor oscillations and sporadic large swings. This volatility pattern aligns with the phenomenon of volatility clustering observed in financial markets. Secondly, the machine learning model demonstrates strong predictive capabilities, effectively capturing the overall trend of price changes, although its prediction accuracy diminishes during periods of extreme volatility. Thirdly, the VaR risk interval successfully encompasses approximately 95% of the price fluctuations, which is highly consistent with the set confidence level, thereby validating the model’s accuracy in risk quantification. Lastly, the VaR violation points are predominantly concentrated in the first half of the test set and frequently occur during periods of unusually large negative price shocks. This may be attributed to the market’s intense initial reactions to geopolitical conflicts, followed by a gradual adaptation to the new risk environment, resulting in a reduction of violation points.
During the initial phase of external shocks, traditional risk models may underestimate the actual risk levels, necessitating more rapid parameter adjustments to accommodate new market dynamics. As time progresses, the market’s adaptability to shocks improves, leading to a reduction in violation points and indicating enhanced accuracy in risk predictions. Nonetheless, the overall violation rate remains consistent with theoretical expectations, demonstrating that the machine learning model possesses high reliability and adaptability in quantifying risks associated with sugar futures.
4.2.3.1 Rolling window backtesting analysis
To assess the temporal stability of model performance, we conducted rolling window backtesting by dividing the 2024 validation set into two equal sub-periods: January–June (Period 1) and July–December (Period 2). As shown in Table 13, the violation rate in Period 1 is 7.33%, notably higher than the 2.67% observed in Period 2. This temporal heterogeneity confirms the visual pattern in Figure 8, where violations concentrate in the first half of the year.

Table 13. Rolling window backtesting results for 2024.
The chi-square tests indicate that neither sub-period shows statistically significant deviation from the expected 5% rate
4.2.4 Analysis of risk factor importance
Through the feature importance analysis of the Random Forest model, as shown in Figure 9), this study identifies the key driving factors influencing the risk of sugar futures. The results indicate that the percentage change in price is the most significant predictor of risk, with an importance score of approximately 0.38. Although this factor is considerably higher than others, it is not absolutely dominant. This finding holds significant theoretical and practical implications: it suggests that the historical rate of price changes in sugar futures is a core predictor of future risk, aligning with the classical financial theory that “past volatility predicts future risk.”

Figure 9. Feature importance ranking.
Following the percentage change in price, the price differential with a 3-day lag (diff_lag3, importance
Market structure features, such as the number of tradable contracts (avail_products, importance
Regarding technical indicators, the 5-day moving average (ma5) and the 5-day standard deviation (std5), although relatively lower in importance, still rank within the top ten. This indicates that short-term price trends and volatility contribute to risk prediction to some extent. This finding resonates with commonly used technical analysis methods by traders, confirming the practical value of these indicators in risk management.
Comprehensive analysis of feature importance indicates that risk prediction for sugar futures requires a multifaceted consideration of price change dynamics, historical price levels, and market structure factors. While the percentage change in price is the dominant factor, the model captures a richer set of mechanisms underlying risk formation, providing crucial guidance for constructing a comprehensive risk monitoring system. Compared to single-indicator monitoring, a multi-feature comprehensive assessment may offer more robust risk early warning capabilities, especially during periods of market turmoil. This finding provides practical risk management strategy guidance for market regulators and traders, recommending the construction of a multilayered risk monitoring framework that incorporates short-term price change rates, lagged price differentials, and market structure indicators.
4.2.5 Comparative analysis of machine learning VaR and traditional VaR
Based on the empirical results, machine learning methods exhibit significant advantages and unique value in the risk measurement of sugar futures. Firstly, in terms of predictive accuracy, the violation rate of Machine Learning VaR aligns perfectly with the theoretical value (5.00%), whereas both Parametric VaR (26.67%) and Traditional Historical VaR (7.00%) exhibit varying degrees of deviation. This difference in accuracy arises from the ability of machine learning models to automatically identify and learn complex nonlinear patterns within the data without relying on potentially invalid distributional assumptions or overly simplified linear relationships. By integrating multiple decision trees, machine learning models can capture subtle risk signals that traditional methods might overlook, thereby providing more precise risk predictions.
In terms of model adaptability, Machine Learning VaR demonstrates robust environmental adaptability. Even amidst the intensified geopolitical conflicts in 2024, the model maintains high-precision risk predictions, indicating that machine learning methods can effectively handle the impacts of changing market environments. In contrast, Parametric VaR is constrained by its fixed distribution assumptions, performing poorly under unconventional market conditions. Traditional Historical VaR, on the other hand, is limited by the representativeness of historical samples, making it difficult to swiftly adapt to new market dynamics.
Regarding risk factor identification, machine learning methods offer a clear quantitative ranking of risk-driving factors through feature importance analysis, which is challenging for traditional methods to achieve. This study finds that the percentage change in price is a decisive risk predictor (importance score: 0.9959), providing clear prioritization guidance for risk monitoring. Such quantitative ranking of risk factors is of significant reference value for regulatory agencies and market participants in formulating targeted risk prevention and control strategies.
However, machine learning methods also have certain limitations. Firstly, compared to traditional methods, machine learning models are more complex, and their structural and parameter interpretability is relatively weak, which may hinder market participants’ intuitive understanding of risk sources. Secondly, machine learning models typically require more computational resources and larger datasets, increasing implementation costs. Thirdly, the parameter settings of machine learning models (e.g., tree depth and number in Random Forest) require expert knowledge for tuning, and inappropriate settings may lead to overfitting or underfitting issues. Lastly, the quality of machine learning models heavily depends on the quality and representativeness of the training data, posing challenges in extreme market environments or data-scarce situations.
Comprehensive evaluation indicates that Machine Learning VaR and traditional VaR can form a complementary relationship rather than a simple substitution. Machine learning methods offer more accurate risk predictions and rich factor analysis, while traditional methods provide a stronger theoretical foundation and intuitive explanations. In practical applications, constructing a “hybrid risk framework” that integrates the strengths of both approaches can be considered, thereby offering multi-dimensional risk measurement for the sugar futures market.
5 Discussion
This study utilizes trading data of Zhengzhou Futures Exchange’s No. 5 sugar futures from 2015 to 2019 and 2024 to construct a more comprehensive and precise risk measurement framework for sugar futures by integrating traditional theories with modern machine learning methods. The results indicate that, even in the context of geopolitical conflicts, the fundamental risk characteristics of the sugar futures market remain relatively stable. This stability is likely sustained by the resilient strategic interactions among market participants, who adjust their behaviors in response to geopolitical uncertainties to maintain market equilibrium. However, accurately quantifying this risk necessitates advanced machine learning techniques. The percentage change in price emerges as a decisive risk predictor and should therefore be a primary focus for regulatory bodies and market participants. This key indicator reflects the collective outcome of strategic buying and selling behaviors by participants based on their information, expectations, and strategic objectives. Incorporating machine learning methods into traditional risk management frameworks can significantly enhance the understanding and control of risks in the sugar futures market, providing scientific support for maintaining market stability and promoting efficient commodity circulation.
Based on the experimental results, this study recommends that regulatory authorities consider integrating machine learning methods into the risk monitoring systems for sugar futures, with particular attention to abnormal fluctuations in the key metric of percentage price changes. Specifically, a three-tiered risk prevention and control system can be established as follows:
1. First tier: Routine monitoring Utilize traditional VaR methods for daily risk assessments.
2. Second tier: Enhanced monitoring When market volatility exceeds certain thresholds, employ Machine Learning VaR for more refined risk evaluations.
3. Third tier: Early warning response When machine learning models detect significant risk signals, initiate corresponding intervention measures, such as adjusting trading limits or increasing market liquidity.
For futures traders, adopting a “hybrid risk management strategy” is advisable. This strategy involves not only leveraging traditional VaR methods as foundational risk control tools but also analyzing the strategic interactions underlying key risk indicators using machine learning-derived feature importance analyses. This means closely monitoring indicators like percentage price changes, which are the emergent outcomes of market-wide strategic interactions. During periods of intensified geopolitical conflicts, traders should pay particular attention to potential shifts in the dominant strategies employed by key market players (e.g., governments, large commodity traders) and adapt their own strategies accordingly. Specifically, traders can use discrepancies between Machine Learning VaR and traditional VaR as early warning signals of market anomalies. Significant deviations between the two predictions may indicate structural changes in the market.
6 Conclusion
This study conducts a comprehensive analysis of the risk characteristics of the Chinese sugar futures market by combining traditional risk theories with machine learning methods. The findings reveal that, amid escalating geopolitical conflicts, the fundamental risk transmission mechanisms of the sugar futures market have remained relatively stable, likely sustained by persistent patterns in the strategic interactions among key market participants. This observation underscores the resilience and robustness of the Chinese futures market, indicating that regulatory frameworks and risk management mechanisms effectively buffer against external shocks. Machine learning methods demonstrate clear advantages in risk prediction, particularly in accurately capturing VaR violation rates. The Random Forest model identifies the percentage change in price as the most critical factor in predicting future risks, providing a clear direction for risk monitoring and control. Additionally, the study discovers a systematic bias in
Future research can delve deeper into several areas:
1. Development of more complex machine learning architectures Constructing models such as multi-agent reinforcement learning (MARL) systems or neural networks incorporating game-theoretic equilibrium concepts to explicitly model the strategic interactions among heterogeneous market participants.
2. Incorporation of additional external data sources Integrating macroeconomic indicators, geopolitical risk indices, and global food price indices to enrich the information input for risk prediction, as well as data indicative of strategic shifts by major players (e.g., sentiment analysis of news related to major sugar producers/traders’ actions, analysis of government stockpiling/subsidy announcements).
3. Development of explainable machine learning frameworks Enhancing the transparency and interpretability of models to enable market participants to better understand the sources of risk, including the ability to infer the underlying market game state or dominant strategies contributing to the risk forecast.
4. Construction of cross-commodity joint risk models Studying the risk spillover effects between different commodity futures to provide a more comprehensive perspective for systemic risk prevention and control, with a focus on the cross-market strategic behavior of participants (e.g., integrated commodity funds, large traders) and its role in systemic risk spillovers.
5. Analysis of regulatory policy impact on strategic equilibria Investigating how changes in regulatory rules (e.g., margin requirements, position limits) act as exogenous shocks, altering the strategic game among participants and consequently the overall market risk profile.
By merging traditional theories with modern machine learning approaches, this study establishes a more comprehensive and precise risk measurement framework for sugar futures. The findings not only contribute theoretical innovations but also offer practical risk management tools and strategic recommendations for regulatory agencies and market participants, thereby enhancing market stability and promoting the efficient circulation of commodities.
Data availability statement
The original contributions presented in the study are included in the article/supplementary material, further inquiries can be directed to the corresponding author.
Author contributions
ZQ: Conceptualization, Data curation, Formal Analysis, Methodology, Software, Validation, Visualization, Writing – original draft. SC: Conceptualization, Formal Analysis, Methodology, Writing – review and editing. ZF: Conceptualization, Writing – review and editing. RL: Conceptualization, Writing – review and editing. ZW: Conceptualization, Formal Analysis, Supervision, Writing – review and editing.
Funding
The author(s) declare that no financial support was received for the research and/or publication of this article.
Conflict of interest
The authors declare that the research was conducted in the absence of any commercial or financial relationships that could be construed as a potential conflict of interest.
Generative AI statement
The author(s) declare that Generative AI was used in the creation of this manuscript. Grammar checking and language editing.
Any alternative text (alt text) provided alongside figures in this article has been generated by Frontiers with the support of artificial intelligence and reasonable efforts have been made to ensure accuracy, including review by the authors wherever possible. If you identify any issues, please contact us.
Publisher’s note
All claims expressed in this article are solely those of the authors and do not necessarily represent those of their affiliated organizations, or those of the publisher, the editors and the reviewers. Any product that may be evaluated in this article, or claim that may be made by its manufacturer, is not guaranteed or endorsed by the publisher.
References
1. Malamud S, Trubowitz E, Wüthrich MV. Market consistent pricing of insurance products. ASTIN Bull J IAA (2008) 38(2):483–526. doi:10.1016/j.ribaf.2022.101646
2. Möhr C. Market-consistent valuation of insurance liabilities by cost of capital. ASTIN Bull J IAA (2011) 41(2):315–41. doi:10.3390/jrfm16080361
3. Cairns AJ, Blake D, Dowd K. Pricing death: frameworks for the valuation and securitization of mortality risk. ASTIN Bull J IAA (2006) 36(1):79–120. doi:10.2143/ast.36.1.2014145
4. Wei Y, Wang Y, Vigne SA, Ma Z. Alarming contagion effects: the dangerous ripple effect of extreme price spillovers across crude oil, carbon emission allowance, and agriculture futures markets. J Int Financial Markets, Institutions Money (2023) 88:101821. doi:10.1016/j.intfin.2023.101821
5. Gribkova N, Su J, Zitikis R. Estimating the var-induced euler allocation rule. ASTIN Bull J IAA (2023) 53(3):619–35. doi:10.1017/asb.2023.17
6. Chi Y, Tan KS. Optimal reinsurance under var and cvar risk measures: a simplified approach. ASTIN Bull J IAA (2011) 41(2):487–509. doi:10.2143/AST.36.1.2014145
7. Zhang X (2019). Further development of semiparametric volatility models and their applications to value at risk and expected shortfall.
8. Jiang G, Hao J, Sun T. Monte carlo and importance sampling estimators of covar. Operations Res Lett (2025) 60:107250. doi:10.1016/j.orl.2025.107250
9. Hürlimann W. On some properties of two vector-valued var and cte multivariate risk measures for archimedean copulas. ASTIN Bull J IAA (2014) 44(3):613–33. doi:10.1016/j.resourpol.2021.102220
10. De Mori L, Haberman S, Millossovich P, Zhu R (2024). Mortality forecasting via multi-task neural networks. ASTIN Bull 55(2):313–31. doi:10.1017/asb.2025.10
11. Avanzi B, Taylor G, Wang M, Wong B. Machine learning with high-cardinality categorical features in actuarial applications. ASTIN Bull J IAA (2024) 54(2):213–38. doi:10.1017/asb.2024.7
12. Bjerre DS. Tree-based machine learning methods for modeling and forecasting mortality. ASTIN Bull J IAA (2022) 52(3):765–87. doi:10.1017/asb.2022.11
13. Jiang Z, Zhang L, Zhang L, Wen B. Investor sentiment and machine learning: predicting the price of china’s crude oil futures market. Energy (2022) 247:123471. doi:10.1016/j.energy.2022.123471
14. Xiao J, Zhong Y, Jia Y, Wang Y, Li R, Jiang X, et al. A novel deep ensemble model for imbalanced credit scoring in internet finance. Int J Forecast (2024) 40(1):348–72. doi:10.1016/j.ijforecast.2023.03.004
15. Bouri E, Lucey B, Saeed T, Vo XV. The realized volatility of commodity futures: interconnectedness and determinants. Int Rev Econ and Finance (2021) 73:139–51. doi:10.1016/j.iref.2021.01.006
16. Gong X, Xu J. Geopolitical risk and dynamic connectedness between commodity markets. Energy Econ (2022) 110:106028. doi:10.1016/j.eneco.2022.106028
17. Yang C, Niu Z, Gao W. The time-varying effects of trade policy uncertainty and geopolitical risks shocks on the commodity market prices: evidence from the tvp-var-sv approach. Resour Policy (2022) 76:102600. doi:10.1016/j.resourpol.2022.102600
18. Mensi W, Shafiullah M, Vo XV, Kang SH. Volatility spillovers between strategic commodity futures and stock markets and portfolio implications: evidence from developed and emerging economies. Resour Policy (2021) 71:102002. doi:10.1016/j.resourpol.2021.102002
19. Liu G, Zeng Q, Lei J. Dynamic risks from climate policy uncertainty: a case study for the natural gas market. Resour Policy (2022) 79:103014. doi:10.1016/j.resourpol.2022.103014
20. Zhang Y, Sun Y, Shi H, Ding S, Zhao Y. COVID-19, the Russia–Ukraine war and the connectedness between the US and Chinese agricultural futures markets. Humanities Social Sci Commun (2024) 11(1):477. doi:10.1057/s41599-024-02852-6
21. Ge J, Du AM, Lin B. “Volatility in a mug cup”: spillovers among cocoa, coffee, sugar futures and the role of climate policy risk. Res Int Business Finance (2025) 73:102634. doi:10.1016/j.ribaf.2024.102634
22. Ding S, Cui T, Zheng D, Du M. The effects of commodity financialization on commodity market volatility. Resour Policy (2021) 73:102220. doi:10.1016/j.resourpol.2021.102220
23. Salaudeen AA, Sathasivam S, Ali MKM, Abd Wahab NE. Forecasting sugar price fluctuation in Malaysia using geometric brownian motion modelling. J Sci Mathematics Lett (2023) 11(2):83–92. doi:10.37134/jsml.vol11.2.10.2023
24. Jati K. Sugar price analysis in Indonesia. Int J Social Sci Humanity (2013) 3(4):369–74. doi:10.7763/ijssh.2013.v3.264
25. Kotyza P, Czech K, Wielechowski M, Smutka L, Procházka P. Sugar prices vs. financial market uncertainty in the time of crisis: does COVID-19 induce structural changes in the relationship? Agriculture (2021) 11(2):93. doi:10.3390/agriculture11020093
26. Szajner P, Hryszko K. Cyclical fluctuations on the global sugar market in the context of the war in Ukraine. Eur Res Stud J (2024) 27:482–98. doi:10.35808/ersj/3451
27. Maitah M, Smutka L. The development of world sugar prices. Sugar Tech (2019) 21(1):1–8. doi:10.1007/s12355-018-0618-y
28. Godana AA, Ashebir YA, Yirtaw TG. Statistical analysis of domestic price volatility of sugar in Ethiopia. Am J Theor Appl Stat (2014) 3(6):177–83. doi:10.11648/j.ajtas.20140306.12
30. Lucey B, Ren B. Time-varying tail risk connectedness among sustainability-related products and fossil energy investments. Energy Econ (2023) 126:106812. doi:10.1016/j.eneco.2023.106812
31. Ren X, Li Y, Sun X, Bu R, Jawadi F. Modeling extreme risk spillovers between crude oil and Chinese energy futures markets. Energy Econ (2023) 126:107007. doi:10.1016/j.eneco.2023.107007
32. Lyu Y, Qin F, Ke R, Yang M, Chang J. Forecasting the var of the crude oil market: a combination of mixed data sampling and extreme value theory. Energy Econ (2024) 133:107500. doi:10.1016/j.eneco.2024.107500
33. Man Y, Zhang S, He Y. Dynamic risk spillover and hedging efficacy of China’s carbon-energy-finance markets: economic policy uncertainty and investor sentiment non-linear causal effects. Int Rev Econ Finance (2024) 93:1397–416. doi:10.1016/j.iref.2024.03.066
34. Almeida L. Risk and bankruptcy research: mapping the state of the art. J Risk Financial Management (2023) 16(8):361. doi:10.3390/jrfm16080361
35. Halbleib SM, Pohlmeier W, Prokhorov A, Rockinger M. Combining value-at-risk and expected shortfall forecasts using machine learning techniques. In: Advancing systematic and factor investing strategies using alternative data and machine learning (2021).
36. Pourfereidouni H, Hosseini-Nasab H. Pricing options based on volatility forecasting using a hybrid generalized autoregressive conditional heteroscedasticity model and long short-term memory with COVID-19. Int J Ind Eng Prod Res (2023) 34(2):185–199.
37. Li H, Wang R. Pelve: probability equivalent level of var and es. J Econom (2023) 234(1):353–70. doi:10.1016/j.jeconom.2021.12.012
38. Yao C-Z, Li M-J. Garch-midas-gas-copula model for covar and risk spillover in stock markets. North Am J Econ Finance (2023) 66:101910. doi:10.1016/j.najef.2023.101910
39. Su M, Nie Y, Li J, Yang L, Kim W. Futures markets and the baltic dry index: a prediction study based on deep learning. Res Int Business Finance (2024) 71:102447. doi:10.1016/j.ribaf.2024.102447
40. Ahmed S, Alshater MM, El Ammari A, Hammami H. Artificial intelligence and machine learning in finance: a bibliometric review. Res Int Business Finance (2022) 61:101646. doi:10.1016/j.ribaf.2022.101646
41. Zhu Y, Zhou L, Xie C, Wang G-J, Nguyen TV. Forecasting smes’ credit risk in supply chain finance with an enhanced hybrid ensemble machine learning approach. Int J Prod Econ (2019) 211:22–33. doi:10.1016/j.ijpe.2019.01.032
42. Gunnarsson E, Isern H, Kaloudis A, Risstad M, Vigdel B, Westgaard S. Prediction of realized volatility and implied volatility indices using ai and machine learning: a review. Int Rev Financial Anal (2024) 93:103221. doi:10.1016/j.irfa.2024.103221
43. Kwon TY. Feature importance in linear models with ensemble machine learning: a study of the fama and French five-factor model. Finance Res Lett (2025) 71:106406. doi:10.1016/j.frl.2024.106406
44. Nitsch F, Schimeczek C, Bertsch V. Applying machine learning to electricity price forecasting in simulated energy market scenarios. Energy Rep (2024) 12:5268–79. doi:10.1016/j.egyr.2024.11.013
Keywords: sugar futures, risk transmission, random forest, value at risk (VaR), machine learning
Citation: Qiu Z, Chen S, Feng Z, Luo R and Wang Z (2025) Machine learning-based dynamic risk measurement for white sugar futures under geopolitical risks. Front. Phys. 13:1674717. doi: 10.3389/fphy.2025.1674717
Received: 28 July 2025; Accepted: 13 October 2025;
Published: 25 November 2025.
Edited by:
Grigorios L. Kyriakopoulos, National Technical University of Athens, GreeceReviewed by:
Raul Matsushita, University of Brasilia, BrazilZhang Zhipeng, Tianjin Polytechnic University, China
Copyright © 2025 Qiu, Chen, Feng, Luo and Wang. This is an open-access article distributed under the terms of the Creative Commons Attribution License (CC BY). The use, distribution or reproduction in other forums is permitted, provided the original author(s) and the copyright owner(s) are credited and that the original publication in this journal is cited, in accordance with accepted academic practice. No use, distribution or reproduction is permitted which does not comply with these terms.
*Correspondence: Zhiwei Wang, d2FuZ3poaXdlaTkwMTEyM0BxcS5jb20=