- 1School of Electrical Engineering, Zhejiang University of Water Resources and Electric Power, Hangzhou, China
- 2Zhejiang-Belarus Joint Laboratory of Intelligent Equipment and System for Water Conservancy and Hydropower Safety Monitoring, Hangzhou, China
- 3School of Electrical and Control Engineering, North University of China, Taiyuan, China
In this work, a highly sensitive wavelength sensor based on a metal-insulator-metal (MIM) waveguide is presented to increase sensitivity and quality factor by optimizing critical structural factors that control sensing performance. The sensor utilizes a waveguide and a circular ring structure (DTRS) with disk and T-shaped cavities to excite the Fano resonance, and the refractive index is sensed at the nanoscale by detecting the resonance wavelength shift. By systematically investigating the coupling and correlation mechanism between device architecture and operating parameters on performance indexes, a full-parameter optimization strategy is adopted to establish the device configuration with the best performance. The sensitivity of the device can reach 2820 nm/RIU, and the FOM value can reach 60, which is of great value in the fields of biomolecule detection, environmental monitoring and chip integration.
1 Introduction
Compared to traditional electronic devices, photonic devices exhibit significant advantages in terms of speed and anti-interference capabilities, attracting increasing attention from researchers and achieving groundbreaking progress in both fundamental research and application development [1–3]. Optical sensors with high precision have revolutionized the field of sensing and measurement by providing novel solutions [4]. The interaction of electromagnetic waves with collective oscillations of free electrons on metal surfaces results in the formation of surface plasmon polaritons (SPPs), which are distinct electromagnetic modes localized at metal-dielectric interfaces [5–8]. These modes overcome the diffraction limit, confining light energy at subwavelength scales and propagating along interfaces, thereby enabling highly sensitive refractive index sensing [9]. Common excitation methods for SPPs include prism coupling, grating coupling, nanostructure excitation, and waveguide coupling. Among waveguide-coupled approaches, metal-insulator-metal (MIM) structures are considered a preferred choice for integrated photonic devices due to their facile fabrication and strong localized field enhancement [8, 10, 11]. Fano resonance, characterized by asymmetric peaks in transmission spectra, originates from the interference between continuous bright modes and discrete dark modes during SPP propagation [12, 13]. Its steep resonance edges exhibit exceptional sensitivity to minute perturbations, demonstrating high potential in nanophotonics and ultra-sensitive sensing applications [14]. Conventional photonic crystal sensors and fiber-optic sensors face challenges in device miniaturization, conflicting with the future development trends of integrated photonic systems. For dielectric photonic sensors such as silicon photonics and dielectric gratings, they typically feature low sensitivity and high FOM, offering higher resolution and ease of integration into SiP platforms. In contrast, the unique advantage of our proposed plasmonic-type sensor lies in its high sensitivity and surface plasmon resonance enhancement effect, making it suitable for scenarios demanding high sensitivity but lower resolution requirements [15–17]. In summary, SPP-based refractive index sensors offer distinct advantages including structural simplicity, easy integration, and compact footprint, positioning them as critical components for advancing integrated photonic circuits and on-chip optical systems [18–20].
Recent advances in MIM-based plasmonic sensors focus on optimizing resonant structures to enhance performance. For instance, Fano resonance enables high spectral contrast, while adjusting coupling strength between waveguides and resonators effectively narrows resonance linewidth. Furthermore, coupling between localized and propagating SPP modes amplifies field enhancement, enabling detection of low-concentration analytes. Collectively, these studies demonstrate the potential of MIM sensors while revealing the need for structures that simultaneously achieve high sensitivity and large FOM [21–25]. By connecting a waveguide to a rectangular cavity that has a metallic island implanted in it, Muhammad A. Butt suggested a plasmonic sensor that achieved a figure of merit (FOM) of 11.84 and a sensitivity of 900 nm/RIU [26]. Using an MIM waveguide-integrated ring resonator, N.L. Kazanskiy et al. created a plasmonic refractive index sensor that showed a sensitivity of 1155.71 nm/RIU and a FOM of 11.84 [27]. By combining graphene and iron, Yunping Qi et al. created a triple-ring nested resonator that achieved a peak FOM of 199.67 and a maximum sensitivity of 1266.67 nm/RIU [28].
Our study introduces a high-performance refractive index sensor with a novel arrangement, building on the MIM waveguide architecture. The disk T-ring resonator (DTRS) is the name given to the suggested construction, which is mostly made up of a waveguide connected to a ring resonator combined with a disk and T-shaped cavity. Compared to previous researchers’ proposals such as fence-type and ring-type structures, we integrate cavities to achieve multi-cavity cooperative coupling and phase modulation via T-shaped cavities, thereby suppressing stray modes. The structure gains enhanced robustness through multi-cavity compensation and exhibits greater tolerance to manufacturing errors. By methodically examining the inherent relationship between important structural elements and sensing performance, we were able to optimize sensitivity and figure of merit (FOM) in concert. Leveraging the Fano resonance mechanism, the sensor enables high-precision refractive index detection by precisely tracking the linear response between resonance wavelength shift (Δλ) and refractive index variation (Δn). Further analysis confirms the stable sensing characteristics of the designed resonator in practical scenarios. This study provides new insights for developing integrated refractive index sensing systems, demonstrating significant application potential in biomedical diagnostics and real-time environmental monitoring.
2 Materials and methods
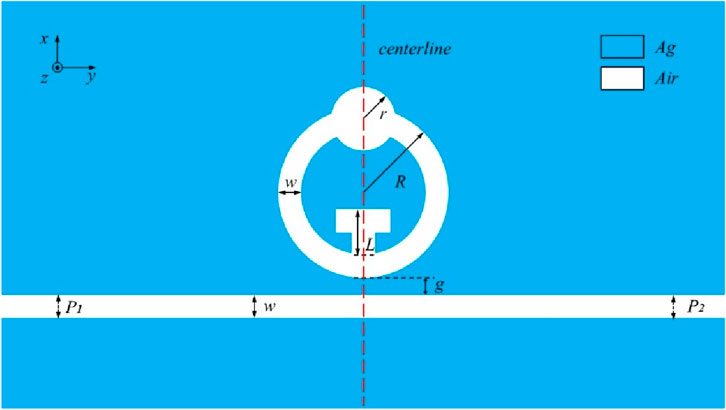
In our work, we constructed a physical field for the 2D model. For MIM waveguides supporting surface plasmon polaritons (SPPs), the electromagnetic field is strongly confined within the metal-dielectric interface, with variations along the out-of-plane (z) direction being negligible. This quasi-2D nature justifies our use of 2D simulations, which effectively capture the dominant in-plane mode interactions while avoiding computationally intensive 3D modeling. Figure 1 depicts a two-dimensional schematic of the planned structure, which includes a waveguide, ring, circle, and T-shaped cavity. The blue section signifies silver, while the white part represents air. The overall structure is symmetrical around the center line. The DTRS architecture features a concentric annular configuration where the outer radius (R) and inner radius maintain a fixed radial gap of 50 nm. Critical geometric parameters include the circular cavity radius (r) and the vertical extension (L) of the T-cavity. Waveguide-DTRS coupling is governed by separation distance g, with both waveguide cross-sections and ring elements sharing identical width specifications. Numerical modeling employs the finite element method (FEM) with advanced boundary treatment - perfectly matched layers (PMLs) positioned at computational domain boundaries to minimize electromagnetic wave reflections during transmission analysis.
In electromagnetic simulation of metallic structures, it is necessary to distinguish between different materials by characterizing their properties. In our work, silver is used as a metallic material, which can be represented using the Drude model [29–31]:
Here,
Structural resonance emerges under phase-matching fulfillment between wave propagation characteristics and cavity dimensions. Standing wave formalism dictates that the resonant wavelength (
The modal index m in this photonic configuration satisfies the quantization relationship m = 2L/λSPP, where L corresponds to the resonator’s axial interaction length. This surface plasmon wavelength λSPP is governed by the equation λSPP = λ0/Re(neff), with Re(neff) representing the electromagnetic confinement strength in the dielectric-metal interface system. The reflection phase term ϕref encapsulates the plasmonic wave’s coherent phase accumulation during metal-cavity boundary interactions.
For photonic biosensor characterization, two principal performance indicators are operationally defined in nanophotonics research. It is primarily given by Equations 4, 5 [35]:
The differential parameters Δλ and Δn respectively quantify the resonant wavelength shift arising from refractive index perturbations. The spectral resolution metric FWHM (full width at half maximum) is determined by measuring the resonance peak’s intensity profile at 50% of its maximum amplitude magnitude.
Where ∆λ and ∆n denote the change in resonance wavelength and the change in refractive index, respectively. FWHM is the full width at half maximum of the resonance peak.
Utilizing the finite element technique (FEM), the electromagnetic field of the sensor model is simulated and examined based on the geometric model that has been developed. Based on COMSOL Multiphysics 5.4 simulation platform, the waveguide geometry is first constructed and the material parameters and boundary conditions are set according to the theoretical model. In the simulation, the light wave is incident from the P1 port (TE mode), and is transmitted through the waveguide and output from the P2 port. In order to eliminate the influence of boundary reflection on the calculation accuracy, a perfect matching layer (PML) is set at the periphery of the calculation domain, which can effectively absorb the scattered wave energy. The coupling spacing is optimized by parametric scanning, and finally a stable and converged solution of the field distribution is obtained.
3 Simulations and results
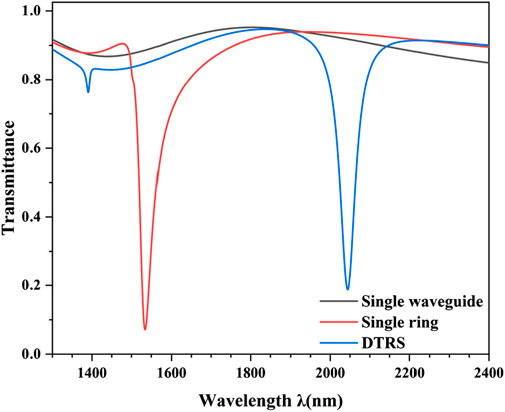
This section initially examines the structure’s Fano resonance generating process before delving into the transmission performance. The planned structure’s initial setup parameters are R = 200 nm, r = 80 nm, g = 10 nm, and L = 110 nm. Next, the waveguide’s transmission spectra, the Figure 2 illustrates the sequential investigation of the waveguide connected to the monocyclic ring and the overall framework. It is apparent in the picture that the transmission curve has a high transmittance and generates a broad continuous spectrum state in the transmission spectrum of just the waveguide (black curve). At λ = 1534 nm, a resonance notch forms in the transmission spectrum of the waveguide linked with a single circular ring (red curve), which may be thought of as a narrow discrete spectral state. At λ = 2044 nm, a characteristic Fano line shape, a prominent resonant notch forms in the transmission spectrum of the entire structure, signifying the presence of a Fano resonance. The interplay within the narrow discrete state produced by the DTRS and the wide constant state produced by the waveguide results in the Fano notch. In addition, comparing the transmission spectra of the two structures reveals that the overall structure’s curve shifts to the right (redshift) relative to the single-ring structure. The DTRS structure exhibits sensitivity, FWHM, and FOM of 2820 nm/RIU, 47 nm, and 60, respectively. The single-ring structure exhibits sensitivity, FWHM, and FOM of 1540 nm/RIU, 46 nm, and 33.48, respectively. This indicates that combining the two cavities alters device performance, providing crucial guidance for achieving superior performance parameters.
In order to better understand this occurrence, we examined the pattern of magnetic field distribution maps at the resonant cepoint for both the whole design structure and only the single circular structure. The magnetic field map at the non-resonance point is depicted in Figure 3C, whereas the magnetic field distribution at the resonance point is shown in Figures 3A,B below. According to Figures 3A,B, the trough appears from the perspective of the physical field because at the resonance depression (resonance point), a significant amount of energy is concentrated in the ring and little energy is inside the waveguide. This results in a low transmittance of the transmission spectrum. Observation of the scale of the magnetic field strength shows that the strength of Figure 3A is higher than that of Figure 3B, making the energy in the waveguide of Figure 3A weaker than that of Figure 3B, explaining the lower transmittance at the resonance point of Figure 3A. The resonance point of both structures can be found in the second-order resonance mode in the magnetic field diagram. The upper part of the magnetic field is in positive phase and the lower part is in anti-phase in the single-ring structure, while the upper part is in anti-phase and the lower part is in positive phase in the monolithic structure, and the interaction between the positive phase and the anti-phase also affects the Fano resonance properties. In conclusion, the degree of localization of the optical field within the structure and the energy distribution directly affect the strength of the interaction between light and the substance to be measured, which in turn determines the spectral response characteristics.
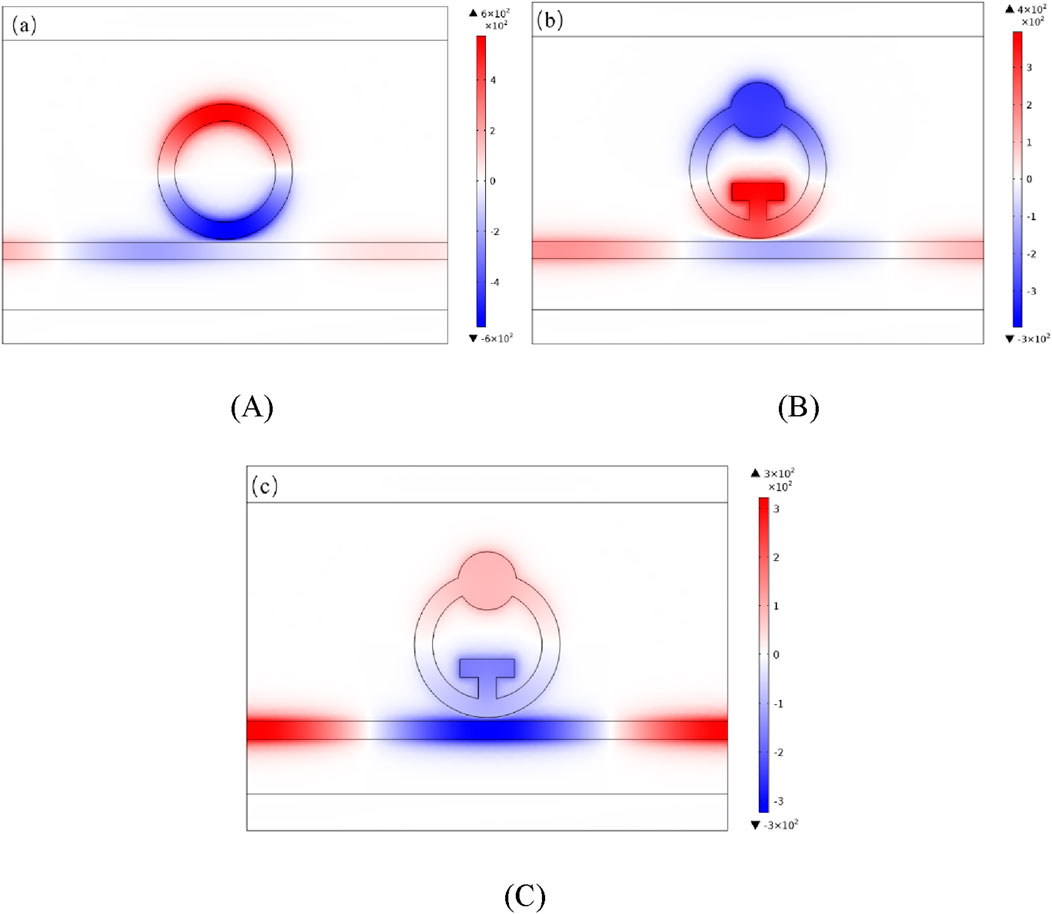
Figure 3. (A) Diagram of single circular structure magnetic field at resonance (λ = 1534 nm); (B) Diagram of the DTRS magnetic field at resonance (λ = 2044 nm); (C) Diagram of the DTRS magnetic field at the non-resonant location.
In the previous discussion, the Fano resonance reasons for designing the structure and the basic transmission characteristics of the structure were presented. In this section, we will continue to investigate the effects of other factors in the structure on the transmission characteristics. First, the coupling distance g = 10 nm, the T-shaped cavity length L = 110 nm, and the disk cavity radius r = 80 nm of the structure are set to investigate the effect of the outer radius R of the DTRS on the sensing performance of the structure. The outer radius R was set to 190 nm, 200 nm, 210 nm, 220 nm, and 230 nm sequentially. The transmission spectra are displayed at various DTRS outer radius R in Figure 4A. Setting the outer radius R to 20 nm was done. The resonance point exhibits a notable red shift with increasing radius of R. This is because an increase in R lengthens the DTRS resonator’s effective length. According to Equation 1, the resonance curve redshifts as the effective length increases. At the same time, the transmittance at the resonance point increases with the length The fitted sensitivity curve at the resonance point is displayed in Figure 4B. As the parameter R is increased from 2540 nm/RIU to 3280 nm/RIU, it is evident that the sensitivity at the curve’s resonant inclination grows quickly, which significantly affects the sensitivity. As a result, one crucial parameter for modifying this structure’s sensitivity index is R. The size of R cannot be arbitrarily raised to enhance the sensitivity, though, since Figure 4C shows that increasing the radius length also increases the half-width, which lowers the FOM.
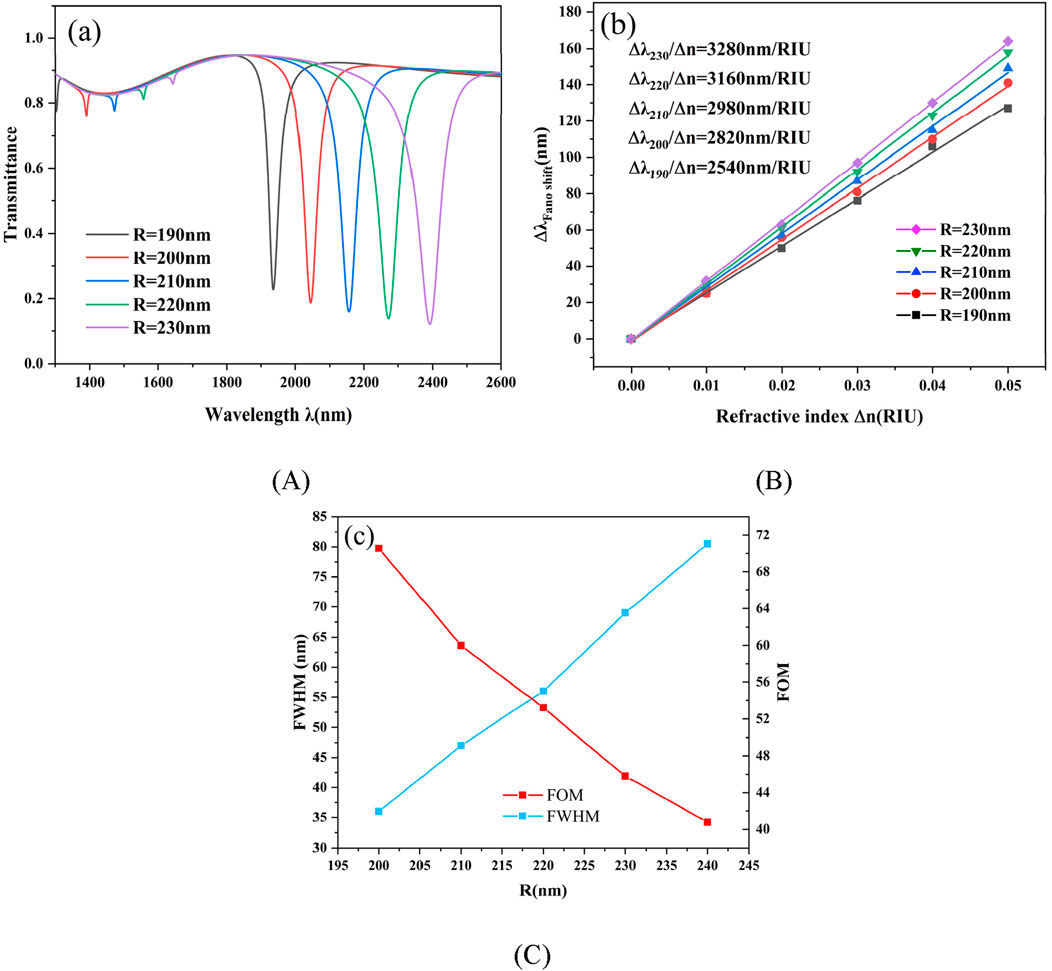
Figure 4. (A) The corresponding transmission spectra with varying parameter R; (B) The curve for sensitivity fitting that reflects R; (C) FWHM and FOM of R.
Secondly, the effect of the radius r of the disk-shaped cavity on the sensing performance of the structure was investigated. The outer radius R, the coupling distance g and the T-shaped cavity length L of the structure were kept consistent with the initially set values. The radius r of the disk-shaped cavity was set to be 60 nm, 70 nm, 80 nm, 90 nm, and 100 nm in turn. Figure 5A shows the transmission spectra at different radius r sizes. From the figure, it can be seen that the resonance concave point is shifted to the right. The transmittance of the resonance point decreases with the increase of r value. The overall sensitivity also increases gradually, similar to the effect of changing R. However, from Figure 5B, it can be found that its effect on the sensitivity is slightly weaker than the effect of R on the sensitivity. Observing the trends of the two curves in Figure 5C, as r increases, the FOM data decreases. Therefore, adjusting the size of the disc cavity can make it possible to further increase the sensitivity on the basis of adjusting R and optimize the device performance.
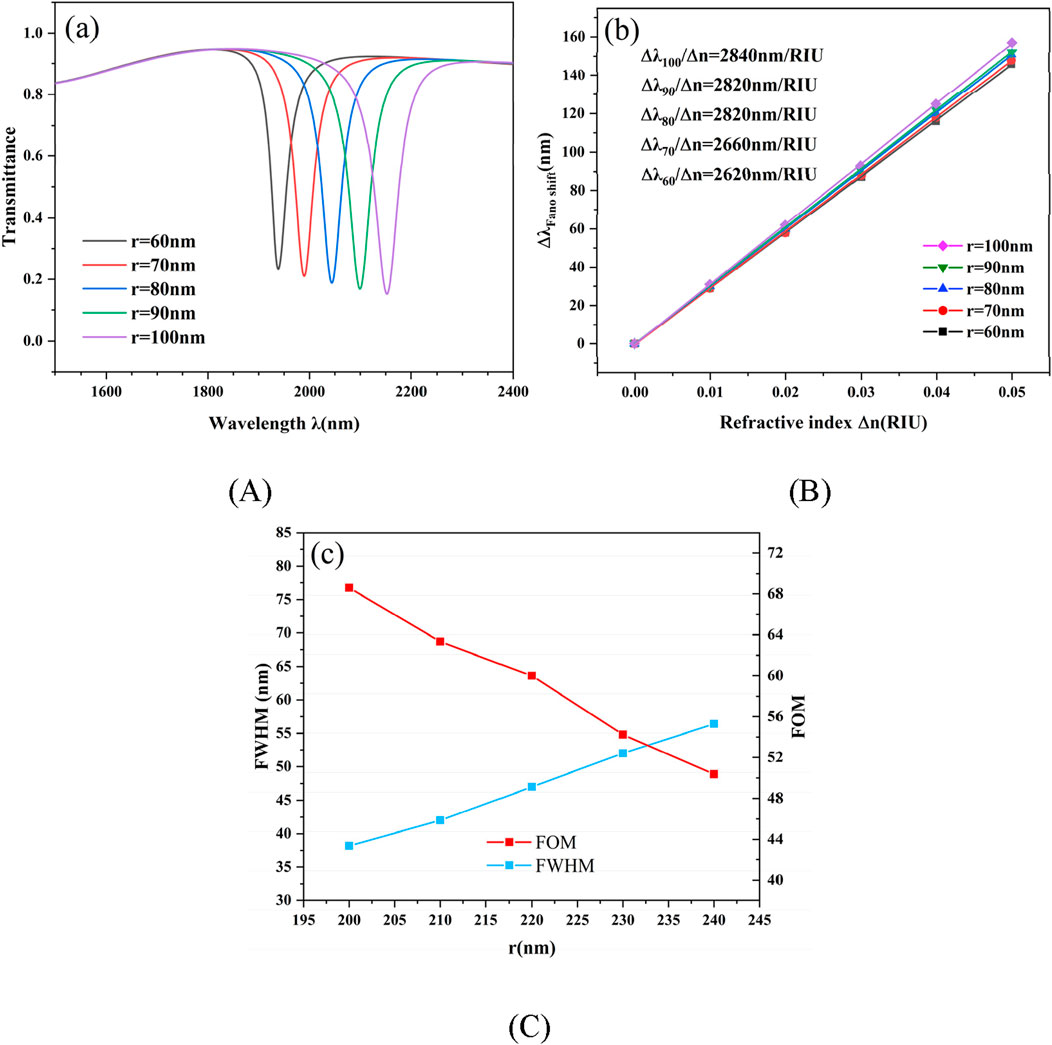
Figure 5. (A) The corresponding transmission spectra with varying parameter r; (B) The curve for sensitivity fitting that reflects r; (C) FWHM and FOM of r.
The impact of coupling distance g on device performance is then examined. The initial configurations for the structure’s outer radius (R), the T-shaped cavity’s length (L), and the disk-shaped cavity’s radius (r) were maintained. 5, 10, 15, 20 and 25 nm are the corresponding values for the coupling distance g. The transmission spectra are shown at various coupling distances g in Figure 6A. The values for the coupling distance g are 5 nm, 10 nm, 15 nm, 20 nm, and 25 nm. A little blue shift in the resonance inclination is observed as the coupling distance g rises. Furthermore, the transmittance of the structure’s resonant dip rises quickly as the coupling distance grows. This is because the increase in coupling distance makes it difficult to couple the SPPs of the waveguide into the DTRS, and the magnitude of the transmittance will affect whether the resonant tilt is suitable for the transmission point of the sensor. Figure 6B illustrates the effect of varying the coupling distance g on sensitivity, where a shorter distance results in increased sensitivity. Furthermore, when the coupling distance grows, the resonant tilt angle’s FWHM value rapidly drops. The trend of the FWHM value is seen in Figure 6C. The structure’s quality factor can be raised by lowering this number. At varying coupling distances, however, the sensitivity of the resonant inclination angle remains relatively constant. Thus, the balance between transmittance and half-width should be taken into account while determining the coupling distance value. An appropriate coupling distance is critical to the device’s functionality. The coupling distance g = 10 nm is appropriate for this structure after careful evaluation.
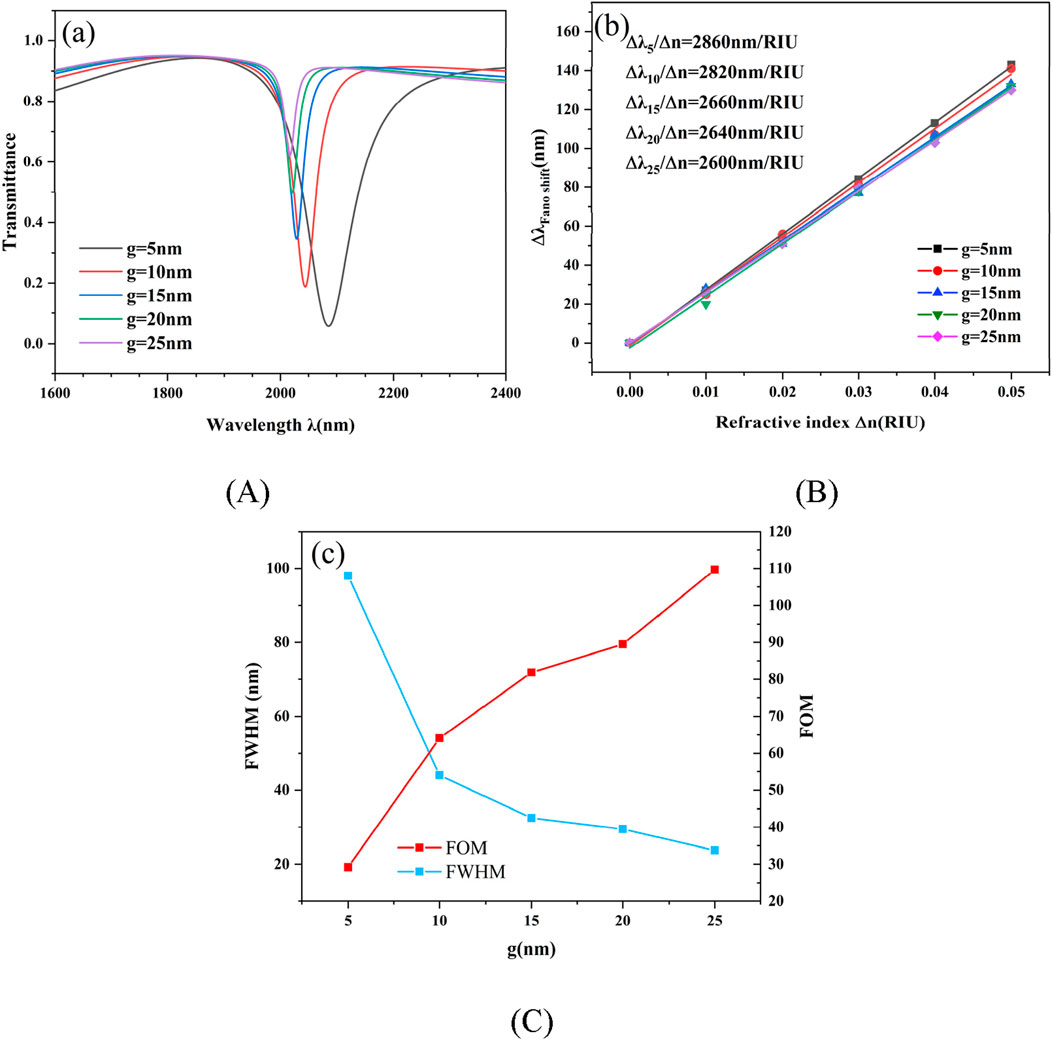
Figure 6. (A) The corresponding transmission spectra with varying parameter g; (B) The curve for sensitivity fitting that reflects g; (C) FWHM and FOM of g.
Last but not least, research must be done on how the T-shaped structure’s length L affects overall performance. The settings of the remaining parameters are kept the same as the previous settings. The length L was set to 100 nm, 110 nm, 120 nm, 130 nm, and 140 nm. Figure 7A shows the transmission spectrum after varying the length of L. The increase in L results in a red-shift of the curve and a slight increase in resonance inclination transmittance. Figure 7B shows the enhancement of the device sensitivity from 2640 nm/RIU to 2920 nm/RIU. As shown in Figure 7C, the FWHM value and the FOM of the device remain essentially unchanged. The length L of the T-cavity structure enables the device to increase the sensitivity while maintaining a stable FOM. As a result, the L value’s magnitude is the crucial factor in improving the device’s performance.
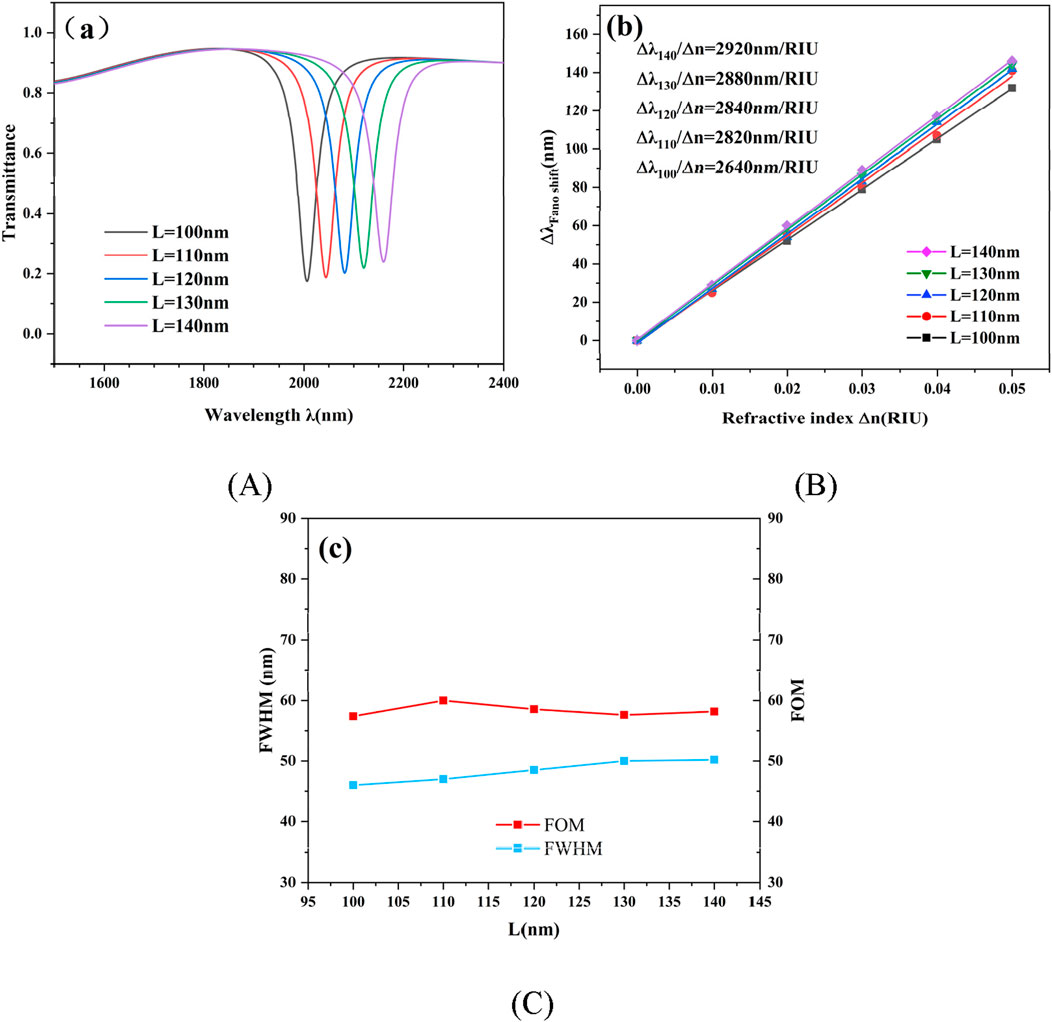
Figure 7. (A) The corresponding transmission spectra with varying parameter L; (B) The curve for sensitivity fitting that reflects L; (C) FWHM and FOM of L.
By studying parameter variations, we gain insights into achieving superior sensor performance. Regarding sensitivity, the ring cavity R, disk cavity r, coupling distance g, and T-shaped cavity L exhibit sensitivity to parameter changes of 18.5 RIU−1, 5.5 RIU−1, 13 RIU−1, and 7 RIU−1, respectively. R and g exert the most significant influence on sensitivity, collectively forming the core control parameters for sensitivity optimization. Meanwhile, r and L regulate mode confinement and linewidth, thereby aiding in enhancing the FOM. Our parameter optimization is grounded in the physical mechanism analysis of Fano resonance, rather than blindly scanning the design space. According to Fano resonance theory, destructive interference between narrowband “dark” modes and broadband “bright” modes generates sharp, asymmetric resonance lines. This interference induces extremely steep spectral slopes and intense localized field enhancement, significantly amplifying the response to minute changes in the ambient refractive index. More specifically, Fano resonance exhibits ultra-narrow linewidths, enabling exceptionally high sensitivity and figure-of-merit (FOM) even when spectral shifts are induced by minute refractive index variations. Leveraging this property, we strategically adjusted structural geometric parameters to align the resonant wavelengths of bright and dark modes while amplifying their interference effects, thereby achieving optimized designs.
4 Application
The refractive index of liquids may be measured using the framework created in this paper. It will be used in our study to test the sucrose solution’s concentration. It is possible to quantify the concentration of a solution by detecting the refractive index, which increases or decreases with solution concentration. Equation 6 provides the linear relationship between refractive index n and concentration C:
Thus the refractive indices corresponding to the concentration can be obtained as 1.318, 1.326, 1.334, 1.342, 1.350. The transmission spectra at the change of refractive index are shown in Figure 8A. It is evident that when the refractive index rises, the resonance point exhibits a definite linear red shift. Consequently, by observing the shift in the resonance point, the ambient refractive index may be determined. As seen in Figure 8B, a linear fit to the structure’s sensitivity was carried out. The sensor’s sensitivity to sucrose solution is 5.4 nm/%, it may be deduced.
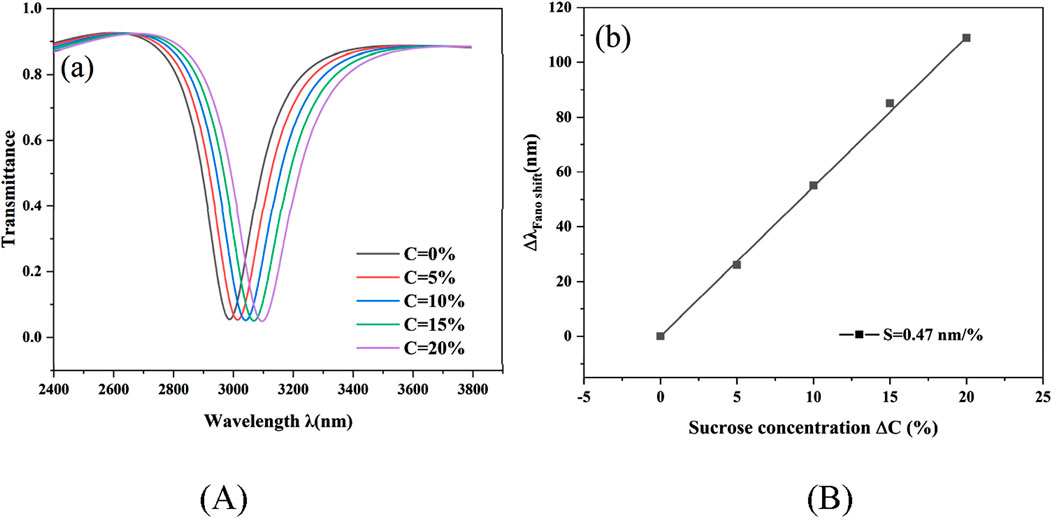
Figure 8. (A) The corresponding transmission spectra with varying concentration C; (B) The sensitivity fitting curve corresponding to C.
To assess the feasibility of this device for practical biochemical measurements, the minimum detectable concentration must be estimated under a given sensitivity S. Equation 7 provides the definition of feasibility:
where σ denotes the standard deviation of the measured resonance peak wavelength position under no-sample or baseline conditions. Taking the sensitivity S = 5.4 nm/% measured in this work for sucrose testing as an example, under the accuracy of common benchtop spectral tracking systems, the typical short-term noise σ = 0.05 nm for peak position tracking results in a theoretical LOD ≈0.028% (mass fraction), corresponding to a refractive index change of approximately Δn≈4.6 × 10⁻⁵. In practical research, noise can be suppressed through techniques such as employing narrow-linewidth stable light sources, temperature compensation, and signal averaging. This paper selected a coupling gap of g = 10 nm during parameter optimization to achieve excellent spectral characteristics and FOM. However, maintaining consistency in such gaps during actual fabrication poses significant challenges. Currently, electron beam lithography and focused ion beam techniques at the electron microscope level can achieve sub-10 nm gap patterning within limited processing areas. However, engineering bottlenecks exist in roughness control, and material damage may be introduced, potentially increasing damping and reducing device quality factors. Due to limitations in nanomanufacturing technologies, the performance of actual sensors may differ from simulation results. Nevertheless, as nanomanufacturing techniques advance, this discrepancy will gradually diminish [36, 37].
The sensor developed based on the DTRS structure can not only be applied to sucrose solution detection, but also accurately determine the concentration of sodium chloride solution, monitor glucose metabolism level, analyze glycerol purity, and detect serum protein content and other multi-dimensional detection scenarios. This multi-parameter detection capability makes it show significant practical value and market prospect in biochemical testing fields such as biomedical diagnosis, food safety monitoring and industrial process control.
5 Conclusion
In summary, we propose a nanostructured sensor consisting of a waveguide and DTRS. The interplay between the wide continuous states produced by the waveguide with stubs and the small discrete states produced by the DTRS cavity in various resonance modes is the first explanation of the generating process of the Fano resonance of the structure. A physical field model is used to describe the generating reason for Fano resonance. By examining the transmission spectra of various structures, the impact of structural design on device performance is investigated. Furthermore, the impact of structural geometrical factors on the performance of sensing is examined. Both R and r are significant characteristics that primarily modify the structure’s sensitivity performance; however, R’s impact on sensitivity is more significant. The coupling distance g has a great influence on the FWHM and transmittance. The larger the coupling distance is, the smaller the FWHM value is, but at the same time, the transmittance is also increased. After comprehensive consideration, g = 10 nm is a suitable parameter value for this structure. While the length L of the T-shaped cavity has less influence on the FWHM and FOM values of the structure, it has a certain adjustment effect on the transmittance and sensitivity of the resonant inclination. By modifying the various settings, the gadget may operate at its peak efficiency. It is shown that the device sensitivity can reach up to 2820 nm/RIU and the FOM value can reach up to 60 when the geometrical parameters are adjusted at R = 200 nm, r = 80 nm, g = 10 nm, and L = 110 nm. Finally, the structure may attain up to 1400 nm/RIU when applied to refractive index sensors, with a matching quality factor of 100 and a sensitivity of 100.
Data availability statement
The original contributions presented in the study are included in the article/supplementary material, further inquiries can be directed to the corresponding author.
Author contributions
SY: Writing – original draft, Writing – review and editing. WY: Writing – review and editing. CW: Writing – review and editing. ZY: Writing – review and editing. TW: Writing – review and editing.
Funding
The author(s) declare that financial support was received for the research and/or publication of this article. The work was supported in part by the National Natural Science Foundation of China under Grant No.62374148, in part by the Zhejiang Provincial Natural Science Foundation of China under Grant No. LD21F050001, the Key Research Project by Department of Water Resources of Zhejiang Province under Grant No. RA2101, the Key Research and Development Project of Zhejiang Province under Grant No. 2021C03019, and the Funds for Special Projects of the Central Government in Guidance of Local Science and Technology Development under Grant No. YDZJSX20231A031.
Acknowledgments
The authors are grateful to other colleagues in the laboratory for their understanding and help. They are also grateful to their affiliates for providing research platforms and to their sponsors for providing them with financial support.
Conflict of interest
The authors declare that the research was conducted in the absence of any commercial or financial relationships that could be construed as a potential conflict of interest.
Generative AI statement
The author(s) declare that no Generative AI was used in the creation of this manuscript.
Any alternative text (alt text) provided alongside figures in this article has been generated by Frontiers with the support of artificial intelligence and reasonable efforts have been made to ensure accuracy, including review by the authors wherever possible. If you identify any issues, please contact us.
Publisher’s note
All claims expressed in this article are solely those of the authors and do not necessarily represent those of their affiliated organizations, or those of the publisher, the editors and the reviewers. Any product that may be evaluated in this article, or claim that may be made by its manufacturer, is not guaranteed or endorsed by the publisher.
References
1. Ichizuka T, Ishigure T. Structural investigation of microchannel and optical waveguide Co-integrated sensor devices. IEEE CPMT Symp Jpn (Icsj) (2024) 156–7. doi:10.1109/ICSJ62869.2024.10804665
2. Mahmud RA, Sagor RH, Khan MZM. Surface plasmon refractive index biosensors: a review of optical fiber, multilayer 2D material and gratings, and MIM configurations. Opt and Laser Technology (2023) 159:108939. doi:10.1016/j.optlastec.2022.108939
3. Nalivaiko VI, Ponomareva MA. Optical grating waveguide sensors based оn chalcogenide glasses. Opt Spectrosc (2019) 126:439–42. doi:10.1134/S0030400X19040179
4. Al-mahmod MJ, Hyder R, Islam MZ. Numerical studies on a plasmonic temperature nanosensor based on a metal-insulator-metal ring resonator structure for optical integrated circuit applications. Photon Nanostructures - Fundamentals Appl (2017) 25:52–7. doi:10.1016/j.photonics.2017.05.001
5. Barnes WL, Dereux A, Ebbesen TW. Surface plasmon subwavelength optics. Nature (2003) 424:824–30. doi:10.1038/nature01937
6. Bozhevolnyi SI, Volkov VS, Devaux E, Laluet J-Y, Ebbesen TW. Channel plasmon subwavelength waveguide components including interferometers and ring resonators. Nature (2006) 440:508–11. doi:10.1038/nature04594
7. Quinten M, Leitner A, Krenn JR, Aussenegg FR. Electromagnetic energy transport via linear chains of silver nanoparticles. Opt Lett OL (1998) 23:1331–3. doi:10.1364/OL.23.001331
8. Zhang J, Zhang L, Xu W. Surface plasmon polaritons: physics and applications. J Phys D: Appl Phys (2012) 45:113001. doi:10.1088/0022-3727/45/11/113001
9. Almawgani AHM, Taya SA, Doghmosh N, Pal A, Alkanoo AAM, Alhawari ARH, et al. A photonic crystal based on porous silicon as a chemical sensor for the detection of methanol compound. Indian J Phys (2023) 97:3643–52. doi:10.1007/s12648-023-02665-4
10. Aftab M, Mansha MS, Iqbal T, Farooq M. Surface plasmon excitation: theory, configurations, and applications. Plasmonics (2024) 19:1701–19. doi:10.1007/s11468-023-02095-2
11. Pitarke JM, Silkin VM, Chulkov EV, Echenique PM. Theory of surface plasmons and surface-plasmon polaritons. Rep Prog Phys (2006) 70:1–87. doi:10.1088/0034-4885/70/1/R01
12. Luk’yanchuk B, Zheludev NI, Maier SA, Halas NJ, Nordlander P, Giessen H, et al. The Fano resonance in plasmonic nanostructures and metamaterials. Nat Mater (2010) 9:707–15. doi:10.1038/nmat2810
13. Artar A, Yanik AA, Altug H. Directional double fano resonances in plasmonic hetero-oligomers. Nano Lett (2011) 11:3694–700. doi:10.1021/nl201677h
14. Li S, Zhang Y, Song X, Wang Y, Yu L. Tunable triple fano resonances based on multimode interference in coupled plasmonic resonator system. Opt Express, OE (2016) 24:15351–61. doi:10.1364/OE.24.015351
15. Luan E, Shoman H, Ratner DM, Cheung KC, Chrostowski L. Silicon photonic biosensors using label-free detection. Sensors (2018) 18:3519. doi:10.3390/s18103519
16. Puumala LS, Grist SM, Wickremasinghe K, Al-Qadasi MA, Chowdhury SJ, Liu Y, et al. An optimization framework for silicon photonic evanescent-field biosensors using sub-wavelength gratings. Biosensors (2022) 12:840. doi:10.3390/bios12100840
17. Toma AD, Brunetti G, Colapietro P, Ciminelli C. High-resolved near-field sensing by means of dielectric grating with a box-like resonance shape. IEEE Sensors J (2024) 24:6045–53. doi:10.1109/JSEN.2024.3349948
18. Ebadi SM, Örtegren J, Bayati MS, Ram SB. A multipurpose and highly-compact plasmonic filter based on metal-insulator-metal waveguides. IEEE Photon J (2020) 12:1–9. doi:10.1109/JPHOT.2020.2974959
19. Pinton N, Grant J, Collins S, Cumming DRS. Exploitation of magnetic dipole resonances in metal–insulator–metal plasmonic nanostructures to selectively filter visible light. ACS Photon (2018) 5:1250–61. doi:10.1021/acsphotonics.7b00959
20. Bensalah H, Hocini A, Bahri H, Khedrouche D, Ingebrandt S, Pachauri V. A plasmonic refractive index sensor with high sensitivity and its application for temperature and detection of biomolecules. J Opt (2023) 52:1035–46. doi:10.1007/s12596-022-00922-z
21. Lai W, Wen K, Lin J, Guo Z, Hu Q, Fang Y. Plasmonic filter and sensor based on a subwavelength end-coupled hexagonal resonator. Appl Opt AO (2018) 57:6369–74. doi:10.1364/AO.57.006369
22. Wang Z, Zhang M, Wang J, Lu F, Li K, Xu A. Unidirectional launching of surface plasmons with subwavelength metallic gratings around the plasmonic critical angle. Appl Phys Lett (2012) 101:061107. doi:10.1063/1.4745919
23. Shi X, Ma L, Zhang Z, Tang Y, Zhang Y, Han J, et al. Dual fano resonance control and refractive index sensors based on a plasmonic waveguide-coupled resonator system. Opt Commun (2018) 427:326–30. doi:10.1016/j.optcom.2018.06.042
24. Wang Q, Ouyang Z, Sun Y, Lin M, Liu Q, Zheng G, et al. Tunable nanosensor based on fano resonances created by changing the deviation angle of the metal core in a plasmonic cavity. Sensors (2018) 18:1026. doi:10.3390/s18041026
25. Yan X, Wang T, Han X, Xiao S, Zhu Y, Wang Y. High sensitivity nanoplasmonic sensor based on plasmon-induced transparency in a graphene nanoribbon waveguide coupled with detuned graphene square-nanoring resonators. Plasmonics (2017) 12:1449–55. doi:10.1007/s11468-016-0405-0
26. Butt MA. Numerical assessment of a metal-insulator-metal waveguide-based plasmonic sensor system for the recognition of tuberculosis in blood plasma. Micromachines (2023) 14:729. doi:10.3390/mi14040729
27. Kazanskiy NL, Butt MA, Khonina SN. Silicon-tapered waveguide for mode conversion in metal–insulator–metal waveguide-based plasmonic sensor for refractive index sensing. Appl Opt AO (2023) 62:8678–85. doi:10.1364/AO.507402
28. Qi Y, Wu Q, Su M, Li H, Wang X. MIM waveguide refractive index sensor with graphene enhanced three-ring nested resonator fano resonance. Phys Scr (2024) 99:075525. doi:10.1088/1402-4896/ad514b
29. Liu N, Langguth L, Weiss T, Kästel J, Fleischhauer M, Pfau T, et al. Plasmonic analogue of electromagnetically induced transparency at the drude damping limit. Nat Mater (2009) 8:758–62. doi:10.1038/nmat2495
30. Amiri FA, Yaghoubi E, Yaghoubi E. Triple-channel glasses-shape nanoplasmonic demultiplexer based on multi nanodisk resonators in MIM waveguide. Optik (2021) 237:166697. doi:10.1016/j.ijleo.2021.166697
31. Zhang J, Feng H, Gao Y. Plasmonic narrowband filter based on an equilateral triangular resonator with a silver bar. Photonics (2021) 8:244. doi:10.3390/photonics8070244
32. Rakic AD, Djurisic AB, Elazar JM, Majewski ML. Optical properties of metallic films for vertical-cavity optoelectronic devices. Appl Opt (1998) 37:5271–83. doi:10.1364/ao.37.005271
33. Zhang JWX, Zhu J, Chen T, Zhang L, Yang H, Tang C, et al. Metal–insulator–metal waveguide structure coupled with T-type and ring resonators for independent and tunable multiple fano resonance and refractive index sensing. Opt Commun (2023) 528:128993. doi:10.1016/j.optcom.2022.128993
34. Zhang J, Feng H, Ran L, Gao Y. Theoretical design and analysis of multichannel plasmonic switch based on triangle resonator combined with silver bar. Opt Commun (2022) 520:128437. doi:10.1016/j.optcom.2022.128437
35. Zhang X, Shao M, Zeng X. High quality plasmonic sensors based on fano resonances created through cascading double asymmetric cavities. Sensors (2016) 16:1730. doi:10.3390/s16101730
36. Bensalah H, Hocini A, Bahri H. Design and analysis of a mid-infrared ultra-high sensitive sensor based on metal-insulator-metal structure and its application for temperature and detection of glucose. Prog In Electromagnetics Res M (2022) 112:81–91. doi:10.2528/PIERM22032604
Keywords: metal-insulator-metal waveguide, Fano resonance, DTRS, refractive index sensing, sensitivity optimization
Citation: Yan S, Yang W, Wang C, Yan Z and Wu T (2025) A novel surface plasmon-based sensor for liquid refractive index measurement with biochemical sensing capabilities. Front. Phys. 13:1676348. doi: 10.3389/fphy.2025.1676348
Received: 30 July 2025; Accepted: 03 October 2025;
Published: 15 October 2025.
Edited by:
Yaping Dan, Shanghai Jiao Tong University, ChinaReviewed by:
Giuseppe Brunetti, Politecnico di Bari, ItalyHocine Ben Salah, University of Medea, Algeria
Copyright © 2025 Yan, Yang, Wang, Yan and Wu. This is an open-access article distributed under the terms of the Creative Commons Attribution License (CC BY). The use, distribution or reproduction in other forums is permitted, provided the original author(s) and the copyright owner(s) are credited and that the original publication in this journal is cited, in accordance with accepted academic practice. No use, distribution or reproduction is permitted which does not comply with these terms.
*Correspondence: Shubin Yan, eWFuc2hiQHpqd2V1LmVkdS5jbg==
 Shubin Yan
 Weijie Yang1,2,3