 Zijie He1,2
 Yutao Zhang
 Qingxiang Meng
- 1Key Laboratory of Ministry of Education for Geomechanics and Embankment Engineering, Hohai University, Nanjing, Jiangsu, China
- 2Research Institute of Geotechnical Engineering, Hohai University, Nanjing, Jiangsu, China
- 3Kunming Engineering Co. Ltd., Power Construction Corporation, Kunming, Yunnan, China
- 4Department of Civil and Environmental Engineering, University of California, Berkeley, Berkeley, CA, United States
The microstructure of geomaterials plays a crucial role in determining their physical and mechanical properties. The complex mechanical behavior of certain coarse-grained geomaterials significantly affects their resistance to deformation, making an accurate characterization of their internal structure essential. However, obtaining core samples of such materials is often costly and labor-intensive, whereas acquiring two-dimensional (2D) structural information is more feasible. This study presents a microstructure reconstruction technique based on a differentiable optimization framework, wherein the reconstruction process minimizes the error of a given descriptor while considering its derivative. The proposed method enables reconstruction using either a single 2D slice or three orthogonal 2D slices. Furthermore, the effectiveness of the 2D-to-3D reconstruction is validated through actual computed tomography (CT) scans of coarse-grained geomaterial samples collected from the Xinjiang region.
1 Introduction
Geomaterials are porous media whose networks differ in porosity, pore-size distribution, and geometry. Pore-scale modelling clarifies internal stress and strain fields, underpinning predictions of bulk behavior, yet linking these models to measurable physical and mechanical properties remains a key challenge in rock mechanics. Core samples—our most direct record of the subsurface—supply essential data on grain size, depositional fabric, and pore characteristics.
There are two common methods for constructing three-dimensional digital rock cores: expensive X-ray CT experiments [1, 2] and reconstruction from two-dimensional images. Reconstruction algorithms are further divided into random methods, process-based methods, and others [3]. Over the decades, several reconstruction algorithms have been proposed. A comprehensive review is provided in Ref. [4, 5]. The following provides a brief introduction, distinguishing between classical stochastic and novel machine learning approaches.
Microstructure rebuilding is regarded as a best-fit problem in stochastic approaches. They work on a middle microstructure until the descriptor gets the needed value. The Yeong-Torquato algorithm [6] pioneered these methods, which contained the random search “simulated annealing” to microstructures with the right phase volume amounts. This range has produced Yeong-Torquato versions based on n-point correlation functions [7], physical descriptors [8], Gaussian random field [9] plus more. The big problem with the Yeong-Torquato algorithm is that it costs too much computer time. The computational cost grows as microstructure resolution and accuracy increase.
Machine learning has inspired researchers to address computational cost issues through a shift to data-driven approaches. Proposed solutions vary widely, including non-parametric resampling [10], convolutional neural networks (CNNs) [11], variational autoencoder [12], and generative adversarial networks [13]. However, they all require an initial learning or training phase with a potentially large training dataset. They share a common shortcoming: the descriptor is not user-prescribed but learned from data during (pre-) training as an internal latent representation, which cannot be prescribed or directly interpreted [14]. For example, machine learning approaches cannot yet reconstruct from a given two-point correlation value, only from coordinates in their internal latent space. This inherent coupling between the (pre-) training dataset, the resultant latent space replacing the descriptor, and the reconstruction algorithm constitutes an impediment [15]. Field scale risks further motivate accurate microstructure informed analyses, from excavation induced deformation to karst water inrush thickness criteria [16, 17]. Recent advances fuse hard and soft data for subsurface characterization and apply three-dimensional vision at the material scale to enrich descriptors [18, 19].
We present a gradient-based, higher-order optimization framework that reconstructs random heterogeneous media from user-specified, differentiable microstructural descriptors. Making the descriptors differentiable greatly accelerates convergence, reducing computational cost by ∼10× at 643 and ∼20–40× at 2563 (extrapolated >70× near 5123) at comparable accuracy relative to the classical Yeong-Torquato algorithm.
2 Methods
We numerically validate 2D-to-3D microstructure reconstruction by extracting a random slice from a 3D reference medium and treating it as the sole 2D input. Two reconstructions are produced—one with the classical Yeong-Torquato (YT) algorithm and the other with a gradient-based scheme that uses differentiable microstructure descriptors derived from the slice—followed by Gaussian smoothing. Both 3D models are then subjected to FLAC3D simulations to compute shear strength, and the outcomes are benchmarked against laboratory data for coarse-grained geomaterials. The close agreement confirms that the differentiable-descriptor approach yields reliable and efficient 3D reconstructions.
2.1 Revisiting the Yeong-Torquato algorithm
The simulated annealing algorithm is a method for finding the best or almost best answer in a large set of answers [20]. It searches the set of answers with random picks and chance, and it takes worse answers sometimes so it does not get stuck with a local best answer. When the temperature parameter is slowly lowered, the algorithm picks better answers more often as it searches and finally finds a best answer or an almost best answer. In the Yeong-Torquato algorithm, microstructure reconstruction is formulated as a stochastic optimization problem:
where M represents a discrete two-phase microstructure with width
where D is obtained from a suitable characterization function, as defined in Equation 3:
Here, K is independent of
2.2 Differentiable microstructure reconstruction in 2D
Given the desired microstructure descriptor
where each pixel of the intermediate microstructure
where
The optimization problem in Equation 4 is solved iteratively. In each iteration, the microstructure
2.3 Slicing-based generalization to 3D
The microstructure is sliced along all three spatial directions to obtain stacks of 2D sections. The descriptor is then computed for each slice separately. Therefore, on each slice, the descriptor should closely match the desired 2D descriptor. Anisotropy can be considered in slices of different orientations, allowing for the specification of different descriptors. Thus, descriptors can be optimized by minimizing the loss function in Equation 7:
where
However, if isotropic materials are considered, Equation 6 can be simplified to:
In all reconstructions reported here we assume isotropy and use Equation 9; anisotropy is not enforced. Because the descriptor-matching objective is nonconvex, local minima may arise, especially when fine-scale interface details dominate. If encountered, it can be mitigated by a coarse to fine warm start with explicit phase-fraction feasibility, direction specific targets on the three orthogonal stacks, mild weight continuation with early stopping, and optional restarts to select the lowest-loss solution.
2.4 Microstructure characterization and reconstruction
2.4.1 Spatial correlations and gram matrices
Spatial n-point correlations describe the statistical relationships between quantities at different locations within a system. Consider a realization of a two-phase random heterogeneous material within d-dimensional Euclidean space
where
Spatial n-point correlations stochastically quantify the outcomes of probing the indicator function at multiple spatial locations (x1, x2., xn). For statistically homogeneous media, the n-point correlation function depends only on the relative displacements rij = xj − xi, not on the absolute positions [22]. Therefore, the n-point correlation function for phases
where the
Gram matrices offer a modern approach to characterizing microstructures by using the internal activations, or feature maps, of a pre-trained convolutional neural network (CNN) [23]. The activation of the pth channel in layer n at spatial position s is denoted as
2.4.2 Implementation of reconstruction algorithm based on differentiable descriptors
Microstructure Characterization and Reconstruction in Python (MCRpy) [24] is an open-source software tool. For a more recent example, using the Gram matrices G of the VGG-19 CNN feature maps as a descriptor for the same loss function results in the optimization problem stated in Equation 14:
where optimization is suitable for gradient-based methods.
The final approach chosen in this paper combines differentiable three-point correlations
where the optimization is performed using the gradient-based L-BFGS-B optimizer. In this paper, we use the method in Equation 15 for the 3D microstructural reconstruction of conglomerates.
The approach can degrade when the chosen descriptors are not representative, when features are thinner than a few voxels, or when admissible phase fractions approach 0 or 1; we counter this with directional, multiscale, per-phase descriptors, explicit phase-fraction constraints, and a coarse to fine warm start.
2.5 Data for validation
The samples for this study were collected from a coarse-grained conglomeratic formation in the Xinjiang region, each with dimensions of 50 mm × 100 mm. Although our experimental validation uses conglomeratic cores from the Xinjiang region, the reconstruction itself is descriptor-driven and material-agnostic. These samples underwent CT scanning. After reconstructing the CT images in three dimensions, slices were extracted. The slices from the 3D reconstruction were compressed to 128 × 128 pixels. This compression ensures that the reconstructed microstructures, with a resolution of 1283 voxels, are still large enough to accurately represent the morphology.
To enhance computational efficiency, MCRpy supports only. npy format files as input. Zhang et al. [25] demonstrated that the enhanced SegFormer neural network effectively converts CT scan images into grayscale and binary segmentation images for recognizing and classifying conglomerates within a coarse-grained geomaterial formation. Once the binary images are obtained, a simple Python script converts them to . npy files containing NumPy arrays of shape
3 Results
3.1 Reconstruction results
As shown in Equations 1, 2, microstructure reconstruction is essentially an optimization problem. A simple choice for the loss function L is a weighted sum of the mean squared error norm. In the Yeong-Torquato algorithm, the spatial two-point correlation
When simulated annealing is chosen as the optimizer, we solve the optimization in Equation 16, which effectively implements the Yeong-Torquato algorithm [26]. Despite using the total variation method [11, 21] to reduce noise in the reconstructed structure, it remains noticeably less smooth than the original. In this study, built-in Gaussian filters in MCRpy are used for smoothing.
MCRpy solves the optimization problem in Equation 13 by allowing the selection of a loss function type and providing a set of descriptors with corresponding weights. We adopt differentiable three-point correlations
In this study, experiments were conducted using a single RTX 3060 GPU. After applying Gaussian filters for smoothing, the three-dimensional microstructure reconstruction model of the coarse-grained conglomerate based on Yeong-Torquato algorithm and differentiable descriptors is shown in Figure 1.
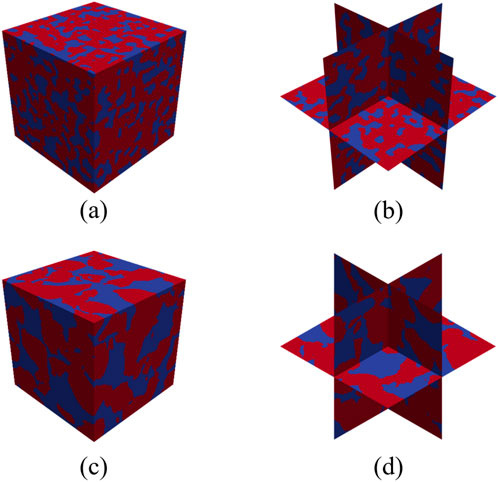
Figure 1. 3D reconstruction of the coarse-grained conglomerate core performed using (a,b) the Yeong-Torquato algorithm, and (c,d) differentiable descriptors.
3.2 Numerical computation of the original and reconstructed models
Finite difference method (FDM) was utilized to analyze the mechanical properties of reconstructed coarse-grained conglomerate models. This type of heterogeneous material consists gravel, matrix and cementing materials [27]. Due to the large strength contrast between gravel and the matrix, it can be approximated as bimrock [28]. The strain-softening Mohr-Coulomb model is used in numerical models. This model captures the strain-softening behavior of Xiyu conglomerate, in which numerical simulation results accurately match with physical experimental results [29].
To compare the accuracy of models established by four different 3D reconstruction methods and assess the impact of smoothing on experimental results, this study uses the Yeong-Torquato algorithm and differentiable microstructure descriptors to establish the YT and SGV models. Smoothing is applied to create the YT_smoothed and SGV_smoothed models. During reconstruction, descriptors on the orthogonal slices were computed with periodic wrap, whereas the mechanical validation used a nonperiodic block. Identical material properties were assigned to the four numerical models, and three dimensional triaxial compression tests were conducted in FLAC3D 7.0 with the bottom surface fully fixed, the lateral boundaries traction free, and a constant axial strain rate applied on the top face, corresponding to consolidated drained (CD) conditions. During these tests, confining pressures of 0.1 MPa, 0.2 MPa, 0.3 MPa, and 0.4 MPa were applied in the vertical and horizontal directions of the samples. We do not include simulations of permeability, elastic homogenization, fracture toughness, or alternative loading paths. The reconstruction preserves phase fractions, interfacial area from normalized total variation, and multiscale texture from Gram matrices, so comparable fidelity is expected for permeability, small strain moduli, and full stress and strain behavior.
Figure 2 shows the stress-strain curves from 3D triaxial tests conducted on the four different numerical models. By analyzing these relationships under four different confining pressures, the cohesion and internal friction angle were obtained. Mohr-Coulomb failure criterion was used to calculate the internal friction angle and cohesion of the digital core samples. The cohesion values obtained from triaxial tests are 0.366 MPa for the SGV model, 0.368 MPa for the SGV_smoothed model, 0.359 MPa for the YT model, and 0.343 MPa for the YT_smoothed model. The corresponding internal friction angles are 44.02°, 46.64°, 45.28°, and 45.53°, respectively.
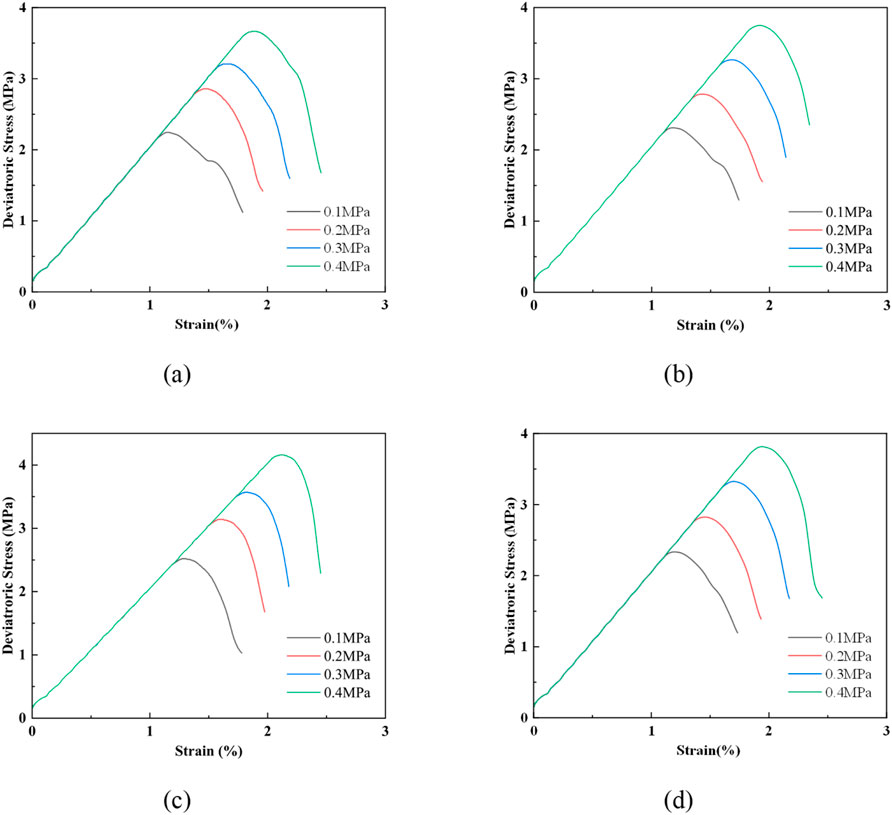
Figure 2. Stress-strain curves from numerical triaxial compression tests with confining pressures of 0.1 MPa, 0.2 MPa, 0.3 MPa, and 0.4 MPa. (a) SGV model; (b) SGV_smoothed model; (c) YT model; (d) YT_smoothed model.
Beyond cohesion and friction angle, we report higher-order, descriptor-level fidelity. For three-point correlations we use the normalized gap
3.3 Evaluation of reconstruction effectiveness based on two-point correlation function
In this study, we define the two-point correlation function
The two-point correlation function is usually two-dimensional, describing correlations between points in various directions. Radial averaging simplifies this to a one-dimensional function by averaging the correlation values at each radius, thus removing directional dependence and resulting in a function that depends only on the radius. The results show that reconstruction with differentiable descriptors outperforms the Yeong-Torquato algorithm.
4 Discussion
4.1 Effect of smoothing on the 3D model
Figure 3a shows that noise and fake sharp corners cause irregular meshing in the numerical simulation. This irregularity can affect numerical stability and accuracy. At sharp corners, the meshes are excessively refined and can cause numerical instability. This makes stress concentration in the model lower and increases the effective yield strength of the model.
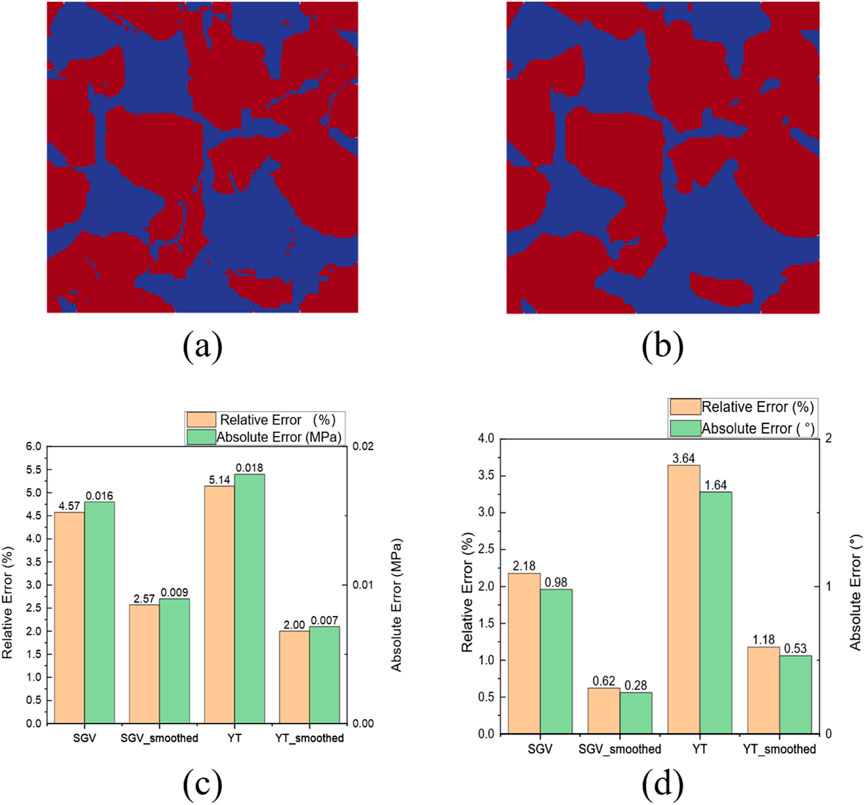
Figure 3. Model smoothing with Gaussian filtering: (a) Structure before smoothing, (b) Structure after smoothing. Comparative analysis of shear strength of the coarse-grained conglomerate from numerical simulations and physical experiments: (c) Cohesion, (d) Internal friction angle.
Gaussian filtering is a linear smoothing method used for image denoising [30]. Pixels near the central pixel get high weights and pixels far from the central pixel get low weights. Figure 3b shows that using the relevant functions significantly reduces noise and fixes sharp features in the model.
This study evaluates how Gaussian smoothing influences triaxial-test simulations by comparing digital cores reconstructed with differentiable microstructure descriptors (SGV) and with the Yeong-Torquato algorithm, each examined in both smoothed and unsmoothed form. Figures 3c,d presents absolute and relative errors in internal-friction angle and cohesion relative to laboratory measurements. Smoothing consistently narrows these discrepancies: for the SGV core, the absolute error in internal-friction angle falls from 0.016 MPa to 0.009 MPa, a reduction of 0.007 MPa, with similar improvements observed for the Yeong-Torquato core. After smoothing, both reconstructions predict internal-friction angle and cohesion within 3% of experimental values, confirming the accuracy gains afforded by the procedure. Beyond denoising, Gaussian smoothing acts as an interface-regularization step that reduces staircase artefacts and spurious stress raisers at sharp voxel corners. Such pre-simulative regularization is consistent with practices in dynamic rock-failure modeling and block-based discretizations, where jagged contacts can degrade stability and bias peak strength [31, 32]; studies on three-dimensional discontinuous deformation analysis of rockfalls emphasize precisely this sensitivity to contact geometry and mesh/block quality [33, 34].
4.2 Comparison of computational costs between two reconstruction algorithms
Unlike the Yeong-Torquato scheme, our reconstruction exploits gradient information, enabling continuous moves in microstructure space rather than the Yeong-Torquato algorithm’s random exchange of pixel pairs. Although gradient-based optimizers risk stalling in local minima or flat regions, this can be alleviated by suitable optimizer choices and feature functions that preserve non-zero gradients. Directly benchmarking the two methods is non-trivial—performance depends on platform, hyper-parameters, algorithmic variants, and target accuracy—but under identical GPU settings we measured the wall-clock time needed for each to recreate a 64 × 64-pixel checkerboard, highlighting the speed advantage of the differentiable approach. Both runs were stopped at the same target accuracy, measured as a composite normalized residual
As illustrated in Figure 4, the Yeong-Torquato algorithm identifies the checkerboard outline in 4 min and completes the reconstruction in approximately 8 min. Conversely, the reconstruction using differentiable descriptors, specifically correlations and Gram matrices, identifies the outline in about 15 s and finishes in 50 s. Although calculating gradients in differentiable microstructure reconstruction makes each iteration more computationally demanding than in the Yeong-Torquato algorithm, the overall computational cost of using differentiable descriptors is substantially lower.
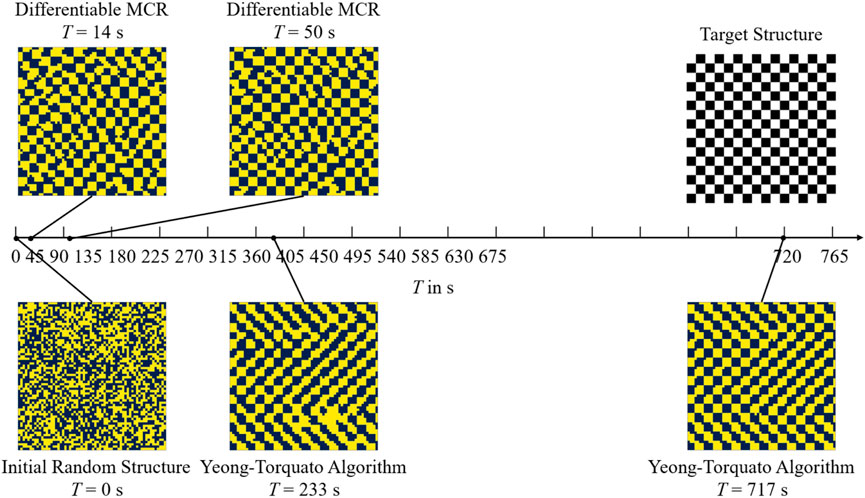
Figure 4. Performance comparison between the Yeong-Torquato algorithm and differentiable microstructure reconstruction in reconstructing a
The speedup we observe is consistent with a broader trend in geomechanical computation: multiscale/gradient-informed formulations reduce cost while preserving predictive fidelity [35, 36], and joint processing of multi-component signals demonstrates that fusing informative features can stabilize and accelerate inference [37]. In applied settings where throughput matters, computationally lean upstream characterizations are essential inputs, and our gradient-based reconstruction is designed with precisely this throughput in mind [16, 38].
5 Conclusion
This study rebuilds three-dimensional digital cores from two-dimensional slices of a coarse-grained conglomerate by combining differentiable microstructure descriptors—namely spatial three-point correlations, Gram matrices and local variation—within the open-source MCRpy framework. Digital cores produced with this gradient-driven approach and with the classical Yeong-Torquato algorithm were both evaluated in FLAC3D; only the differentiable-descriptor cores reproduced laboratory cohesion and friction angles with high fidelity. By turning inexpensive 2D imagery into reliable 3D models, the method strengthens multiscale geotechnical analyses that underpin projects such as bridge foundations and tunnel excavation.
Data availability statement
The original contributions presented in the study are included in the article/Supplementary Material, further inquiries can be directed to the corresponding author.
Author contributions
ZH: Data curation, Formal Analysis, Funding acquisition, Methodology, Writing – original draft, Writing – review and editing. YN: Conceptualization, Methodology, Software, Supervision, Writing – original draft, Writing – review and editing. YuZ: Conceptualization, Investigation, Methodology, Software, Validation, Visualization, Writing – original draft, Writing – review and editing. QH: Conceptualization, Data curation, Methodology, Software, Visualization, Writing – review and editing. YaZ: Conceptualization, Investigation, Supervision, Validation, Writing – original draft. QM: Conceptualization, Project administration, Supervision, Validation, Visualization, Writing – original draft, Writing – review and editing.
Funding
The author(s) declare that financial support was received for the research and/or publication of this article. Supported by Postgraduate Research and Practice Innovation Program of Jiangsu Province (SJCX25_0268) and Science and Technology Talents and Platform Plan: Technology Innovation Center of Yunnan Province for Digital Water Engineering (No. 202305AK34003).
Acknowledgments
The authors would like to acknowledge the support of Research Institute of Geotechnical Engineering, Hohai University for providing computational resources and technical assistance.
Conflict of interest
Authors YN, QH, and QM were employed by Kunming Engineering Co. Ltd., Power Construction Corporation.
The remaining authors declare that the research was conducted in the absence of any commercial or financial relationships that could be construed as a potential conflict of interest.
Generative AI statement
The author(s) declare that no Generative AI was used in the creation of this manuscript.
Any alternative text (alt text) provided alongside figures in this article has been generated by Frontiers with the support of artificial intelligence and reasonable efforts have been made to ensure accuracy, including review by the authors wherever possible. If you identify any issues, please contact us.
Publisher’s note
All claims expressed in this article are solely those of the authors and do not necessarily represent those of their affiliated organizations, or those of the publisher, the editors and the reviewers. Any product that may be evaluated in this article, or claim that may be made by its manufacturer, is not guaranteed or endorsed by the publisher.
Supplementary material
The Supplementary Material for this article can be found online at: https://www.frontiersin.org/articles/10.3389/fphy.2025.1684783/full#supplementary-material
References
1. Iovea M, Oaie G, Ricman C, Mateiasi G, Neagu M, Szobotka S, et al. Dual-energy X-ray computer axial tomography and digital radiography investigation of cores and other objects of geological interest. Eng Geology (2009) 103(3-4):119–26. doi:10.1016/j.enggeo.2008.06.018
2. Wang J, Gao J, Liu L. Porosity characteristics of sandstone by X-ray CT scanning system. Acta Petrolei Sinica (2009) 30(6):887. doi:10.7623/syxb200906016
3. Seibert P, Ambati M, Raßloff A, Kästner M. Reconstructing random heterogeneous media through differentiable optimization. Comput Mater Sci (2021) 196:110455. doi:10.1016/j.commatsci.2021.110455
4. Bostanabad R, Zhang Y, Li X, Kearney T, Brinson LC, Apley DW, et al. Computational microstructure characterization and reconstruction: review of the state-of-the-art techniques. Prog Mater Sci (2018) 95:1–41. doi:10.1016/j.pmatsci.2018.01.005
5. Li D. Review of structure representation and reconstruction on mesoscale and microscale. Jom (2014) 66:444–54. doi:10.1007/s11837-013-0848-0
6. Yeong CLY, Torquato S. Reconstructing random media. Phys Rev E (1998) 57(1):495–506. doi:10.1103/physreve.57.495
7. Jiao Y, Stillinger FH, Torquato S. Modeling heterogeneous materials via two-point correlation functions: basic principles. Phys Rev E—Statistical, Nonlinear, Soft Matter Phys (2007) 76(3):031110. doi:10.1103/physreve.76.031110
8. Xu H, Dikin DA, Craig B, Chen W. Descriptor-based methodology for statistical characterization and 3D reconstruction of microstructural materials. Comput Mater Sci (2014) 85:206–16. doi:10.1016/j.commatsci.2013.12.046
9. Jiang Z, Chen W, Burkhart C. Efficient 3D porous microstructure reconstruction via gaussian random field and hybrid optimization. J Microsc (2013) 252(2):135–48. doi:10.1111/jmi.12077
10. Bostanabad R, Chen W, Apley DW. Characterization and reconstruction of 3D stochastic microstructures via supervised learning. J Microsc (2016) 264(3):282–97. doi:10.1111/jmi.12441
11. Bostanabad R. Reconstruction of 3D microstructures from 2D images via transfer learning. Computer-Aided Des (2020) 128:102906. doi:10.1016/j.cad.2020.102906
12. Cang R, Xu Y, Chen S, Liu Y, Jiao Y, Ren MY. Microstructure representation and reconstruction of heterogeneous materials via deep belief network for computational material design. J Mech Des (2017) 139(7):071404. doi:10.1115/1.4036649
13. Fokina D, Muravleva E, George O, Oseledets I. Microstructure synthesis using style-based generative adversarial networks. Phys Rev E (2020) 101(4):043308. doi:10.1103/physreve.101.043308
14. Jiangyu W, Zhang W, Yang S, Jivkov Andrey P, Elizabeth K, Hai P, et al. Polycarboxylate superplasticizer instead of ultrasonic treatment for dispersing cellulose nanofibers to strengthen cemented rockfill. Int J Minerals, Metall Mater (2025). doi:10.1007/s12613-025-3246-z
15. Wu J, Zhang W, Wang Y, Ju F, Pu H, Riabokon E, et al. Effect of composite alkali activator proportion on macroscopic and microscopic properties of gangue cemented rockfill: experiments and molecular dynamic modelling. Int J Minerals, Metall Mater (2025) 32(8):1813–25. doi:10.1007/s12613-025-3140-8
16. Li Y, Liu C, Weng Z, Wu D, Du Y. Aggregate-level 3D analysis of asphalt pavement deterioration using laser scanning and vision transformer. Automation in Construction (2025) 178:106380. doi:10.1016/j.autcon.2025.106380
17. Yin Q, Xin T, Hu Z, Huang M. Measurement and analysis of deformation of underlying tunnel induced by foundation pit excavation. Adv Civil Eng (2023) 2023(1):8897139. doi:10.1155/2023/8897139
18. Cui Z, Chen Q, Luo J, Ma X, Liu G. Characterizing subsurface structures from hard and soft data with multiple-condition fusion neural network. Water Resour Res (2024) 60(11):e2024WR038170. doi:10.1029/2024WR038170
19. Li L, Jin H, Tu W, Zhou Z. Study on the minimum safe thickness of water inrush prevention in karst tunnel under the coupling effect of blasting power and water pressure. Tunnelling Underground Space Technology (2024) 153:105994. doi:10.1016/j.tust.2024.105994
20. Kirkpatrick S, Gelatt CD, Vecchi MP. Optimization by simulated annealing. science (1983) 220(4598):671–80. doi:10.1126/science.220.4598.671
21. Seibert P, Raßloff A, Ambati M, Kästner M. Descriptor-based reconstruction of three-dimensional microstructures through gradient-based optimization. Acta Materialia (2022) 227:117667. doi:10.1016/j.actamat.2022.117667
22. Seibert P, Rassloff A, Kalina KA, Gussone J, Bugelnig K, Diehl M, et al. Two-stage 2D-to-3D reconstruction of realistic microstructures: implementation and numerical validation by effective properties. Computer Methods Appl Mech Eng (2023) 412:116098. doi:10.1016/j.cma.2023.116098
23. Lubbers N, Lookman T, Barros K. Inferring low-dimensional microstructure representations using convolutional neural networks. Phys Rev E (2017) 96(5):052111. doi:10.1103/physreve.96.052111
24. Seibert P, Raßloff A, Kalina K, Ambati M, Kästner M. Microstructure characterization and reconstruction in Python: MCRpy. Integrating Mater Manufacturing Innovation (2022) 11(3):450–66. doi:10.1007/s40192-022-00273-4
25. Zhang Y, He Z, Jiang R, Liao L, Meng Q. Improved computer vision framework for mesoscale simulation of Xiyu conglomerate using the discrete element method. Appl Sci (2023) 13(24):13000. doi:10.3390/app132413000
26. Cule D, Torquato S. Generating random media from limited microstructural information via stochastic optimization. J Appl Phys (1999) 86(6):3428–37. doi:10.1063/1.371225
28. Lindquist ES, Goodman RE. Strength and deformation properties of a physical model melange. ARMA North America Rock Mech Symp (1994).
29. Xiao Y, Qiao Y, He M, Li H, Cheng T, Tang J. A unified strain-hardening and strain-softening elastoplastic constitutive model for intact rocks. Comput Geotechnics (2022) 148:104772. doi:10.1016/j.compgeo.2022.104772
30. Haddad RA, Ali NA. A class of fast Gaussian binomial filters for speech and image processing. IEEE Trans Signal Process (1991) 39(3):723–7. doi:10.1109/78.80892
31. Jin G, Zhou Z, Liu Y, Gao C, Ma H, Yang Z, et al. A novel coarse-grained discrete element method for simulating failure process of strongly bonded particle materials. Powder Technology (2025) 464:121212. doi:10.1016/j.powtec.2025.121212
32. Bai S, Zhou Z, Wang M, Gao C, Sun J, Jin G, et al. An unresolved DEM-CFD based simulation method for the erosion failure process of filling medium in faults. Eng Anal Boundary Elem (2025) 178:106283. doi:10.1016/j.enganabound.2025.106283
33. Liu G, Zhong Z, Ye T, Jin M, Zhao S, Liu J, et al. Impact failure and disaster processes associated with rockfalls based on three-dimensional discontinuous deformation analysis. Earth Surf Process Landforms (2024) 49(11):3344–66. doi:10.1002/esp.5893
34. Liu G, Kang J, Zhong Z, Wu B, Fan H, Yang C. Laboratory experiments and 3D DDA Numerical simulations on rockfall movement characteristics. Rock Mech Rock Eng (2025) 58(8):9747–69. doi:10.1007/s00603-025-04648-9
35. Zhao J, Jin J, Li Y. Macro-micro failures of shear creep and creep damage model of deep hard rocks induced by initial disturbances. Eng Fracture Mech (2025) 324:111269. doi:10.1016/j.engfracmech.2025.111269
36. Yang J, Gao C, Zhou Z, Zhang D, Bu F, Chen X, et al. Three-dimensional peridynamics based on matrix operation and its application in rock mass compression failure simulation. Comput Geotechnics (2025) 185:107354. doi:10.1016/j.compgeo.2025.107354
37. Yuan Y, Qin G, Li D, Zhong M, Shen Y, Ouyang Y. Real-Time joint filtering of gravity and gravity gradient data based on improved kalman filter. IEEE Trans Geosci Remote Sensing (2024) 62:1–12. doi:10.1109/TGRS.2024.3452038
38. Hu D, Liu J, Li Y, Tan Z. Prediction method of ground settlement for rectangular tunnel construction. Tunnelling Underground Space Technology (2025) 164:106814. doi:10.1016/j.tust.2025.106814
Keywords: microstructure reconstruction, differentiable descriptors, digital rock analysis, two-point correlation function, gradient-based optimization
Citation: He Z, Ning Y, Zhang Y, Huang Q, Zhou Y and Meng Q (2025) 3D reconstruction of geomaterial microstructure based on differentiable descriptors. Front. Phys. 13:1684783. doi: 10.3389/fphy.2025.1684783
Received: 13 August 2025; Accepted: 18 September 2025;
Published: 15 October 2025.
Edited by:
Jiangyu Wu, China University of Mining and Technology, ChinaReviewed by:
Njitacke Tabekoueng Zeric, University of Buea, CameroonXiao Wang, Shandong University of Science and Technology, China
Copyright © 2025 He, Ning, Zhang, Huang, Zhou and Meng. This is an open-access article distributed under the terms of the Creative Commons Attribution License (CC BY). The use, distribution or reproduction in other forums is permitted, provided the original author(s) and the copyright owner(s) are credited and that the original publication in this journal is cited, in accordance with accepted academic practice. No use, distribution or reproduction is permitted which does not comply with these terms.
*Correspondence: Yu Ning, bmluZy15dUBmb3htYWlsLmNvbQ==