 A. A. Coreno-Cortés
 M. A. Cortés-Cuán
 I. Santamaría-Holek
- UMDI-Facultad de Ciencias, Universidad Nacional Autónoma de México Campus Juriquilla, Querétaro, México
In this work, we used Conductor-like Screening Model for Real Solvents (COSMO-RS) to calculate the parameters that characterize the interactions between molecular segments in a coarse-grained representation of the PLGA–PEG–PLGA mesomolecule. The computed activity coefficients at infinite dilution were then used to obtain the thermodynamic Flory–Huggins interaction parameters, which were subsequently transferred to Dissipative Particle Dynamics simulations. In these simulations, beads interact through repulsive conservative parameters to investigate the self-aggregation of the PLGA–PEG–PLGA triblock copolymer. The parameters were then applied in Dissipative Particle Dynamics (DPD) simulations at varying copolymer concentrations. Self assembling at different concentrations was studied. Transitions from core-shell spherical micelles to onion-like, columnar and lamellar structures were obtained in terms of copolymer concentration, setting the optimal concentration range for different drug loaded vehicles.
1 Introduction
Polymeric micelles formed from amphiphilic block copolymers in aqueous solution have been extensively studied in recent decades as drug delivery systems Cabral et al. [1], Hossen et al. [2]. They offer high in vivo stability, efficient drug loading, good biocompatibility, and effective targeted drug release. These properties contribute to enhanced chemotherapeutic efficacy and reduced drug toxicity, Fukushima [3], Liao et al. [4], Zhang et al. [5]. Although polymeric micelles have attracted considerable interest as drug carriers, a comprehensive understanding of their structures and morphologies upon drug loading remains limited.
Various polymeric micelles can serve as drug delivery vehicles; among them, PLGA-b-PEG-b-PLGA micelles—composed of poly (lactic acid-co-glycolic acid)-b-poly (ethylene glycol)-b-poly (lactic acid-co-glycolic acid)—have garnered significant attention, Zhang et al. [6], Yan et al. [7]. The PLGA-b-PEG-b-PLGA copolymers materials have advantages such as biocompatibility, degradability, thermosensitivity and controlled release, Yu et al. [8]. The capacity of PLGA-b-PEG-b-PLGA micelles to solubilize hydrophobic drugs stems from their core–shell structure, Chen et al. [9]. Extensive studies have been conducted on their drug-loading capabilities, for example, it has been showed that PLGA-b-PEG-b-PLGA can carry doxorubicin (DOX) drugs, Wang et al. [10], in this study they found that due to the molecular interactions between hydrophobic blocks, PLGA-b-PEG-b-PLGA have exhibited long lasting maintenance after subcutaneous injection in vivo, Chang et al. [11]. Khorshid et al. [12] explored the influence of hydrophylic PEG block length keeping the hydrophobic PLGA blocks constant. They observed that, as the temperature varied, the aggregate structure transitioned from spherical core–shell micelles to cylindrical micelles and eventually to packed cylindrical arrangements.
Since experimental techniques alone have limitations in revealing the detailed molecular distribution and dynamic behavior of drug-loaded systems, computational simulations have been widely employed to study drug encapsulation and release mechanisms. Among computational approaches, dissipative particle dynamics (DPD) has shown to be an efficient mesoscopic simulation method, well-suited for studying complex multiphase systems. It has been successfully used to investigate the formation, drug distribution, and release processes in drug-loaded micelles, Hoogerbrugge and Koelman [13]. DPD is a coarse-grained simulation method used to study surfactant aggregation in solution over extended timescales. In this mesoscopic approach, molecules are represented as beads, allowing for efficient modeling of self-assembly processes. Beyond surfactants, DPD has also been applied to explore more complex liquid systems, Groot and Rabone [14]. Yang et al. [15] used DPD simulations to investigate comicellization behavior, drug distribution patterns, and dual pH/reduction-responsive drug release in mixed micelles. Similarly, Kuru et al. employed coarse-grained DPD simulations to study the morphology, drug encapsulation, and release characteristics of PEG–PLA–PEG amphiphilic block copolymer systems. In more recent years Wang et al. [10] used DPD to study the morphologies and structures of the PLGA-b-PEG-b-PLGA influenced by the copolymer concentration and composition. The structures reported were micelles observed as spherical, onionlike, columnar, and lamellar structures.
Several coarse-grained computational approaches have been reported for simulating these types of dynamics, Cooke et al. [16], Cooke and Deserno [17]. Typically, these models are parameterized using inverse Monte Carlo techniques based on atomistic simulations, Elezgaray and Laguerre [18], Shelley et al. [19]. However, such parameterizations present limitations particularly regarding temperature, which is constrained to the range used during calibration. For example, the widely used MARTINI force field is valid only between 270 and 330 K, Marrink et al. [20]; simulations beyond this range may yield inaccurate results. Another significant limitation lies in modeling interactions between polar compounds, where the forces are often underestimated.
Nivón-Ramírez et al. [21] used a methodology to estimate coarse-grained repulsion parameters
Solvent effects are incorporated through the Conductor-like Screening Model (COSMO) and the COSMO-Real Solvent (COSMO-RS) model, which allow for the computation of chemical potentials
COSMO-type models do not rely on tabulated parameters, as they only require quantum mechanical solvation calculations as input to predict phase equilibria. Consequently, they are not limited by missing parameter values and can be applied to a broader range of chemical species. This is particularly valuable in industrial settings, where new or poorly characterized compounds are often of interest [25].
In this study, the interaction parameters of the PLGA-b-PEG-b-PLGA copolymer were validated through a modified COSMO-RS methodology at 298.15 K. These parameters were subsequently employed in Dissipative Particle Dynamics (DPD) simulations to examine the influence of copolymer concentration on the self-assembly of unloaded (blank) structures. The article is organized as follows: in Section 2 we present the DPD methodology with the COSMO-RS method, in Section 3 we display our findings using first principle and mesoscopic techniques and finally in Section 4 we provide an insight from our work.
2 Materials and methods
2.1 Dissipative particle dynamics
DPD simulations are based on Newton’s equations of motion and aim to represent fluid behavior and interactions as simply as possible at the mesoscopic scale, minimizing computational cost. The core idea is to model interactions using a pairwise repulsion parameter
DPD is a coarse-grained molecular dynamics method in which the system’s time evolution is governed by the equations of motion, that is
The value of the force
Where,
All forces act within a cutoff distance
To determine the interaction parameters
2.2 Scaling from atomistic models to mesoscopic representations
In the coarse-graining process employed for DPD modeling, all beads are assumed to occupy the same volume
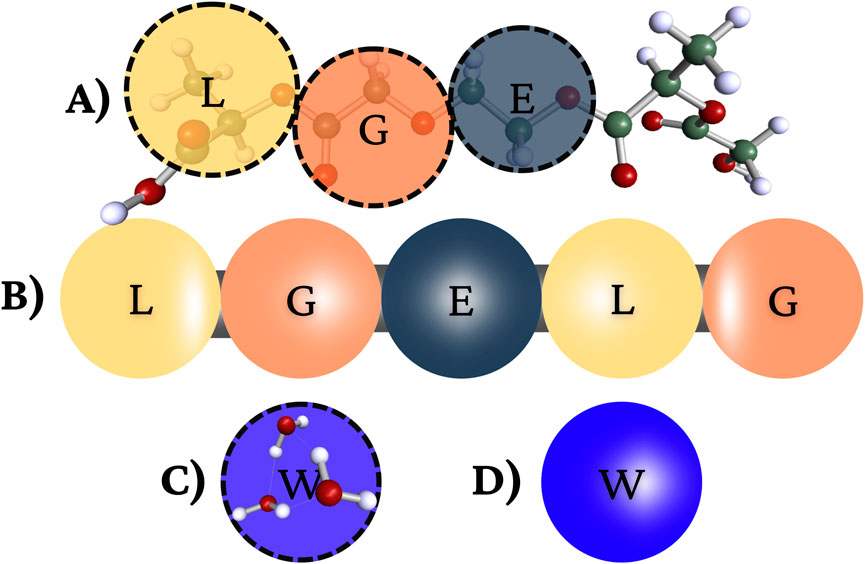
Figure 1. (A) Schematic representation of the PLGA-b-PEG-b-PLGA copolymer. The lactic acid (L) block is shown in yellow, the glycolic acid (G) block in flesh color, and the polyethylene glycol (E) segment in dark. (B) Coarse-grained DPD representation of the copolymer. (C) Atomistic snapshot of three water molecules (H2O) corresponding to one coarse-grained water bead. (D) Coarse-grained DPD representation of a single water bead.
To determine the volume of each bead
where
The number of water molecules in one bead is calculated by Equation 6:
where
Molecular volume calculations for the solute the molecule and incorporate a continuous approximation of the solvent environment via the conductor-like screening model (COSMO), Klamt and Eckert [36]; Klamt [37]. In order to maintain consistency with the atomistic-quantum calculations of the Flory–Huggins parameter,
The infinite-dilution activity coefficient,
where
Next, the interaction parameters were determined through a geometry optimization of the PLGA-b-PEG-b-PLGA polymer using density functional theory (DFT) within the TURBOMOLE software suite, accessed through the TMoleX 2025 interface. The DFT calculations were conducted under the COSMO continuous solvation model, Klamt [38], with the def-TZVP (triple-zeta valence polarized) atomic basis set, Schäfer et al. [39,40] and the Becke-Perdew (BP) functional, specifically B88-VWN-P86, Ahlrichs et al. [41]. Both geometric optimization and self-consistent field (SCF) procedures were implemented with an energy convergence criterion of
The liquid mixture was then modeled with COSMOthermX, Klamt and Schüürmann [42] under the COSMO-RS framework, effectively treating the molecules as if immersed in an ideal conductor. The parameter file BP_TZVP_C21_0111.ctd, Diedenhofen and Klamt [43], was selected to match the chosen basis set and level of theory.
In homogeneous systems, the interaction parameters for identical species simplify to
For identical molecules, the following DPD repulsion parameters follow, Xu et al. [44]:
where
According to Groot and Rabone (Equation 10) [46], for a system at
where
Because atomistic simulations work at the molecular scale, it becomes necessary to adjust
In Equation 12,
3 Results and discussion
3.1 Interaction parameters
Table 1 presents the molecular volumes at 298.15 K used for temperature correction. Based on these volumes, a bead volume of 82.61
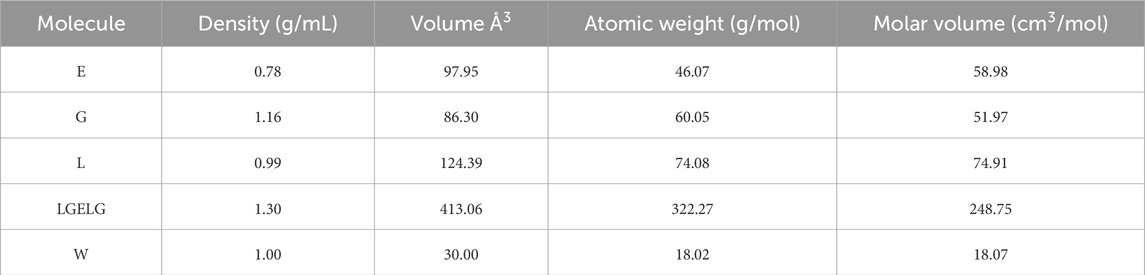
Table 1. Molecular properties of polyethylene glycol (E), glycolic acid (G), lactic acid (L), and a reference system of three water molecules (W) at 298.15 K.
The ratios of molecular volumes employed to compute the solute–solvent interaction parameters are shown in Table 2, along with the corresponding DPD interaction parameters
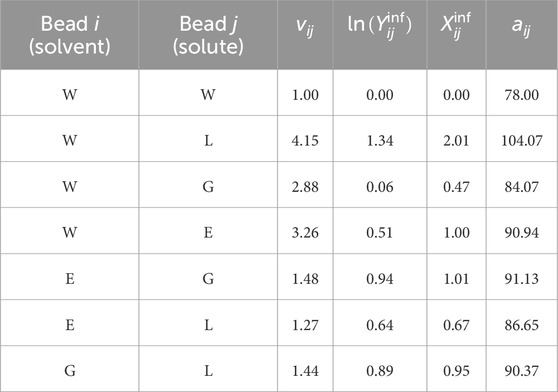
Table 2. DPD interaction parameters between different structural units.
Using Equation 11 and the volumetric coefficients
Through the COSMO method, the polarization charge density (SCD) is also obtained. Positive SCD values designate partially negative charge regions, whereas negative values correspond to regions of partial positive charge. The DFT-COSMO calculations generate a SCD distribution, which is transformed into sigma profiles (
Figure 2 displays the SCD profiles for water (W; magenta), lactic acid (L; blue), glycolic acid (G; green), and ethylene glycol (E; red). The
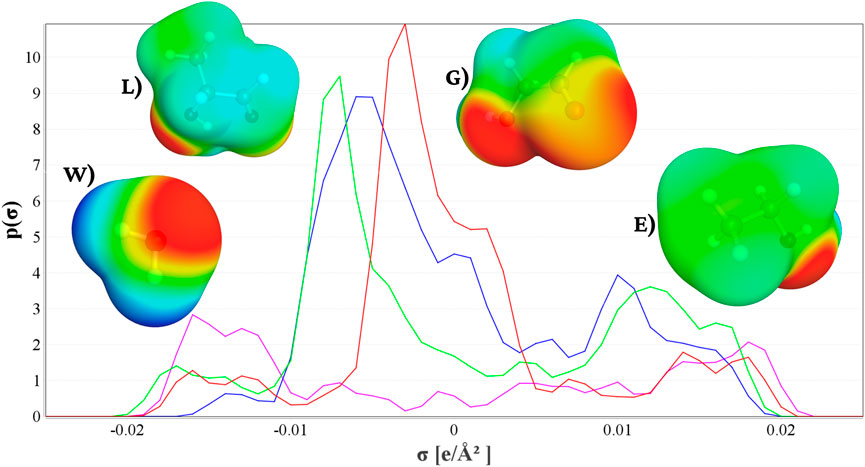
Figure 2. SCD profiles of each molecular fragment: (W) water (magenta line), (L) lactic acid (blue line), (G) glycolic acid (green line), and (E) ethylene glycol (red line).
Based on these profiles, good miscibility is expected between water (W) and glycolic acid (G), as both exhibit pronounced negative
3.2 Dissipative particle dynamics results
The DPD simulations are performed in a
We work with the PLGA-b-PEG-b-PLGA copolymer and water, the PLGA is the hydrophobic block, PEG is the hydrophilic block. Since we propose a more complete coarse grained model based on quantum calculations, we refer to the model in Figure 1 to represent the beads of the PLGA-b-PEG-b-PLGA copolymer and for water. As shown, several atoms or functional groups are represented as a DPD bead as we highlighted by color. We fragment the PLGA-b-PEG-b-PLGAThe in 5 parts: lactic acid (L) block shown in yellow, the glycolic acid (G) block in flesh color, and the polyethylene glycol (E) segment in dark. We represent three water molecules by one blue bead.
3.3 Morphologies and structures of the PLGA-b-PEG-b-PLGA micelles
The
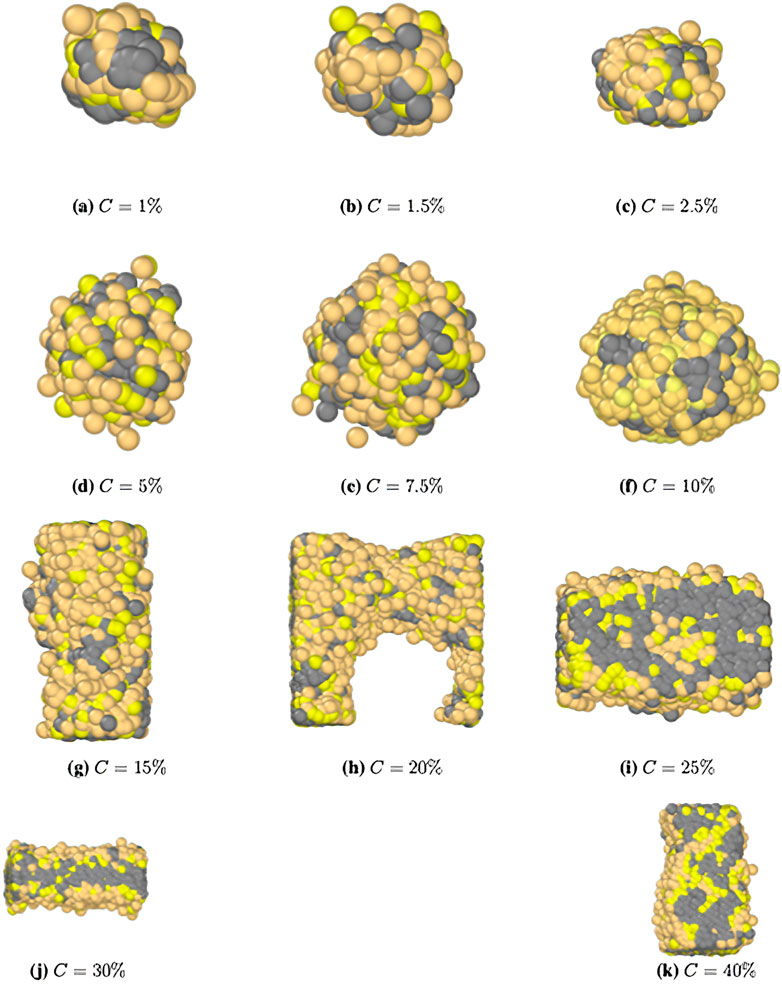
Figure 3. Representative morphology snapshots of the
Figure 3 demonstrates that the micellization process of
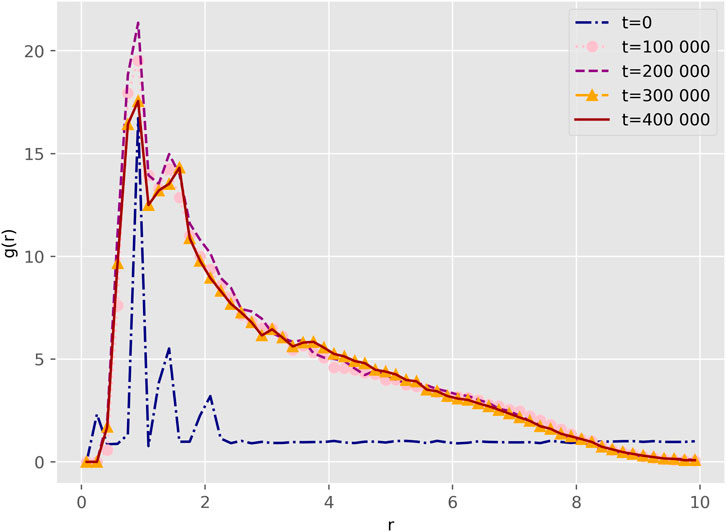
Figure 4. Radial distribution functions between beads of the
Our findings align with the results reported by Wang Wang et al. [10], who reported similar effects of copolymer concentration on micelle morphology. Specifically, at concentrations below 10%, the micelles formed core-shell spherical structures, while at higher concentrations, they transitioned into onionlike, columnar, and lamellar structures. These findings are consistent with experimental reports of similar micelle size trends with increasing copolymer concentration Khorshid et al. [12], and also with the report by Shen Shen et al. [60], that demonstrates comparable structural transitions in PEG-PLGA micelles as the copolymer concentration increased.
Our results show that the G bead behaves like de hidrophilic core sorrounded by the E bead and finally the hidrophobic core L. With the findings of our study we show that this given difference is due to the theory used to calculate the interaction parameters, Wang et al. [10] used the Hildebrand theory, Hildebrand [61], while we used the COSMO methodology, Mullins et al. [53]. Table 3 highlights the differences between our parameters and those reported by Wang. Our model offers a more detailed representation by calculating energy interactions at the molecular level, whereas Hildebrand theory can introduce errors when estimating cohesive energy Ovejero et al. [62]. Moreover, a key limitation of the Hildebrand solubility parameter is its applicability only to non-polar or weakly polar systems. Since it primarily accounts for dispersion forces, it neglects important dipole–dipole and hydrogen bonding interactions, which are essential in polar solvents and polymer systems. As a result, it may lead to inaccurate solubility predictions in systems with strong intermolecular forces, Barton [63], Venkatram et al. [64].
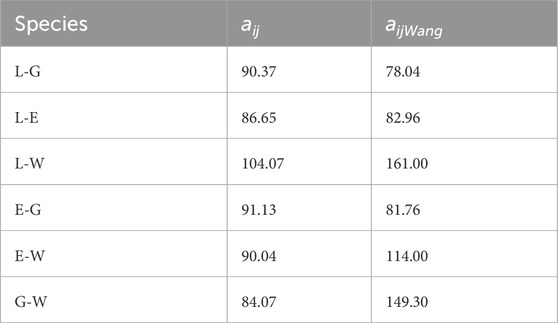
Table 3. Interaction parameters for the conservative force.
4 Discussion
In this study, we demonstrated that the coarse-graining method significantly influences the calculation of interaction parameters, which in turn affect the chemical behavior of the system. Methods such as COSMO and COSMO-RS have proven to be superior approaches for performing bottom-up parameterization. Polymeric micelles formed by
As the
Data availability statement
The raw data supporting the conclusions of this article will be made available by the authors, without undue reservation.
Author contributions
AC-C: Conceptualization, Investigation, Validation, Visualization, Writing – original draft, Writing – review and editing. MC-C: Investigation, Visualization, Writing – review and editing. IS-H: Conceptualization, Funding acquisition, Supervision, Writing – review and editing.
Funding
The author(s) declare that financial support was received for the research and/or publication of this article. A.AC-C. acknowledges CONAHCYT for supporting the scholarship CVU: 1184262. M.A. C-C acknowledges CONAHCYT for supporting the scholarship CVU: 1183460. A.AC-C. appreciates the technical support of Alejandro de León Cuevas, Alejandro Ávalos and Luis Alberto Aguilar Bautista from Laboratorio Nacional de Visualización Científica Avanzada (LAVIS-UNAM). A. A. Coreno-Cortés thanks Dr. Rodolfo Gómez Balderas and Dra. Roxana Mitzaye del Castillo Vazquez for their technical support. IS-H. acknowledges UMDI-J-FC UNAM for partial financial support under grant number 115377. IS-H. is grateful to LANCAD-UNAM-DGTIC-276.
Conflict of interest
The authors declare that the research was conducted in the absence of any commercial or financial relationships that could be construed as a potential conflict of interest.
Generative AI statement
The author(s) declare that no Generative AI was used in the creation of this manuscript.
Any alternative text (alt text) provided alongside figures in this article has been generated by Frontiers with the support of artificial intelligence and reasonable efforts have been made to ensure accuracy, including review by the authors wherever possible. If you identify any issues, please contact us.
Publisher’s note
All claims expressed in this article are solely those of the authors and do not necessarily represent those of their affiliated organizations, or those of the publisher, the editors and the reviewers. Any product that may be evaluated in this article, or claim that may be made by its manufacturer, is not guaranteed or endorsed by the publisher.
Supplementary material
The Supplementary Material for this article can be found online at: https://www.frontiersin.org/articles/10.3389/fphy.2025.1694078/full#supplementary-material
References
1. Cabral H, Miyata K, Osada K, Kataoka K. enBlock copolymer micelles in nanomedicine applications. Chem Rev (2018) 118:6844–92. doi:10.1021/acs.chemrev.8b00199
2. Hossen S, Hossain MK, Basher M, Mia M, Rahman M, Uddin MJ. Smart nanocarrier-based drug delivery systems for cancer therapy and toxicity studies: a review. J Adv Res (2019) 15:1–18. doi:10.1016/j.jare.2018.06.005
3. Fukushima K. enBiodegradable functional biomaterials exploiting substituted trimethylene carbonates and organocatalytic transesterification. Polym J (2016) 48:1103–14. doi:10.1038/pj.2016.80
4. Liao H, Gao Y, Lian C, Zhang Y, Wang B, Yang Y, et al. enOral absorption and lymphatic transport of baicalein following drug–phospholipid complex incorporation in self-microemulsifying drug delivery systems. Int J Nanomedicine (2019) 14:7291–306. doi:10.2147/IJN.S214883
5. Zhang S, Qian X, Zhang D, Zhu J, Wu Y, Guo Y, et al. enIn vitro anticancer efficacy by magnetic targeted nanocarrier with local delivery of paclitaxel. Chem Res Chin Universities (2016) 32:149–54. doi:10.1007/s40242-015-5115-1
6. Zhang K, Tang X, Zhang J, Lu W, Lin X, Zhang Y, et al. PEG–PLGA copolymers: their structure and structure-influenced drug delivery applications. J Controlled Release (2014) 183:77–86. doi:10.1016/j.jconrel.2014.03.026
7. Yan J, Facal Marina P, Blencowe A. enInfluence of polymerisation conditions on the kinetics of poly(lactic-co -glycolic acid)- b -poly(ethylene glycol)- b -poly(lactic-co -glycolic acid) triblock synthesis and the occurrence of transesterification side reactions. Polym Chem (2023) 14:2229–37. doi:10.1039/D3PY00139C
8. Yu L, Ci T, Zhou S, Zeng W, Ding J. The thermogelling PLGA–PEG–PLGA block copolymer as a sustained release matrix of doxorubicin. Biomater Sci (2013) 1:411. doi:10.1039/c2bm00159d
9. Chen X, Chen J, Li B, Yang X, Zeng R, Liu Y, et al. enPLGA-PEG-PLGA triblock copolymeric micelles as oral drug delivery system: in vitro drug release and in vivo pharmacokinetics assessment. J Colloid Interf Sci (2017) 490:542–52. doi:10.1016/j.jcis.2016.11.089
10. Wang M, Lin Y, Gao J, Liu D. enDPD simulations on morphologies and structures of blank PLGA-b -PEG-b -PLGA polymeric micelles and docetaxel-loaded PLGA-b -PEG-b -PLGA polymeric micelles. RSC Adv (2022) 12:12078–88. doi:10.1039/D2RA00940D
11. Chang G, Li C, Lu W, Ding J. enN -Boc-Histidine-Capped PLGA-PEG-PLGA as a smart polymer for drug delivery sensitive to tumor extracellular pH. Macromolecular Biosci (2010) 10:1248–56. doi:10.1002/mabi.201000117
12. Khorshid NK, Zhu K, Knudsen KD, Bekhradnia S, Sande SA, Nyström B. enNovel structural changes during temperature-induced self-assembling and gelation of PLGA-PEG-PLGA triblock copolymer in aqueous solutions. Macromolecular Biosci (2016) 16:1838–52. doi:10.1002/mabi.201600277
13. Hoogerbrugge PJ, Koelman JMVA. Simulating microscopic hydrodynamic phenomena with dissipative particle dynamics. Europhysics Lett (Epl) (1992) 19:155–60. doi:10.1209/0295-5075/19/3/001
14. Groot R, Rabone K. enMesoscopic simulation of cell membrane damage, morphology change and rupture by nonionic surfactants. Biophysical J (2001) 81:725–36. doi:10.1016/S0006-3495(01)75737-2
15. Yang Z, Zhao H, Wang D, Yin L, Cai K, Lin Z, et al. enDPD simulations on mixed polymeric DOX-Loaded micelles assembled from PCL-SS-PPEGMA/PDEA–PPEGMA and their dual pH/reduction-responsive release. Phys Chem Chem Phys (2021) 23:19011–21. doi:10.1039/D1CP02750F
16. Cooke IR, Kremer K, Deserno M. Tunable generic model for fluid bilayer membranes. Phys Rev E (2005) 72:011506. doi:10.1103/PhysRevE.72.011506
17. Cooke IR, Deserno M. Solvent-free model for self-assembling fluid bilayer membranes: stabilization of the fluid phase based on broad attractive tail potentials. The J Chem Phys (2005) 123:224710. doi:10.1063/1.2135785
18. Elezgaray J, Laguerre M. enA systematic method to derive force fields for coarse-grained simulations of phospholipids. Computer Phys Commun (2006) 175:264–8. doi:10.1016/j.cpc.2006.01.009
19. Shelley JC, Shelley MY, Reeder RC, Bandyopadhyay S, Klein ML. enA coarse grain model for phospholipid simulations. The J Phys Chem B (2001) 105:4464–70. doi:10.1021/jp010238p
20. Marrink SJ, Risselada HJ, Yefimov S, Tieleman DP, De Vries AH. enThe MARTINI force field: coarse grained model for biomolecular simulations. The J Phys Chem B (2007) 111:7812–24. doi:10.1021/jp071097f
21. Nivón-Ramírez D, Reyes-García LI, Oviedo-Roa R, Gómez-Balderas R, Zuriaga-Monroy C, Martínez-Magadán J-M. Critical micelle concentration of SDS through DPD simulations using COSMO-RS–based interaction parameters, the thermal effects. Colloids Surf A: Physicochemical Eng Aspects (2022) 645:128867. doi:10.1016/j.colsurfa.2022.12867
22. Shimoyama Y, Iwai Y. enDevelopment of activity coefficient model based on COSMO method for prediction of solubilities of solid solutes in supercritical carbon dioxide. The J Supercrit Fluids (2009) 50:210–7. doi:10.1016/j.supflu.2009.06.004
23. Grensemann H, Gmehling J. enPerformance of a conductor-like screening model for real solvents model in Comparison to Classical Group contribution methods. Ind and Eng Chem Res (2005) 44:1610–24. doi:10.1021/ie049139z
24. Merker T, Hsieh C, Lin S, Hasse H, Vrabec J. enFluid-phase coexistence for the oxidation of span style=font-variant:small-caps. AIChE J (2013) 59:2236–50. doi:10.1002/aic.13986
25. Gaube J, Fredenslund enA, Gmehling J, Rasmussen P. Vapor-Liquid equilibria using UNIFAC a group-contribution method. Berichte der Bunsengesellschaft für physikalische Chem (1978) 82:551. doi:10.1002/bbpc.197800104
26. Groot RD, Warren PB. enDissipative particle dynamics: bridging the gap between atomistic and mesoscopic simulation. The J Chem Phys (1997) 107:4423–35. doi:10.1063/1.44784
27. Groot RD. Applications of dissipative particle dynamics. Berlin Heidelberg: Springer (2004). p. 5–38. doi:10.1007/978-3-540-39895-0_1
28. Oviedo-Roa R, Martínez-Magadán JM, Muñoz-Colunga A, Gómez-Balderas R, Pons-Jiménez M, Zamudio-Rivera LS. Critical micelle concentration of an ammonium salt through dpd simulations using cosmo-rs–based interaction parameters. AIChE J (2013) 59:4413–23. doi:10.1002/aic.14158
29. Nivón-Ramírez D, Reyes-García LI, Oviedo-Roa R, Gómez-Balderas R, Zuriaga-Monroy C, Martínez-Magadán J-M. Critical micelle concentration of sds through dpd simulations using cosmo-rs–based interaction parameters, the thermal effects. Colloids Surf A: Physicochemical Eng Aspects (2022) 645:128867. doi:10.1016/j.colsurfa.2022.128867
30. Alasiri H, Chapman WG. Dissipative particle dynamics (dpd) study of the interfacial tension for alkane/water systems by using cosmo-rs to calculate interaction parameters. J Mol Liquids (2017) 246:131–9. doi:10.1016/j.molliq.2017.09.056
31. Saathoff J. Effectively parameterizing dissipative particle dynamics using cosmo-sac: a partition coefficient study. The J Chem Phys (2018) 148:154102. doi:10.1063/1.5019952
32. Maiti A, McGrother S. enBead–bead interaction parameters in dissipative particle dynamics: relation to bead-size, solubility parameter, and surface tension. The J Chem Phys (2004) 120:1594–601. doi:10.1063/1.163294
33. Rajkamal N, Vedantam S. Dissipative particle dynamics study of intracellular delivery in capsules deformed by microfluidic constriction channels. Int J Comput Methods Eng Sci Mech (2025) 26:56–75. doi:10.1080/15502287.2024.2447309
34. Wang M, Lin Y, Gao J, Liu D. Dpd simulations on morphologies and structures of blank plga-b-peg-b-plga polymeric micelles and docetaxel-loaded plga-b-peg-b-plga polymeric micelles. RSC Adv (2022) 12:12078–88. doi:10.1039/d2ra00940d
35. Lee S, Kang S, Kim WJ. Targeted protein degradation in cancer therapy via hydrophobic polymer-tagged nanoparticles. ACS Nano (2025) 19:7742–54. doi:10.1021/acsnano.4c12747
36. Klamt A, Eckert F. Cosmo-rs: a novel and efficient method for the a priori prediction of thermophysical data of liquids. Fluid Phase Equilibria (2000) 172:43–72. doi:10.1016/s0378-3812(00)00357-5
37. Klamt A. The cosmo and cosmo-rs solvation models. WIREs Comput Mol Sci (2011) 1:699–709. doi:10.1002/wcms.56
38. Klamt A. The cosmo and cosmo-rs solvation models. WIREs Comput Mol Sci (2017) 8:e1338. doi:10.1002/wcms.1338
39. Schäfer A, Horn H, Ahlrichs R. Fully optimized contracted gaussian basis sets for atoms li to kr. The J Chem Phys (1992) 97:2571–7. doi:10.1063/1.463096
40. Schäfer A, Huber C, Ahlrichs R. Fully optimized contracted gaussian basis sets of triple zeta valence quality for atoms li to kr. The J Chem Phys (1994) 100:5829–35. doi:10.1063/1.467146
41. Ahlrichs R, Bär M, Häser M, Horn H, Kölmel C. Electronic structure calculations on workstation computers: the program system turbomole. Chem Phys Lett (1989) 162:165–9. doi:10.1016/0009-2614(89)85118-8
42. Klamt A, Schüürmann G. Cosmo: a new approach to dielectric screening in solvents with explicit expressions for the screening energy and its gradient. J Chem Soc Perkin Trans (1993) 2:799–805doi. doi:10.1039/p29930000799
43. Diedenhofen M, Klamt A. Cosmo-rs as a tool for property prediction of il mixtures—a review. Fluid Phase Equilibria (2010) 294:31–8. doi:10.1016/j.fluid.2010.02.002
44. Xu RL, Winnik* MA, Hallett FR, Riess G, Croucher MD. Light scattering study of the association behavior of styrene-ethylene oxide block copolymers in aqueous solution. Macromolecules (1991) 24:87–93. doi:10.1021/ma00001a014
45. Groot RD, Warren PB. Dissipative particle dynamics: bridging the gap between atomistic and mesoscopic simulation. The J Chem Phys (1997) 107:4423–35. doi:10.1063/1.474784
46. Groot R, Rabone K. Mesoscopic simulation of cell membrane damage, morphology change and rupture by nonionic surfactants. Biophysical J (2001) 81:725–36. doi:10.1016/s0006-3495(01)75737-2
47. Maiti A, McGrother S. Bead–bead interaction parameters in dissipative particle dynamics: relation to bead-size, solubility parameter, and surface tension. The J Chem Phys (2004) 120:1594–601. doi:10.1063/1.1630294
48. Khedr A, Striolo A. Dpd parameters estimation for simultaneously simulating water–oil interfaces and aqueous nonionic surfactants. J Chem Theor Comput (2018) 14:6460–71. doi:10.1021/acs.jctc.8b00476
49. Kuru MM, Dalgakiran EA, Kacar G. Investigation of morphology, micelle properties, drug encapsulation and release behavior of self-assembled peg-pla-peg block copolymers: a coarse-grained molecular simulations study. Colloids Surf A: Physicochemical Eng Aspects (2021) 629:127445. doi:10.1016/j.colsurfa.2021.127445
50. Yildiz M, Kacar G. Investigation of ibuprofen loading in peg–plga–peg micelles by coarse-grained dpd simulations. MRS Adv (2021) 6:689–94. doi:10.1557/s43580-021-00073-6
51. Scheffczyk J, Schäfer P, Fleitmann L, Thien J, Redepenning C, Leonhard K, et al. Cosmo-campd: a framework for integrated design of molecules and processes based on cosmo-rs. Mol Syst Des and Eng (2018) 3:645–57. doi:10.1039/c7me00125h
52. Klamt A, Eckert F, Hornig M. J Computer-Aided Mol Des (2001) 15:355–65. doi:10.1023/a1011111506388
53. Mullins E, Oldland R, Liu YA, Wang S, Sandler SI, Chen C-C, et al. enSigma-Profile database for using COSMO-Based thermodynamic methods. Ind and Eng Chem Res (2006) 45:4389–415. doi:10.1021/ie060370h
54. Al-Jabri M, Rodgers T. The effect of changing the molecular structure of the surfactant on the dissolution of lamellar phases. J Colloid Interf Sci (2023) 643:9–16. doi:10.1016/j.jcis.2023.03.205
55. Seaton MA, Anderson RL, Metz S, Smith W. DL_MESO: highly scalable mesoscale simulations. Mol Simulation (2013) 39:796–821. doi:10.1080/08927022.2013.772297
56. Guo XD, Tan JPK, Zhang LJ, Khan M, Liu SQ, Yang YY, et al. enPhase behavior study of paclitaxel loaded amphiphilic copolymer in two solvents by dissipative particle dynamics simulations. Chem Phys Lett (2009) 473:336–42. doi:10.1016/j.cplett.2009.04.009
57. Yu L, Zhang Z, Zhang H, Ding J. enMixing a sol and a precipitate of block copolymers with different block ratios leads to an injectable hydrogel. Biomacromolecules (2009) 10:1547–53. doi:10.1021/bm900145g
58. Guo S-H, Yu X-K, Zhu Y-L, Zhang L-L, Huang Y-N. enControlled release mechanism of drugs from onion-like dendrimersomes: insight from dissipative particle dynamics simulations. Phys Chem Chem Phys (2025) 27:9087–94. doi:10.1039/D4CP04780J
59. Bänsch F, Steinbeck C, Zielesny A. Notes on molecular fragmentation and parameter settings for a dissipative particle dynamics study of a C10E4/water mixture with lamellar bilayer formation. J Cheminformatics (2023) 15:23. doi:10.1186/s13321-023-00697-w
60. Shen L, Amatulli G, Sethi T, Raymond P, Domisch S. Estimating nitrogen and phosphorus concentrations in streams and rivers across the Contiguous United States (2019). doi:10.1594/PANGAEA.899168
61. Hildebrand JH. A critique of the theory of solubility of non-electrolytes. Chem Rev (1949) 44:37–45. doi:10.1021/cr60137a003
62. Ovejero G, Romero M, Díez E, Díaz I. enThermodynamic interactions of three SBS (styrene–butadiene–styrene) triblock copolymers with different solvents, by means of intrinsic viscosity measurements. Eur Polym J (2010) 46:2261–8. doi:10.1016/j.eurpolymj.2010.10.016
63. Barton AF. enCRC handbook of solubility parameters and other cohesion parameters: second edition. 2 edn. New York: Routledge (2017). doi:10.1201/9781315140575
Keywords: self-assembly, activity coefficients, flory-huggins, first principles, dissipative particle dynamics
Citation: Coreno-Cortés AA, Cortés-Cuán MA and Santamaría-Holek I (2025) PLGA–PEG–PLGA self-aggregation study via fragment dissipative particle dynamics and quantum determined interaction parameters. Front. Phys. 13:1694078. doi: 10.3389/fphy.2025.1694078
Received: 27 August 2025; Accepted: 06 October 2025;
Published: 20 October 2025.
Edited by:
Edward John Sambriski, Delaware Valley University, United StatesReviewed by:
Saravana Prakash Thirumuruganandham, SIT Health, Quito, EcuadorSegun Oke, Alabama A & M University, United States
Copyright © 2025 Coreno-Cortés, Cortés-Cuán and Santamaría-Holek. This is an open-access article distributed under the terms of the Creative Commons Attribution License (CC BY). The use, distribution or reproduction in other forums is permitted, provided the original author(s) and the copyright owner(s) are credited and that the original publication in this journal is cited, in accordance with accepted academic practice. No use, distribution or reproduction is permitted which does not comply with these terms.
*Correspondence: A. A. Coreno-Cortés, YWNvcmVub0BwY2VpbS51bmFtLm14; I. Santamaría-Holek, aXNob2xlay5mY0BnbWFpbC5jb20=