 Dan Lyu
 Gang Qin
- 1School of Science, Harbin Institute of Technology, Shenzhen, China
- 2Shenzhen Key Laboratory of Numerical Prediction for Space Storm, Harbin Institute of Technology, Shenzhen, China
The radiation exposure from galactic cosmic rays (GCRs) presents a significant challenge for human spaceflight to Mars. In this study, we employ our previously published GCR radiation dose calculation model to estimate the GCR radiation dose rates during a Mars mission from the Earth. Using this model, we calculate the absorbed dose rates of GCRs during the flight to Mars and compare our results with observational data from the Mars Science Laboratory Radiation Assessment Detector (MSL-RAD) and computational results from the Badhwar-O’Neill (BON) GCR model. First, we compute the energy spectrum of GCRs during the Earth-to-Mars transit using the GCR modulation model. Then, using the fluence-to-dose conversion coefficients (FDCCs) from ICRP 123, the absorbed dose rates of 15 human organs/tissues during the Earth-to-Mars transit are calculated to represent the general absorbed dose rate of the body (in water). Furthermore, considering the contributions of different elements and the underestimation of the model in 2012, we calculate the total absorbed dose rates of charged GCRs in silicon during the flight. Our results generally align with the BON11 model (excluding pions) and are consistently
1 Introduction
Galactic cosmic rays (GCRs) are high-energy particles originating from outside the solar system, consisting primarily of protons, helium nuclei, and heavier ions [1]. These particles travel at close to the speed of light and can penetrate spacecraft shielding, posing significant radiation risks to both astronauts and electronic equipment [2]. GCR radiation poses a significant concern for long-duration space missions, such as a Mars expedition, due to the extended exposure duration and the current inadequacy of shielding technologies to effectively mitigate the impact of such high-energy particles [3]. Understanding and accurately predicting GCR radiation doses are therefore critical for ensuring the safety of future manned missions to Mars and beyond.
The radiation environment in free space differs significantly from that on Earth’s surface. On Earth, the shielding effect of the ground limits GCR exposure to a 2
The radiation environment in free space and exposure to GCR radiation are considered among the primary health risks for future long-duration human exploration missions [5]. [10] estimated the GCR radiation dose rates around the lunar surface, using a GCR radiation dose calculation model. Although the modeling results generally agreed with spacecraft observation, they underestimated the observations in the year 2012 (indicated as underestimation of the model in 2012 hereafter). In this study, following [10], we employ numerical simulations using the GCR modulation model developed in previous work [11–13] to calculate the GCR energy spectra for the four predominant GCR nuclei (protons, helium, oxygen, and iron ions) during the Earth-to-Mars transit. By combining these simulation results with the FDCCs from ICRP Publication 123 [4,14,15] and considering the contributions of different elements (based on the contribution percentages in Table 1 of [10]), as well as the underestimation of the model in 2012, we derive time-dependent GCR absorbed dose rates during the transit period, accounting for all 26 GCR nuclei. In Section 2, we introduce the methodology for calculating the GCR radiation dose during a flight to Mars. In Section 3, we present the calculated results and compare them with observations. Finally, in Section 4, we provide a summary and discussion of our study.
2 Methodology
2.1 Experiment
The RAD on the MSL rover “Curiosity” is a comprehensive instrument designed to measure the energetic particle radiation environment. The RAD instrument, which includes a telescope comprising silicon detectors (A, B, C) and scintillators (D, E, F), provides comprehensive measurements of the radiation field. Detector B provides the absorbed dose rate in silicon for charged particles, while detector E, due to its tissue-equivalent composition, provides a more biologically relevant tissue dose rate and is also more sensitive to neutrons. During the cruise to Mars, RAD was housed inside the spacecraft, enabling it to measure the mixed field of primary galactic cosmic rays and secondary particles generated in the spacecraft shielding. This makes its data particularly relevant for assessing the radiation exposure for a crewed mission in a similarly shielded vehicle [6].
2.2 GCR model
This study extends our prior GCR dose model, which computes radiation dose by numerically solving the Parker transport equation to obtain GCR fluxes and converting them to dose rates using ICRP 123 FDCCs, a methodology validated against lunar radiation data (LRO/CRaTER, Chang’E-4/LND) [10]. For the present study, we validate the model against the Mars transit radiation environment using data from the MSL-RAD.
Building upon this work, we employ the GCR modulation model developed by Shen & Qin [11–13] to calculate the GCR energy spectra. The primary advancement here is the application of this model to the specific trajectory and time period of an Earth-to-Mars transit. This section provides a concise overview of the model implementation; for complete methodological details and theoretical foundations, we refer the reader to our prior publications.
2.2.1 Transport equation
The transport of GCRs in the heliosphere is fundamentally modulated by solar activity. This process is governed by the Parker transport equation [16], which accounts for diffusion, convection, particle drifts, and adiabatic energy changes of charged particles in the heliospheric magnetic field,
here,
2.2.2 Source spectrum
Since our GCR model does not include modulation effects beyond the heliospheric termination shock, for high energy particles, we follow previous studies [11–13] by setting the modulation boundary at the termination shock (assumed to be at 85 AU) and adopting an input spectrum [17]. Following [10], we express the GCR source at 85 AU as follows: for protons source, the local interstellar spectrum (LIS) by [17] is applied,
for heavy ion sources (He–Fe), the model from [13] is used,
where
2.2.3 Numerical methods
To numerically solve the Parker transport equation, we employ the time-backward Markov stochastic process method developed by [18]. This approach transforms the partial differential equation (Equation 1) into the following set of stochastic differential equations [18,19]:
where
We track the trajectories of multiple pseudo-particles in the backward direction from the observer’s position until they reach the outer boundary, and calculate their intensities using the GCR source spectrum (Equations 2, 3) in conjunction with the stochastic process method (Equation 4). For each month, we assume a locally static heliosphere, where the interplanetary conditions (e.g.,
2.3 Radiation dose rates model
Following [10], we have the radiation dose rates model as below.
Considering the particle differential flux
where
For a given organ/tissue T and radiation type R, we use our GCR modulation model to calculate the differential flux
Here
with a scale factor
3 Results
In the following, we present observational and numerical results for the radiation absorbed dose rates of GCRs during a flight to Mars (in silicon). The MSL spacecraft was launched to Mars on 26 November 2011. During most of the 253-day, 560-million-kilometer cruise to Mars, the RAD instrument made detailed measurements of the energetic particle radiation environment inside the spacecraft [23]. In the following, we use the dosimetry data from the MSL-RAD silicon detector B, as our model focuses on the dose rate from GCR charged particles in free space (excluding neutral particles such as neutrons), which aligns with the measurement capability of detector B. The data are sourced from the digitization of Figure 5 in [23], with the radioisotope thermoelectric generator (RTG) background already subtracted. The radiation measurements during the 7-month cruise to Mars exhibit characteristic variability patterns - including
Figure 1 shows the GCR radiation absorbed dose rate (in silicon) with the horizontal axis tracking the spacecraft’s transit time from Earth to Mars. The silver solid line with solid circles represents the absorbed dose rate detected by MSL-RAD/B, while the black solid line shows the smoothed result. As can be seen from the figure, the observed values of absorbed dose rate exhibit relatively severe fluctuations, which may be caused by local disturbances in the space environment. The blue solid and dash-dotted lines represent the modeling results from the BON11 model, without and with pion contributions, respectively [3].
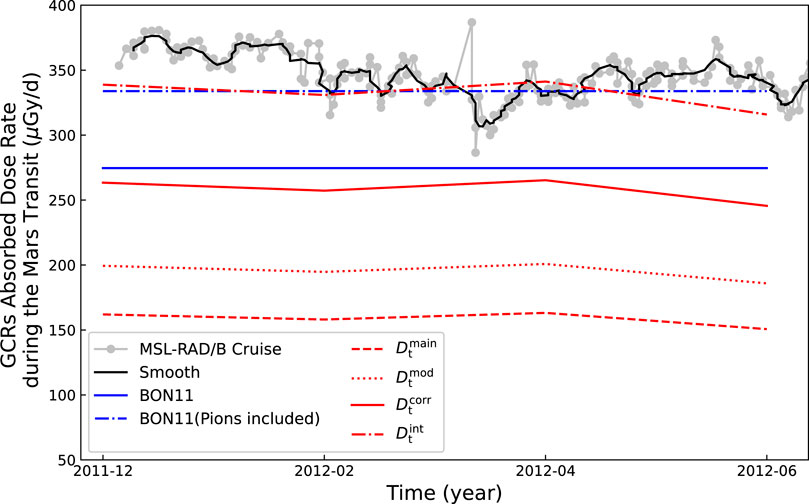
Figure 1. The GCRs radiation absorbed dose rates during a flight to Mars (in silicon). The silver solid line with solid circles represents the absorbed dose rate detected by MSL-RAD/B, while the black solid line shows the smoothed result. The blue solid and dash-dotted lines show the modeling results from the BON11 model without and with pion contributions, respectively. The red dashed line indicates the absorbed dose rates from the four main GCR particles calculated by our model,
In order to calculate the absorbed dose rates, we performed numerical simulations to solve the modulation model, i.e., the Parker transport equation of GCRs in the heliosphere, Equation 1, during the MSL spacecraft’s traveling from the Earth to the Mars. Figure 2 illustrates the interplanetary conditions, including the solar tilt angle, magnetic turbulence magnitude

Figure 2. Interplanetary conditions during the Earth-to-Mars transit (December 2011 - June 2012). Top panel: Tilt angle of the heliospheric current sheet from the WSO website using the new model. Second panel: Square root of the magnetic field variances, representing the magnetic turbulence magnitude. Third panel: Monthly sunspot number from WDC-SILSO. Bottom panel: Radial distance of the MSL spacecraft from the Sun.
In Figure 1, we present the GCR absorbed dose rates (in silicon) as predicted by our model. The red dashed line represents the absorbed dose rates due to the four main GCR species-hydrogen (H), helium (He), oxygen (O), and iron (Fe)-calculated using simulations based on the GCR modulation equation, denoted as
The results from Figure 1 indicate that, after correcting for the underestimation noted by [10], the results of
4 Summary and discussion
In this study, we calculate the charged GCR radiation absorbed dose rate during a flight to Mars in free space, based on the GCR radiation dose rate model developed in previous work by [10]. Firstly, we use the GCR modulation model to calculate the differential flux
The scaling factor
The discrepancies between our simulation results and observational data primarily stem from the following sources: First, inaccuracies in the GCR modulation model arise due to an oversimplified representation of magnetic turbulence and the heliospheric structure, along with insufficient consideration of localized and transient solar variations. These limitations diminish the model’s ability to fully reproduce the observed particle fluxes. Second, uncertainty is introduced in the estimation of contributions from less abundant particle species. Rather than performing explicit numerical simulations for these minor components, we relied on widely accepted abundance ratios from established literature, which may not capture the specific environmental conditions during the observation period. Third, the calculation of dose averages across 15 organs/tissues specified by the ICRP reference phantoms [4] –while providing a representative whole-body value–may overlook anatomical variations and tissue–specific energy deposition patterns, potentially introducing inaccuracies in biological dose estimation. Fourth, the use of a constant conversion coefficient between water and silicon-based dose measurements neglects energy-dependent and material-specific effects in radiation energy deposition. This simplification fails to fully represent the complex particle interactions within different detector and tissue materials. Finally, methodological differences between computational dose assessments and physical measurements contribute to the discrepancies. While our simulation follows ICRP guidelines for radiation protection quantities, the MSL-RAD measurements were obtained using a silicon detector located inside the MSL spacecraft during its journey to Mars, positioned directly beneath the descent stage and above the heat shield. This difference in phantom geometry, material composition, and shielding configuration between computational models and physical detectors introduces inherent inconsistencies in dose comparisons. Our model is currently primarily used for calculating GCR radiation doses in free space and does not yet account for secondary particle effects under different shielding conditions. Therefore, future work will require the use of a dedicated simulation model, such as GEANT4, to evaluate radiation doses under various shielding conditions. For such validation, measurements from the MSL-RAD scintillator detector E will be prioritized, as its tissue-equivalent composition and heightened sensitivity to low-energy secondary particles (e.g., electrons, gammas, and neutrons) provide a more relevant benchmark for assessing the total absorbed dose inside a spacecraft.
Data availability statement
The original contributions presented in the study are included in the article/supplementary material, further inquiries can be directed to the corresponding author.
Author contributions
DL: Writing – original draft. GQ: Writing – review and editing.
Funding
The authors declare that financial support was received for the research and/or publication of this article. DL and GQ acknowledge support from the National Natural Science Foundation of China (NSFC) (Grant No. 42374190), the Shenzhen Science and Technology Program (Grant No. JCYJ20250604145503005 and Grant No. JCYJ20210324132812029), the National Key Research and Development Program of China (Grant Nos. 2021YFA0718600 and 2022YFA1604600), the Shenzhen Key Laboratory Launching Project (Grant No. ZDSYS20210702140800001), and the Strategic Priority Research Program of the Chinese Academy of Sciences (Grant No. XDB 41000000).
Acknowledgements
The work was carried out at National Supercomputer Center in Tianjin, and the calculations were performed on TianHe-3F.
Conflict of interest
The authors declare that the research was conducted in the absence of any commercial or financial relationships that could be construed as a potential conflict of interest.
Generative AI statement
The authors declare that no Generative AI was used in the creation of this manuscript.
Any alternative text (alt text) provided alongside figures in this article has been generated by Frontiers with the support of artificial intelligence and reasonable efforts have been made to ensure accuracy, including review by the authors wherever possible. If you identify any issues, please contact us.
Publisher’s note
All claims expressed in this article are solely those of the authors and do not necessarily represent those of their affiliated organizations, or those of the publisher, the editors and the reviewers. Any product that may be evaluated in this article, or claim that may be made by its manufacturer, is not guaranteed or endorsed by the publisher.
References
1. Simpson JA. Elemental and isotopic composition of the galactic cosmic rays. Annu Rev Nucl Part Sci (1983) 33:323–82. doi:10.1146/annurev.ns.33.120183.001543
2. Durante M, Cucinotta FA. Physical basis of radiation protection in space travel. Rev Mod Phys (2011) 83:1245–81. doi:10.1103/revmodphys.83.1245
3. Zeitlin C, Hassler DM, Cucinotta FA, Ehresmann B, Wimmer-Schweingruber RF, Brinza DE, et al. Measurements of energetic particle radiation in transit to Mars on the Mars science. Science (2013) 340(6136):1080–4. doi:10.1126/science.1235989
4. Dietze G, Bartlett D, Cool D, Cucinotta F, Jia X, McAulay I, et al. ICRP PUBLICATION 123: assessment of radiation exposure of astronauts in space. Ann ICRP (2013) 42:1–339. doi:10.1016/j.icrp.2013.05.004
5. Berger T, Matthiä D, Burmeister S, Zeitlin C, Rios R, Stoffle N, et al. Long term variations of galactic cosmic radiation on board the international space station, on the moon and on the surface of Mars. J Space Weather Space Clim (2020) 10:34. doi:10.1051/swsc/2020028
6. Hassler DM, Zeitlin C, Wimmer-Schweingruber RF, Böttcher S, Martin C, Andrews J, et al. The radiation assessment detector (RAD) investigation. Space Sci Rev (2012) 170:503–58. doi:10.1007/s11214-012-9913-1
7. Mrigakshi AI, Matthiä D, Berger T, Reitz G, Wimmer-Schweingruber RF. How galactic cosmic ray models affect the estimation of radiation exposure in space. Adv Space Res (2013) 51(5):825–34. doi:10.1016/j.asr.2012.10.017
8. Schwadron NA, Boyd AJ, Kozarev K, Golightly M, Spence H, Townsend LW, et al. Galactic cosmic ray radiation hazard in the unusual extended solar minimum between solar cycles 23 and 24. Space Weather (2010) 8(A6):S00E04. doi:10.1029/2010sw000567
9. Cucinotta FA, Schimmerling W, Wilson JW, Peterson LE, Badhwar GD, Saganti PB, et al. Space radiation cancer risks and uncertainties for Mars missions. Radiat Res (2001) 156(5):682–8. doi:10.1667/0033-7587(2001)156[0682:srcrau]2.0.co;2
10. Lyu D, Qin G, Shen Z -N. Long-term variation of the galactic cosmic ray radiation dose rates. Space Weather (2024) 22(1):e2023SW003804. doi:10.1029/2023sw003804
11. Qin G, Shen ZN. Modulation of galactic cosmic rays in the inner heliosphere, comparing with PAMELA measurements. ApJ (2017) 846:56. doi:10.3847/1538-4357/aa83ad
12. Shen ZN, Qin G. Modulation of galactic cosmic rays in the inner heliosphere over solar cycles. ApJ (2018) 854:137. doi:10.3847/1538-4357/aaab64
13. Shen ZN, Qin G, Zuo P, Wei F. Modulation of galactic cosmic rays from helium to nickel in the inner heliosphere. ApJ (2019) 887:132. doi:10.3847/1538-4357/ab5520
14. Sato T, Endo A, Zankl M, Petoussi-Henss N, Niita K. Fluence-to-dose conversion coefficients for neutrons and protons calculated using the PHITS code and ICRP/ICRU adult reference computational phantoms. Phys Med Biol (2009) 54:1997–2014. doi:10.1088/0031-9155/54/7/009
15. Sato T, Endo A, Niita K. Fluence-to-dose conversion coefficients for heavy ions calculated using the PHITS code and the ICRP/ICRU adult reference computational phantoms. Phys Med Biol (2010) 55:2235–46. doi:10.1088/0031-9155/55/8/008
16. Parker EN. The passage of energetic charged particles through interplanetary space. Planet Space Sci (1965) 13:9–49. doi:10.1016/0032-0633(65)90131-5
17. Webber WR, Cummings AC, McDonald FB, Stone EC, Heikkila B, Lal N. Galactic cosmic ray H and he nuclei energy spectra measured by voyagers 1 and 2 near the heliospheric termination shock in positive and negative solar magnetic polarity cycles. J.Geophys Res Space Phys (2008) 113:A10108. doi:10.1029/2008ja013395
18. Zhang M. A markov stochastic process theory of cosmic-ray modulation. ApJ (1999) 513:409–20. doi:10.1086/306857
19. Kopp A, Büsching I, Strauss RD, Potgieter MS. A stochastic differential equation code for multidimensional fokker-planck type problems. Computer Phys Commun (2012) 183:530–42. doi:10.1016/j.cpc.2011.11.014
20. Qin G, Zhang M, Dwyer JR. Effect of adiabatic cooling on the fitted parallel mean free path of solar energetic particles. ApJ (2006) 111:A08101. doi:10.1029/2005ja011512
21. Pei C, Bieber JW, Burger RA, Clem J. A general time-dependent stochastic method for solving Parker’s transport equation in spherical coordinates. J Geophys Res Space Phys (2010) 115:A12107. doi:10.1029/2010ja015721
22. Potgieter MS, Vos EE, Boezio M, De Simone N, Di Felice V, Formato V. Modulation of galactic protons in the heliosphere during the unusual solar minimum of 2006 to 2009. Sol Phys (2014) 289:391–406. doi:10.1007/s11207-013-0324-6
23. Zeitlin C, Hassler DM, Wimmer-Schweingruber RF, Ehresmann B, Appel J, Berger T, et al. Calibration and characterization of the radiation Assessment detector (RAD) on curiosity. Space Sci Rev (2016) 201:201–33. doi:10.1007/s11214-016-0303-y
24. Löwe JL, Khaksarighiri S, Wimmer-Schweingruber RF, Hassler DM, Ehresmann B, Guo J, et al. Nowcasting solar energetic particle events for Mars missions. Space Weather (2025) 23(4):e2025SW004372. doi:10.1029/2025sw004372
25. Schwadron NA, Townsend L, Kozarev K, Dayeh MA, Cucinotta F, Desai M, et al. Earth-moon-mars radiation environment module framework. Space Weather (2010) 8(10):S00E02. doi:10.1029/2009sw000523
26. McKenna LS, Gonçalves P, Keating A, Matthiä D. Overview of energetic particle hazards during prospective manned missions to Mars. Planet Space Sci (2012) 63:123–32. doi:10.1016/j.pss.2011.06.017
27. O'Neill PM. Badhwar–O’Neill 2010 galactic cosmic ray flux model—revised. IEEE Trans Nucl Sci (2010) 57(6):3148–53. doi:10.1109/TNS.2010.2083688
Keywords: galactic cosmic rays, radiation dose, Mars, simulation, solar activity
Citation: Lyu D and Qin G (2025) Model calculation of charged galactic cosmic ray radiation dose during a flight to Mars. Front. Phys. 13:1715300. doi: 10.3389/fphy.2025.1715300
Received: 29 September 2025; Accepted: 19 November 2025;
Published: 02 December 2025.
Edited by:
Guram Kervalishvili, GFZ Helmholtz Centre for Geosciences, GermanyReviewed by:
Bent Ehresmann, Southwest Research Institute Boulder, United StatesSalman Khaksari, University of Kiel, Germany
Copyright © 2025 Lyu and Qin. This is an open-access article distributed under the terms of the Creative Commons Attribution License (CC BY). The use, distribution or reproduction in other forums is permitted, provided the original author(s) and the copyright owner(s) are credited and that the original publication in this journal is cited, in accordance with accepted academic practice. No use, distribution or reproduction is permitted which does not comply with these terms.
*Correspondence: Gang Qin, cWluZ2FuZ0BoaXQuZWR1LmNu