 Wei Sun
 Linya Liu1,3
- 1State Key Laboratory of Safety and Resilience of Civil Engineering in Mountain Arca, East China Jiaotong University, Nanchang, Jiangxi, China
- 2Department of Architectural Engineering, Jiangxi Vocational and Technical College of Communications, Nanchang, Jiangxi, China
- 3Pingxiang University, Pingxiang, Jiangxi, China
Environmental vibrations induced by subway systems are typically mitigated through track-based isolation measures, which are effective only in localized areas. Extending such solutions along entire lines involves prohibitive costs. To address this limitation, this study investigates the application of resilient wheels as a vehicle-based solution for mitigating vibrations across the entire line by controlling excitation at the source. A frequency-domain environmental vibration prediction model coupled with a wheel–rail interaction model is established using the 2.5D FEM–BEM approach. The simulation results are validated against field measurements, confirming the model’s accuracy. Based on the validated model, the influence of key parameters of the resilient wheel, including mass, rubber stiffness, and damping—on environmental vibration is systematically analyzed. The results demonstrate that increasing the mass of the resilient wheel lowers the P2 resonance frequency but leads to a disproportionate increase in wheel–rail force. Reducing rubber stiffness shifts the P2 force toward lower frequencies and reduces environmental vibration by up to 8 dB, while increasing rubber damping effectively suppresses the P2 resonance peak, achieving a maximum vibration reduction of 2.7 dB. This study confirms that resilient wheels offer a technically viable and economically efficient strategy for line-wide environmental vibration control.
1 Introduction
Recently, subway systems have been undergoing rapid expansion in China. Although this development facilitates urban mobility, when subways pass through densely populated urban centers, ground and tunnel vibrations induced by train operations lead to structural vibrations and secondary noise in the surrounding environment, posing significant challenges to the quality of life for residents along the lines [1, 2]. In addition to conventional wheel-rail systems, growing research attention is being directed toward the vehicle-guideway coupled vibration characteristics and their control in emerging maglev transportation systems [3].
Environmentally transmitted vibrations and secondary structure-borne noise can be categorized into three distinct domains: vibration source control, propagation path mitigation, and receptor management. This classification offers a systematic framework for understanding and addressing the various facets of vibration and noise mitigation. It is widely acknowledged that interventions targeting the vibration source and its propagation path, such as trench isolation [4], building foundation isolation [5], or room-within-room systems [6], which are generally more cost-effective and efficient than measures applied at the receiver end. Therefore, this part will focus primarily on strategies for regulating vibration sources and propagation paths.
The excitation sources of environmental vibrations include parametric excitation from the track structure and coupled irregularities at the wheel-rail interface [7]. Typically, wheel irregularities generate excitations within the frequency range relevant to environmental vibrations. Through wheel reprofiling [8], impact forces can be substantially reduced, leading to decreased dynamic wheel-rail interaction and, notably, mitigation of the P2 resonance force, which plays a critical role in environmental vibration control. Similarly, track irregularities can be mitigated via rail grinding techniques [9].
In terms of vehicle-side control, Mirza [10] conducted a comprehensive investigation into the influence of electric multiple unit (EMU) train parameters on rail-induced vibration, identifying the stiffness of the primary suspension as the most influential factor. Higher primary suspension stiffness or increased unsprung mass was found to correlate with elevated environmental vibration levels. Variations in geometric parameters, such as wheelbase and bogie configuration, primarily result in frequency shifts [10]. Li [11] employed an analytical model combined with field measurements to identify the wheel–rail vertical contact force and applied it to predict ground-borne vibration. Another study [12] demonstrated that resilient wheels can effectively reduce ground vibration induced by track irregularities. Furthermore, deep learning techniques have shown rapid advancement in engineering applications [13–15] and hold considerable potential in areas such as vibration detection. Particularly noteworthy is that transfer learning-based prediction methods, by integrating simulated and experimental data, effectively address the issue of prediction accuracy caused by scarce vibration data [16].
Control measures along the propagation path in the track system include elastic fasteners [17], sleeper pads or damping mats [18], and floating slab tracks [19]. These measures attenuate vibration in the operational frequency range by introducing lower stiffness in the support or isolation layers. For propagation control within the ground medium, subgrade reinforcement beneath the track has been shown to effectively reduce ground vibration [20], particularly when quasi-static excitation is a dominant contributor [21]. Additional ground-layer propagation control strategies encompass wave barriers [22], vibration isolation trenches [23], pile-row isolation systems [24], wave-blocking techniques [25], and the placement of heavy masses adjacent to the track [26] to impede the transmission of elastic waves from the railway to nearby underground structures.
To sum up, the control measures for environmental vibration caused by trains mainly take measures on track structure or subgrade. However, the subway line is long and the cost of this way to reduce environmental vibration becomes very high. Elastic wheels can significantly alter the wheel receptance in the medium-to-low frequency range, thereby modifying the wheel-rail forces below the P2 resonance frequency [27, 28]. This offers a potential means of mitigating environmental vibrations. Compared to the traditional vibration mitigation measures for tracks or soil discussed earlier, implementing control measures at the wheel can effectively address environmental vibration pollution along the entire line, substantially reducing mitigation costs. This paper first establishes a vibration response prediction model for the elastic wheel. The wheel-rail forces are then derived based on a frequency-domain wheel-rail interaction model. Finally, these forces are applied to a tunnel-soil system model, established using the 2.5D FEM-BEM, to determine the impact of elastic wheels on metro-induced environmental vibrations (Section 2). The accuracy of this model is validated through field measurements (Section 3). Based on the validated model, the influence of elastic wheel parameters is further investigated, thereby aiming to mechanistically identify the optimal parameters of resilient wheels for mitigating the environmental vibration (Section 4).
2 Establishment of environmental vibration model
The prediction model for subway-induced environmental vibrations established in this study comprises two subsystems: the vehicle-track system and the tunnel-ground system. The vehicle-track interaction is modeled by a vertical wheel-rail coupling model. The tunnel-ground system, on the other hand, is simulated using a 2.5D FEM-BEM approach [29]. The coupling between these two subsystems is implemented following the methodology described in Ref. [30].
2.1 Vehicle dynamic model
As stated in the reference, a multi-rigid body half-vehicle concept is suggested. [30]. The vehicle model contains a half-carbody, two 1/2 bogies, four 1/2 wheelsets and suspension system. Vehicle vibration’s differential equation is Equation 1.
where Mvh is identified as vehicle mass matrix,
According to reference [30–32], the weighs of the resilient wheel is 393 kg, and the weighs of a common wheel is 328 kg. In this paper, it is considered as a mass-spring damping system, as shown in Figure 1. It is possible to determine that the robust wheel’s radial and transverse decoupling frequencies are 87.6 Hz and 125.3 Hz, respectively. The radial connection stiffness between rim and web of the resilient wheel is 125.2 kN/mm. A rim weighs 202 kg and has a damping ratio of 0.03.

Figure 1. Dynamic model and decoupled mode of resilient wheel. (a) Schematic diagram of resilient wheel structure and equivalent model. (b) Transverse decoupling modes (87.6 Hz). (c) Radial decoupling modes (125.3 Hz).
2.2 Dynamic model of track
From the topmost layer to the bottommost level, the track system is comprised of rail, fastening system, slab, self-compacting concrete and concrete base. The rail and slab are simulated as Euler’s beam model with continuous support, the fastening system and self-compacting concrete are considered as damping springs, and the concrete base is considered as rigidity. In the model, the stiffness of a single fastening was divided by 0.625 m of the sleeper span, and the stiffness per meter was obtained as the calculated value. The differential equation of track has the following form in the wavenumber domain Equation 2.
where kf is the stiffness of fastening, kp is the stiffness of self-compacting concrete, the terms Er Ir and EsIs refer to the flexibility resistance to bending exhibited by the rail and slab structure, respectively, as well as mr and ms, mass and mass of the slab, wr and ws, the vertical deviation or shifting of the rail and slab, β is the wavenumber, and Fr is the wheel/rail force.
2.3 Model of wheel/rail interaction
The source of excitation within the vehicle-track system originates from the dynamic force of interaction between the wheel and rail. Notably, the vertical long-wave irregularity present in the track is the primary contributor to the vibration experienced by the wheel-rail system at frequencies below 200 Hz [31]. In this work, the track vertical irregularity-based vertical excitation model proposed in Ref. [31] is adopted to determine how the wheel/rail system responds to force under unit roughness of different wavelengths.In conjunction with the track irregularity power spectrum, the system’s input excitation can be acquired. A depiction of the coupled vehicle-track model is presented in Figure 2. There is Hertz contact between wheelset and rail. Assuming that wheelset and rail does not separate, the displacement matching equation between wheel-rail can be obtained as Equation 3 [31]:

Figure 2. Vertical-track coupling model.
where
2.4 Tunnelling-ground model based on 2.5D FEM-BEM
Given that the tunnel-ground system extends indefinitely in the longitudinal dimension and possesses a substantial cross-sectional area. A large amount of computational time will be consumed if the 3D numerical model is used. The 2.5D FEM-BEM fully considers the characteristics of infinite-length structure and discretizes the wavenumber of the coordinates in the length direction by Fourier transform. It only needs to mesh the cross section and calculate the response corresponding to each wavenumber, the inverse Fourier transform can be used to determine the real response. In contrast to the 3D model, the computational efficiency is greatly improved. The system’s equation has the following form based on the 2.5D FEM [29], as shown in Equation 4.
Fourier transform is given by Equation 5.
where K0, K1, and K2 are the correlation stiffness matrix of the system, M is the system’s mass matrix,
Ω is the load excitation frequency, and c is the speed of load movement.
According to the 2.5D BEM, the system equation is given by Equation 7 [29]:
where H and G are the matrix system of the elastomer,
3 The verification of the model
To gain insights into the irregularity state of the line, and to facilitate comparison with simulation data, it is imperative to conduct tests that encompass the track irregularity and the tunnel wall’s acceleration level during train operation. The results of this measurement were used to validate the model with the model developed in this paper to confirm if the model is accurate.
3.1 Description of the measurement
The test cross section is located in the shield tunnel of a subway line in China. The train is traveling at 70 km/h through this cross section. To determine the line’s state of irregularity and compare it with the simulation, testing the track irregularity is essential. and the magnitude of acceleration experienced by the tunnel wall during the operational state of the train. The test of track irregularity was carried out in accordance with the recommended national standard (GB/T 19,846-2005), and the test point was located on the side of the tunnel wall, 1.2 m higher than the rail surface. The test range of acceleration sensor is 7 g. The tunnel’s cross section and acceleration measurement location are displayed in Figure 3.

Figure 3. Cross section and acceleration measurement point of tunnel. (a) Cross section of tunnel (b) Photo of acceleration measurement point of tunnel.
3.2 Wheel/rail combined irregularity power spectrum used in the model
Figure 4 shows the power spectrum density (PSD) of combined wheel/rail irregularity connected with the measured roughness and the American Grade-5 Track Irregularity Spectrum, which has been proven to effectively restore the wheel/rail irregularity of the urban subway [33]. Track irregularity is measured by a CAT tester. Due to the limitations of the test instrument, the longest measured wavelength of irregularity can only reach 2 m, and the vehicle speed corresponding to 70 km/h can only cover the wheel/rail excitation frequency above 9.7 Hz, which can cover some main frequency of environmental vibration [34]. However, the concern frequency for environmental vibration is 1–80 Hz, so it is necessary to supplement the long-wave irregularity PSD of the American Grade-5 Track Irregularity Spectrum to obtain the combined irregularity PSD of wheel/rail covering the range of high and low frequencies.

Figure 4. PSD of combined wheel/rail irregularity.
The wheel out-of-roundness (OOR) and rail corrugation also constitute a significant source of wheel-rail excitation. The rail corrugation is particularly common in metro systems. However, rail corrugation primarily occurs on sharp curves with small radii in subway tunnels, where traditional frequency-domain wheel-rail interaction models are less applicable. Furthermore, both rail corrugation and wheel OOR manifest in diverse forms, and there is currently no internationally standardized quantitative evaluation spectrum specifically for their characterization in metro applications. Consequently, the influence of these two excitation mechanisms was not included in the present study.
3.3 Comparison between simulation results and measured results
According to the local geological survey report and design drawings, the parameters of ground layer and tunnel structure can be obtained as shown in Table 1. The inner diameter of the tunnel measures 5.4 m, whereas the outer diameter spans 6 m and the buried depth is 17 m. The tunnel and track structures were modeled using a 2.5D FEM, with an element size of approximately 0.1 m. In Figure 5, the tunnel-ground model is displayed. The stratified geodesic structure is simulated by the 2.5D BEM, and the element size is 0.5 m. The finite domain was discretized into 128 four-node quadrilateral elements, and the boundary was represented by 300 three-node elements. The numerical integration step size in the wavenumber domain is set to 0.1 rad/m, which ensures the convergence and stability of the solution. The excitation frequency is discretized from 0 Hz to 200 Hz with a step size of 1 Hz, covering the primary range of ground vibrations induced by train operations. The distance situated between the margin and the central axis of the tunnel constitutes the 30 m ground layer cut-off width, and it decays exponentially at the ground cut-off [29].

Table 1. Parameters of tunnel-ground model.

Figure 5. Tunnel-ground model.
The track structure is a common overall track bed structure, and Table 2 displays the track parameters. The vehicle is an A-type subway car that can go at 70 km/h. Table 3 displays the vehicle’s important specifications.

Table 2. Parameters of track.

Table 3. Parameters of A-type subway vehicle.
The simulation of the tunnel wall’s vibration acceleration level is undertaken and subsequently compared with the vibrational spectrum data acquired from the experimental testing by substituting the aforementioned parameters into the environmental vibration prediction model for calculation, as seen in Figure 6. Figure 7 illustrates the relevant wheel/rail interaction force.

Figure 6. Predicted and measured results of spectrum of acceleration level of tunnel wall.

Figure 7. Force interaction between wheel and rail.
Figures 6, 7 show that there is a maximum value close to 63 Hz. In general, the vibration follows the wheel/rail force law. The wheel/rail P2 resonance force is primarily responsible for the peak value of 63 Hz. Through the comparison between simulation and test, it can be seen that the trend and amplitude of the test value within 3.15–80 Hz are in good agreement. Due to the great complexity of the actual structure, for example, the model does not consider the periodicity of fastener and slab, the actual tunnel wall is a segment structure rather than a continuous structure, and the material parameters are also uncertain, which leads to some errors in the prediction above 80 Hz. But in general, the model meets the accuracy of environmental vibration prediction.
4 Influence of resilient wheel on the vibration of tunnel wall
The wheel/rail forces, the receptance of wheel at wheel/rail contact point, as well as the tunnel wall, of the resilient wheel and the steel wheel are displayed in Figures 8–10 in order to investigate the impact of resilient wheels on environmental vibration. Resilient wheel rubber currently has a loss factor of 0.2.

Figure 8. The wheel/rail force of sturdy and typical wheels.

Figure 9. The wheel/rail force of sturdy and typical wheels.

Figure 10. Z-weighted tunnel wall acceleration level comparison.
It is visible in Figure 8 that the introduction of resilient wheel aggravates the vehicle’s unsprung mass, thus causing the peak frequency of wheel/rail P2 force to move to low frequency. The introduction of resilient wheel leads to the amplification of wheel/rail force below 60 Hz, but has a certain inhibiting effect on wheel/rail force above 60 Hz. The P2 force is determined by the intersection point of the wheel and track receptance, which are in phase opposition. In the frequency range below 60 Hz, the track receptance exhibits minimal frequency dependence and is primarily governed by the vertical stiffness of the rail pad. Consequently, the elastic wheel exhibits a lower P2 force magnitude in this range due to its smaller receptance. As clearly observed in Figure 9, this attenuated magnitude originates from an anti-resonance trough of a mode at 116 Hz. This mode, identifiable in Figure 9, is associated with the vertical vibration of the elastic wheel’s rim on its rubber support—a phenomenon absent in the rigid wheel.
It is visible in Figure 10 that the introduction of resilient wheel aggravates the environmental vibration at low frequency, but decreases the environmental vibration at high frequency, which is basically similar to the law of wheel-rail force. The introduction of resilient wheel is beneficial to reduce the total environmental vibration by 1.6 dB. This is primarily due to the lower dominant excitation frequency from the P2 force. A lower excitation frequency results in reduced acceleration levels, which in turn leads to a lower Z-vibration level, as it is derived from the frequency-weighted equivalent acceleration.
The rubber elastomer is positioned between the rim and the web in a resilient wheel, which sets it apart from a typical wheel. After decoupling frequencies, a robust wheel is heavier than a typical wheel, however the separation of the rim and web lessens interactions between the vehicle and the track. Therefore, weight of resilient wheel, rubber stiffness and rubber damping are the key parameters for environmental vibration control. Therefore, the influence of weight, rubber stiffness and rubber damping on environmental vibration is analyzed in this section. A table of specific parameters is shown in Table 4 below.

Table 4. Investigation parameters.
4.1 The influence of weight
In the actual use of resilient wheel, the rim thickness will not be changed in order to consider wear and other characteristics. So, the weight of the rim basically remains the same. However, the total mass or web mass will change in order to fix the rubber material. Therefore, in Figures 11–13, The impact of robust wheels with different weights on wheel/rail forces and tunnel wall environmental vibration is explored.
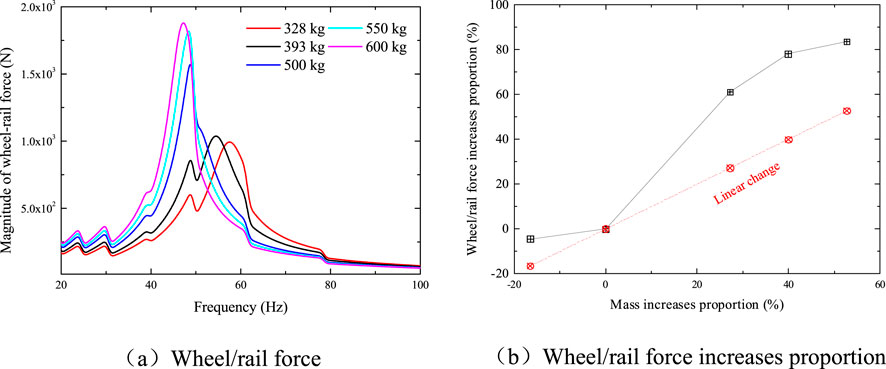
Figure 11. Influence of weight on wheel/rail force. (a) Wheel/rail force. (b) Wheel/rail force increases proportion.

Figure 12. Influence of weight on the frequency spectrum of Z-weighted acceleration level of tunnel wall.
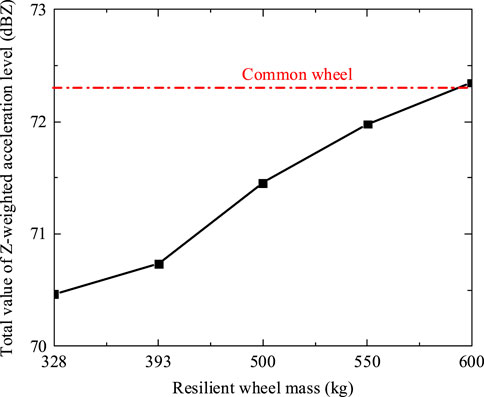
Figure 13. Influence of weight on the total value of Z-weighted acceleration level of tunnel wall.
It is visible in Figure 11 that the greater the mass of resilient wheel, the lower the wheel/rail P2 resonance frequency and the greater the maximum value. More wheel/rail force has increased than robust wheel mass has increased (wheel/rail force can grow to 83.5% at a mass increase of 52.7%). Therefore, controlling the mass of resilient wheel is a crucial factor. If the mass of resilient wheel is too large, the low-frequency wheel/rail interaction may be worsened.
Figures 12, 13 show that tunnel wall vibration spectrum shifts to low frequency and the peak value increases with the increase of resilient wheel mass. So, the increase of resilient wheel mass is not conducive to reducing environmental vibration. The larger the weight of the resilient wheel, the larger the total value of Z-weighted acceleration level of the tunnel wall. When the robust wheel’s mass surpasses 600 kg, the resilient wheel does not have the effect of reducing environmental vibration.
4.2 The influence of stiffness
Distinct from conventional wheels, resilient wheels incorporate a rubber elastomer positioned between the rim and the web. Consequently, the stiffness and damping characteristics of the resilient wheel rubber are of paramount importance. To investigate how resilient wheel rubber stiffness affects vibration in the surrounding environment, the influence of different rubber stiffness on wheel/rail force and environmental vibration of tunnel wall are presented in Figures 14–16.

Figure 14. Influence of stiffness on wheel/rail force.
Evidently, Figure 14 shows that wheel/rail resonance P2 force moves to low frequency and its amplitude decreases with the decrease of elastic wheel rubber stiffness.
Figures 15, 16 illustrate that as the stiffness of the elastic wheel rubber decreases, the peak frequency of the tunnel wall vibration spectrum shifts towards lower frequencies, adhering closely to the principle governing wheel-rail force dynamics. As the stiffness of the resilient rubber wheel diminishes, the Z-weighted acceleration level experienced by the tunnel wall undergoes a decrease. The resilient wheel can have better effect of environmental vibration reduction, can reduce the Z-weighted acceleration level 8 dB highest. It is noteworthy that the inflexibility of the lower limit of determine the need for the operation safety evaluation system. In this paper, stiffness is discussed extensively in terms of noise reduction effect. When the resilient wheel’s rubber stiffness is 1252 kN/mm, the resilient wheel can not play the role of vibration reduction, and even amplify the environmental vibration.

Figure 15. Influence of stiffness on frequency spectrum of Z-weighted acceleration level of tunnel wall.

Figure 16. Influence of stiffness on total value of Z-weighted acceleration level of tunnel wall.
4.3 The influence of damping
Having comprehended the impact of rubber stiffness on environmental vibrations, Figures 17, 18 present an analysis of how varying rubber damping loss factors influence both the wheel/rail force and the environmental vibrations of the tunnel wall.

Figure 17. Influence of damping on wheel/rail force.

Figure 18. Influence of damping on frequency spectrum of Z-weighted acceleration level of tunnel wall.
As rubber damping increases, Figure 17 illustrates how the amplitude of the wheel/rail resonance P2 force diminishes. The amplitude of other frequencies almost does not change. Therefore, appropriately increasing the rubber damping on robust wheels is conducive to improving wheel/rail relationship and reducing the wheel/rail’s maximum value P2 resonance force.
Figures 18, 19 exhibit a trend where the peak value of the vibration spectrum diminishes as the rubber damping increases, adhering to the fundamental principles governing wheel-rail force dynamics. With the increase of rubber damping, the Z-weighted acceleration level of tunnel wall gradually decreases. The maximum environmental vibration can be reduced by 2.7 dB.

Figure 19. Influence of damping on total value of Z-weighted acceleration level of tunnel wall.
5 Conclusion
A wheel/rail interaction model and an environmental vibration prediction model in frequency domain are established by utilizing the 2.5D FEM-BEM. From the perspective of wheel-rail interaction, the resilient wheel is designed to mitigate the wheel-rail force, attenuate the propagation of vibrations to the tunnel and ground, and thereby effectively regulate environmental vibrations along the subway line. The ensuing deductions are made.
1. The greater the mass of resilient wheel, the lower the wheel/rail P2 resonance frequency. The increase of wheel/rail force is greater than the increase of resilient wheel mass (when the mass increase is 52.7%, the increase of wheel/rail force is up to 83.5%). Therefore, controlling the mass of resilient wheel is a crucial factor. If the mass of resilient wheel is too large, the low-frequency wheel/rail interaction may be worsened.
2. With the reduction of rubber stiffness of resilient wheel, the wheel/rail resonance P2 force shifts to a low frequency, and then reduces the environmental vibration up to 8 dB.
3. As rubber damping on robust wheels increases, the amplitude of wheel/rail resonance P2 force decreases, and the amplitude of other frequencies almost does not change. Therefore, appropriately increasing the rubber damping of resilient wheel is advantageous to lessen the peak value of wheel/rail P2 resonance force, and then reduce the environmental vibration. The maximum environmental vibration can be reduced by 2.7 dB.
Data availability statement
The raw data supporting the conclusions of this article will be made available by the authors, without undue reservation.
Author contributions
WS: Writing – review and editing, Writing – original draft. LL: Funding acquisition, Writing – review and editing. GC: Data curation, Writing – review and editing.
Funding
The authors declare that financial support was received for the research and/or publication of this article. Financial support for this study was supported via the National Natural Science Foundation of China (NO. 52272348), China Postdoctoral Fund Project (NO. 2023M741156), Natural Science Foundation of Jiangxi Province (NO. 20232BAB214095), Science and Technology Research Project of Jiangxi Provincial Department of Education (GJJ2405312).
Conflict of interest
The authors declare that the research was conducted in the absence of any commercial or financial relationships that could be construed as a potential conflict of interest.
Generative AI statement
The authors declare that no Generative AI was used in the creation of this manuscript.
Any alternative text (alt text) provided alongside figures in this article has been generated by Frontiers with the support of artificial intelligence and reasonable efforts have been made to ensure accuracy, including review by the authors wherever possible. If you identify any issues, please contact us.
Publisher’s note
All claims expressed in this article are solely those of the authors and do not necessarily represent those of their affiliated organizations, or those of the publisher, the editors and the reviewers. Any product that may be evaluated in this article, or claim that may be made by its manufacturer, is not guaranteed or endorsed by the publisher.
References
1. Thompson DJ. Railway noise and Vibration:Mechanisms,Modelling and means of control. Amsterdam: Elsevier Press (2009).
2. Li Q, Song XD, Wu DJ. A 2.5-dimensional method for the prediction of structure-borne low-frequency noise from concrete rail transit bridges. J Acoust Soc Am (2014) 135(5):2718–26. doi:10.1121/1.4871357
3. Yougang S, Fengxing L, Yang W. A survey of coupled vibration characteristics and control methods in maglev transportation: challenges, methods and progress. J Railway Sci Technology (2025). doi:10.1016/j.jrst.2025.10.002
4. Garinei A, Risitano G, Scappaticci L, Castellani F. An optimized method to evaluate the performance of trench isolation for railway-induced vibration. Measurement (2016) 94:92–102. doi:10.1016/j.measurement.2016.07.079
5. Hemsworth B. Reducing groundborne vibrations: State-of-the-art study. J Sound Vibration (2000) 231(3):703–9. doi:10.1006/jsvi.1999.2642
6. Fiala P, Gupta S, Degrande G. A parametric study on countermeasures to mitigate sub-way traffic induced vibration and noise in buildings. Proceedings of ISMA2008 international conference on noise and vibration engineering. Belgium: Railway Dynamics and Ground Vibrations (2008). p. 2751–64.
7. Sheng X, Li M, Jones CJC, Thompson D. Using the Fourier-series approach to study interactions between moving wheels and a periodically supported rail. J Sound Vibration (2007) 303(3-5):873–94. doi:10.1016/j.jsv.2007.02.007
8. Nelson JT. Recent developments in ground-borne noise and vibration control. J Sound Vibration (1996) 193(1):367–76. doi:10.1006/jsvi.1996.0277
9. Grassie SL. Rail irregularities, corrugation and acoustic roughness: characteristics, significance and effects of reprofiling. J Rail Rapid Transit (2012) 226(5):542–57. doi:10.1177/0954409712443492
10. Mirza AA, Frid A, Nielsen J. Ground vibration induced by railway traffic-the influence of vehicle parameters. Notes Numer Fluid Mech Multidisciplinary Des (2012) 118:259–66. doi:10.1007/978-4-431-53927-8_30
11. Li C, Liu W, Liang R. Identification of vertical wheel-rail contact force based on an analytical model and measurement and its application in predicting ground-borne vibration. Measurement (2021) 186:110182. doi:10.1016/j.measurement.2021.110182
12. Kouroussis G, Verlinden O, Conti C. On the interest of integrating vehicle dynamics for the ground propagation of vibrations: the case of urban railway traffic. Vehicle Syst Dyn (2010) 48(12):1553–71. doi:10.1080/00423111003602392
13. Zhang Y, Yuen KV. Time-frequency fusion features-based incremental network for smartphone measured structural seismic response classification. Eng Structures (2023) 278:115575. doi:10.1016/j.engstruct.2022.115575
14. Li L, Zhang Y, Shi Y, Xue Z, Cao M. Surface cracking and fractal characteristics of cement paste after exposure to high temperatures. Fractal and Fractional (2022) 6(9):465. doi:10.3390/fractalfract6090465
15. Zhang Y, Yuen KV. Review of artificial intelligence-based bridge damage detection. Adv Mech Eng (2022) 14(9):16878132221122770. doi:10.1177/16878132221122770
16. Ruihua L, Weifeng L, Chunyang L. Transfer learning-based scoping prediction for train induced ground vibration using both simulated and experimental data. J Railway Sci Technology (2025). doi:10.1016/j.jrst.2025.10.006
17. Wilson GP, Saurenman HJ, Nelson JT. Control of ground-borne noise and vibration. J Sound Vibration (1983) 87(2):339–50. doi:10.1016/0022-460x(83)90573-4
18. Johansson A, Nielsen J, Bolmsvik R, Karlström A, Lundén R. Under sleeper pads-Influence on dynamic train-track interaction. Wear (2008) 265(9-10):1479–87. doi:10.1016/j.wear.2008.02.032
19. Nelson JT, Saurenman HJ. Control of ground-borne noise and vibration. J Sound Vibration (1983) 87(2):339–50. doi:10.1016/0022-460X(83)90573-4
20. Adam D, Vogel A, Zimmermann A. Ground improvement techniques beneath existing rail tracks. Proc Inst Civil Engineers-Ground Improvement (2007) 11(4):229–35. doi:10.1680/grim.2007.11.4.229
21. Peplow AT, Kaynia AM. Prediction and validation of traffic vibration reduction due to cement column stabilization. Ground Dyn Earthquake Eng (2007) 27(8):793–802. doi:10.1016/j.soildyn.2007.01.002
22. Coulier P, François S, Degrande G. Mitigation of railway induced vibrations using stiff wave barriers. 6th international symposium on environmental vibration. Belgium: Department of Civil Enginerring (2013). p. 1–34.
23. Zoccali P, Cantisani G, Loprencipe G. Ground-vibrations induced by trains: filled trenches mitigation capacity and length influence. Construction Building Mater (2015) 74:1–8. doi:10.1016/j.conbuildmat.2014.09.083
24. François S, Schevenels M, Thyssen B. Design and efficiency of a composite vibration isolating screen in ground. Ground Dyn Earthquake Eng (2012) 39:113–27. doi:10.1016/j.soildyn.2012.03.007
25. Takemiya H, Fujiwara A. Wave propagation/impediment in a stratum and wave impeding block (WIB) measured for SSI response reduction. Ground Dyn Earthquake Eng (1994) 13(1):49–61. doi:10.1016/0267-7261(94)90041-8
26. Jones CJC. Use of numerical models to determine the effectiveness of anti-vibration systems for railways. Proceedings of the institution of civil engineers-transport. Scotland: Thomas Telford-ICE Virtual Library (1994). p. 43–51.
27. Jones CJC, Thompson DJ. Rolling noise generated by railway wheels with visco-elastic layers. J Sound Vibration (2000) 231(3):779–90. doi:10.1006/jsvi.1999.2562
28. Rui S, Chenxu L, Lixia S. Analysis of wheel wear and wheel-rail dynamic characteristics of high-speed trains under braking conditions. Shock and Vibration (2024) 32(1):1–16. doi:10.1155/2024/9618500
29. Sheng X, Jones CJC, Thompson DJ. Modelling ground vibration from railways using wavenumber finite-and boundary-element methods. Phys Eng Sci (2005) 461:2043–70. doi:10.1098/rspa.2005.1450
30. Sheng X, Jones CJC, Thompson DJ. Prediction of ground vibration from trains using the wavenumber finite and boundary element methods. J Sound Vibration (2006) 293(3-5):575–86. doi:10.1016/j.jsv.2005.08.040
31. He Y, Zhou Q, Xu F, Sheng X, Han J. An investigation into the effect of rubber design parameters of a resilient wheel on wheel-rail noise. Appl Acoust (2023) 205:109259. doi:10.1016/j.apacoust.2023.109259
32. He Y, Wang X, Han J, Xiao X, Sheng X. Study on the influence of resilient wheels on vibration and acoustic radiation characteristics of suburban railway concrete box girder bridges. Appl Acoust (2022) 187:108529. doi:10.1016/j.apacoust.2021.108529
33. Futong W, Xiaxin T, Xin Z. Inversion of excitation source in ground vibration from urban railway traffic. Sci China Technol Sci (2012) 55(4):10. doi:10.1007/s11431-011-4665-9
Keywords: environmental vibration, wheel-rail interaction, resilient wheel, tunnel wall, 2.5D FEM-BEM
Citation: Sun W, Liu L and Cheng G (2025) Environmental vibration reduction characteristics of subway track with resilient wheel. Front. Phys. 13:1724447. doi: 10.3389/fphy.2025.1724447
Received: 14 October 2025; Accepted: 25 November 2025;
Published: 12 December 2025.
Edited by:
Chun-Hui He, Xi’an University of Architecture and Technology, ChinaReviewed by:
Futong Wang, Heilongjiang University, ChinaJiaxin Lei, Southwest Jiaotong University, China
Copyright © 2025 Sun, Liu and Cheng. This is an open-access article distributed under the terms of the Creative Commons Attribution License (CC BY). The use, distribution or reproduction in other forums is permitted, provided the original author(s) and the copyright owner(s) are credited and that the original publication in this journal is cited, in accordance with accepted academic practice. No use, distribution or reproduction is permitted which does not comply with these terms.
*Correspondence: Wei Sun, MjAxODAxOTA4MjMwMDAwNEBlY2p0dS5lZHUuY24=