 Alina Levchuk
 Philipp Schneider
 Matias Meier
 Peter Vogel
 Ralph Müller
- Department of Health Sciences and Technology, Institute for Biomechanics, ETH Zürich, Zürich, Switzerland
Microstructural bone phenotypes, such as the intracortical canal network, could be directly linked to the mechanical failure behavior of cortical bone tissue. In addition, high accumulation of microdamage can significantly increase bone brittleness and thus, is a precursor of mechanical failure. Here, we discuss the development and validation of an automated step-wise micro-compression device (MCD) for dynamic image-guided failure assessment (DIGFA) of intracortical bone microstructure and bone microdamage. The device was found to be highly accurate and precise with positioning errors of less than 1 μm and force errors of less than 1.25 N. In addition, the results of a first biological study using DIGFA and time-lapsed computed tomography are presented. In short, whole mouse femora from mature C57BL/6 (B6) and C3H/He (C3H) mice with mid-diaphyseal notches were tested in step-wise compression and concomitantly imaged until failure. DIGFA was performed at the TOMCAT beamline of the Swiss Light Source (SLS) using synchrotron radiation-based computed tomography (SR CT). Following the experiment, intracortical porosity was separated into the canal network, osteocyte lacunae, and microcracks for subsequent morphometric evaluation. The thicker cortex of C3H was penetrated by a dense canal network, whereas in B6 only a few scattered canals were observed. For B6, the first occurrence of crack was noted at 1.45% local strain, while for C3H, crack initiation took place only at 2.66% local strain. In addition, we were able to relate whole bone mechanics to local failure events by deriving correlations between microstructural porosity and microdamage propagation. In conclusion, initiation and accumulation of microcracks were investigated for two mouse phenotypes demonstrating that DIGFA in combination with SR CT is a suitable technique for time-lapsed three-dimensional assessment of bone morphology and bone fracture behavior down to the cellular level.
Introduction
Bone is a hierarchical composite material whose mechanical properties highly depend on the structural and material organization (Cowin, 2001). The material properties of bone can be largely attributed to its composition, and define the types of loading it experiences (Carter and Spengler, 1978). On the other hand, structural properties of the tissue stem directly from the architectural arrangement of the material, and differ across bone types, species, and hierarchical level under investigation (Goulet et al., 1994; Rho et al., 1998). These properties define the amount of loading bone can withstand before fracture (Turner, 2006; Currey, 2012).
Regarding the bone structure on the tissue level, it is the trabecular and cortical bone which deserve attention. Trabecular bone consists of an intertwined network of rod- and strut-shaped trabeculae, and provides large porous spaces for marrow encapsulation (Wehrli, 2007). Cortical bone is a major load-bearing and protective structure of the body. It is particularly resistive to compressive deformations, while it remains relatively weak in tension (Reilly and Burstein, 1975). Furthermore, the influence of microstructural porosity on the mechanical properties of bone has been widely established (Currey, 1988; Mccalden et al., 1993). Intracortical canals and osteocyte lacunae have been shown to play an important role in the mechanical properties of cortical bone (Schneider et al., 2013) and therefore its ability to resist fracture. With respect to the material properties, microdamage has been identified to be an important determinant for bone mechanics (Donahue and Galley, 2006). Several studies attempted to describe and quantify the relationship between bone microstructure and the behavior of microdamage in bone (Voide et al., 2009, 2011). Small amounts of microdamage in bone were shown to lead to large reductions in bone strength and stiffness (Hernandez et al., 2014). However, so far we still lack information about the location of accumulated microdamage and the specific future fracture of bones. Until recently, this link between bone structure and function was lacking temporal resolution, which is necessary for the investigation of the dynamic process of bone fracture.
The visualization of bone microdamage initiation and propagation has been steadily advancing from two dimensional (2D) imaging methods, such as histology and microscopy (Burr et al., 1985, 1998; Choi and Goldstein, 1992; Diab and Vashishth, 2005), to three-dimensional (3D) techniques, such as confocal microscopy (Fazzalari et al., 1998; Reilly, 2000) and micro-computed tomography (μCT) (Nalla et al., 2004; Voide et al., 2008a; Larrue et al., 2011; Palanca et al., 2017). For high-resolution 3D imaging in the sub-micrometer domain synchrotron radiation-based computed tomography (SR CT) has been gaining popularity (Schneider et al., 2007; Cooper et al., 2011; Pacureanu et al., 2012; Tommasini et al., 2012; Dong et al., 2014). SR CT provides isotropic spatial resolution of 1 μm or better (Stampanoni et al., 2007), which allows differentiation of separate components of intracortical bone microstructure. Combined with mechanical testing, this method can facilitate the assessment of the role of bone porosity in the failure behavior of the tissue. This application, also referred to as functional or biomechanical imaging (Voide et al., 2008d), enables tomographic visualization of the sample following each loading step, and provides direct time-lapsed imaging of the bone tissue's load response. Several in situ testing systems of various degrees of automation and sophistication have been introduced to facilitate image-guided failure assessment (IGFA) in conjunction with μCT and SR CT (Müller et al., 1998; Bleuet et al., 2004; Nazarian and Müller, 2004; Thurner et al., 2006; Voide et al., 2009; Jang et al., 2014; Evans et al., 2017). However, so far the loading devices have either required manual operation (Voide et al., 2009), or were limited by their geometric arrangements (Bleuet et al., 2004; Thurner et al., 2006) or mechanical capabilities (Müller et al., 1998; Nazarian and Müller, 2004). In addition, only one of the loading devices listed above has been validated for precision and accuracy (Nazarian and Müller, 2004).
Therefore, taking into account the potential of IGFA to assess the dynamic failure process, the first goal of this study was to design and build an automated and thus, user-independent step-wise micro-compression device (MCD), which would allow functional imaging of the dynamic processes in bone, i.e., dynamic IGFA (DIGFA). The second goal was to perform a verification study for the precision and accuracy of the mechanical components, which provides a protocol for calibration of the MCD. Finally, as a third goal, the device was tested for sensitivity within a first biological study, in which microdamage initiation and propagation within cortical bone of a mouse model was examined by DIGFA using the new MCD.
Materials and Methods
Design and Construction of the Micro-Compression Device (MCD)
The first objective of this study was to design and build a MCD for DIGFA (Schneider and Müller, 2010) for whole rodent bones and sections of human trabecular or cortical bone, which is compatible with SR CT imaging setups. Consequently, as the primary use of the MCD is as in situ rig at beamlines of SR facilities that offer experimental stations for tomographic imaging, it must be compact and mobile as well as easy and quick to build up and disassemble for transport. Therefore, the design requirements identified were low weight and height, simplicity of installation, and ease of individual component replacement. Low weight and height are important factors to guarantee proper operation of the motors driving the rotation stage for high-resolution CT and to avoid precession of the rotation axis, respectively. Thus, the weight limit for the MCD excluding the control system was set to 5 kg, and the height had to be kept to the minimum. The requirements for the motor and load cell were based on the mechanical properties of the expected specimens (whole rodent bones and sections of human trabecular or cortical bone). The components had to be able to both exert and detect forces of at least 500 N, and the motor and load cell selection had to favor highest resolution and accuracy for biomechanical imaging of bone tissue failure at a microstructural level. In order to facilitate (absorption-based) SR CT imaging, the design at the sample height had to be X-ray transparent and small in diameter for minimal sample-to-detector distance, to reduce absorption by the MCD and to minimize the influence of edge enhancement due to the coherent nature of SR light, respectively. The control system of the designed MCD had to be digitally synchronized with the controls for SR CT imaging at the TOMCAT beamline (Stampanoni et al., 2007) of the Swiss Light Source (SLS) to allow step-wise and user-independent loading and intermittent tomographic scanning of the dynamic failure process within the bone tissue. Finally, the system had to facilitate real-time output of the mechanical data for experimental monitoring, as well as produce comprehensive log files upon the completion of the experiment.
The key element of the developed MCD (Figure 1) is a compact linear stepper motor, which serves as linear actuator (NA23C60; Zaber Technologies Inc., Vancouver, Canada), with a travel range of 60 mm, maximum force of 800 N, and spatial resolution of 0.2 μm. Attached to the motor shaft is a subminiature load cell (Model 11; Honeywell Sensing & Control, Columbus, OH, USA), which operates both in tension and compression, sustaining forces up to 1,250 N with a reproducibility of 99.9% or a precision of 1.25 N as reported by the manufacturer. The top part of the MCD ends with a stainless steel ball-point tip attached to the motor plunger, which is put into contact with a stainless steel loading plate on top of the tested sample. The ball bearing between the plunger and the sample ensures axial loading (no shearing). The sample holder base of the bottom part of the MCD was manufactured out of polyoxymethylene (POM), whereas the smaller inner cylinder of the sample holder (inner Ø = 7 mm, wall thickness = 0.5 mm, height = 30 mm) and the larger load-bearing outer cylinder (inner Ø = 36 mm, wall thickness = 1 mm, height = 190 mm) were manufactured out of custom-made glass-free carbon fiber reinforced plastic (CFRP) (Suter Kunststoffe AG, Fraubrunnen, Switzerland). POM was chosen for its low mass, low friction, and wear resistance, as well as high stiffness, and very good dimensional stability. CFRP has been given preference because it is a light, but very strong composite material (stiffness > 100 GPa in the longitudinal direction, both in compression and tension). In addition, compared to mineralized bone tissue, both POM and glass-free CFRP are practically X-ray translucent at the X-ray energies used for (absorption-based) SR CT. This is an important factor for the quality of the CT reconstructions as it reduces typical cupping artifacts due to the local tomographic setup (Schneider et al., 2009), where the X-ray projection of the sample and the sample holder (specifically the outer CFRP cylinder) exceeds the field of view of the detector. Other off-the-shelf CFRPs have been tested, containing glass components, which are detrimental for X-ray imaging as they significantly absorb X-rays and are thus cannot be considered X-ray translucent. The exchangeable inner CFRP cylinder is designed to hold the sample, retain moisture, and any liquid required for the experiment. The outer CFRP cylinder counteracts the forces exerted by the actuator onto the sample stage, while mechanically protecting the load cell and the plunger during experimental testing. The dimension of the MCD is 65 × 65 × 335 mm and the overall weight is less than 2 kg. During experimental testing and imaging, the outer cylinder must be attached to the sample stage and the whole device has to be firmly fixed to the rotation stage of the CT setup at TOMCAT (Figure 2), also controlling sample alignment.
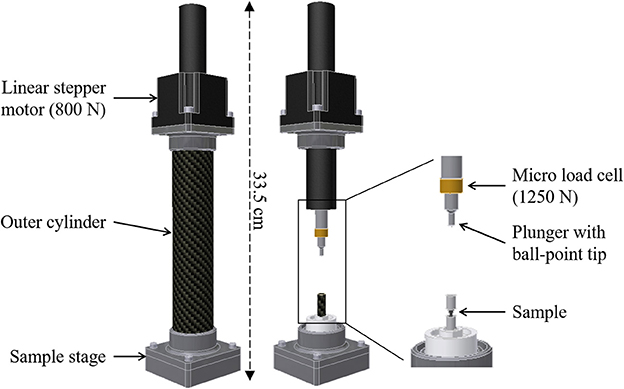
Figure 1. Design of the micro-compression device (MCD) for dynamic image-guided failure assessment (DIGFA). (Left) Fully assembled state of the MCD. (Right) MCD view showing component assembly.
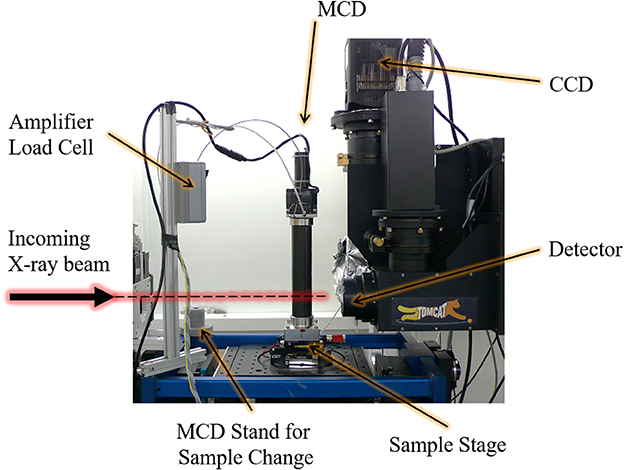
Figure 2. Micro-compression device (MCD) for dynamic image-guided failure assessment (DIGFA) mounted at the TOMCAT beamline of the Swiss Light Source (SLS).
Data acquisition and system control have been managed using LabVIEW 8.1 (National Instruments, Austin, TX, USA), which allowed direct communication between the MCD and the beamline EPICS control channels via TCP/IP. In addition, an intuitive graphical user interface (GUI) was designed to guide users step-by-step during DIGFA.
A typical experimental protocol would begin with the initiation of the linear actuator and resetting of the load cell. A contact point with the sample will then be detected either manually by tracking X-ray projections on the CCD camera during plunger movement toward the sample, or by setting a predefined force limit during plunger approach. At the beginning of the test, a static pre-load step for sample stabilization or a cyclic pre-load for samples requiring pre-conditioning are available. Free parameters for an actual mechanical test is the force for pre-loading, rate of strain increase, sample size (for the strain calculation), number of total loading steps, as well as the relaxation time after each loading step. Once the DIGFA experiment is started, loading and CT scanning will be performed user-independently, in an automatic manner. The scan is initiated immediately after relaxation time. The experiment can be halted at any point, but will automatically terminate once the desired number of loading steps is carried out. The position and force data remain available through the entire test, starting with the initiation of the motor, where the sampling frequency for the mechanical data recording can be defined by the user. Finally, settings for mechanical tests and CT measurement are logged for use in future experiments.
Verification and Calibration of the Micro-Compression Device (MCD)
In the second aim, the functionality of the MCD for DIGFA was verified in its final assembly state. Due to possible non-linearities and setup-induced performance deviations, the load cell and the linear stepper motor were identified as critical components of the MCD. The following experimental and statistical measures were designed to verify and calibrate these mechanical constituents of the MCD.
All experiments were carried out on a Zwick/Roell material testing system (1456; Zwick/Roell AG, Ulm, Germany). The method of using servo-hydraulic devices for compression experiments and for calibration of external load cells has been previously established in several studies (Thurner et al., 2006; Voide et al., 2008d). Importantly, although the calibration protocols are similar across all devices, the non-continuous nature of previous experiments (Thurner et al., 2006; Voide et al., 2008d) introduces a delay of several minutes between the application of the load and the initiation of the scan, which in turn could allow for further stress propagation and consequent structural damage. At the same time, continuous load monitoring could provide valuable insights into tissue responses that occur between the load application and scanning, suggesting that validated load cell function is of utmost importance in these types of experiments. In general, load cells of servo-hydraulic machines undergo routine calibrations by the manufacturer, thus guaranteeing the reliability of the measurement. Since the experiments with the MCD were planned for a wide range of loads, the calibration of the MCD was done on both macro and micro scales using two different calibrating load cells of the Zwick/Roell material testing system with a maximal load of 5 kN and 10 N, respectively. Calibration tests were done in compression, where a plastic stopper (FIBROFLEX®-Rundfeder, 80 Shore A (outer diameter = 20 mm, height = 16 mm); Brütsch/Rüegger Holding AG, Urdorf, Switzerland) was used to separate the MCD load cell from the compression plate, thus preventing damage to either component. An additional metal holder was manufactured to prevent slipping and sliding between the components of the setup. All tests ran according to a step-wise compression protocol provided in the Zwick/Roell software package. The number of steps, force increase per step, and upper force limit varied depending on the range of the planned compression tests. The hold time was considered as an additional variable in the experiment. A single run was started with the pre-load application followed by gradual loading. After the test the setup was returned to the initial position, and reassembled prior to the next test. All tests were done by a single experimenter, and repeated five times for each loading protocol.
The MCD has been designed for small rodent and human bone samples with maximal dimensions of 20 mm in length and 6 mm in cross-section. Therefore, based on the size and estimated mechanical properties of the samples and the maximum attainable displacement resolution of the motor, the desired level of precision for the measurement was set to be 1 μm. A Mercury 2000 (MicroE systems, Bedford, MA, USA) smart encoder system using 18 mm long linear scale was chosen as a suitable measurement tool for the verification of plunger displacement, which also fitted the set precision requirement of 1 μm. The signal interpolation factor for the verification test using the smart encoder system was set to 200 steps, at which the system performs measurements with the precision of 0.10 μm, and with an interpolation accuracy of 0.12 μm or better. The encoder of the system was integrated into the MCD control software, where a separate graphical user interface for the calibration experiment was designed in Labview 8.1. The acquisition of the signals from the linear encoder and the load cell were triggered at the same time with the motor displacement, thus fully synchronizing the three measurement systems (stepper motor, MCD load cell, smart encoder system). In the calibration experiment, the MCD plunger was advanced against the stationary compressing plate of the Zwick/Roell machine, where the two systems were separated by the plastic stopper, as described beforehand. For the calibration tests, different factors influencing motor operation have been identified, including the amplitude of the reaction force, speed of displacement, level of plunger extension, and the direction of motion. The influence of the magnitude of the reaction force was simulated by applying and maintaining a pre-defined force with the Zwick/Roell compression plate, while advancing the MCD plunger to counteract the force. The other factors could be assessed by varying the settings in the control system of the MCD. Data acquisition was done in Labview 8.1, via a standalone program. The step number along with the voltage read-out from the MCD load cell were monitored continuously, at a sampling frequency of 1,000 Hz. All test runs were performed five times by a single investigator, and average values were used for the statistical evaluation.
Dynamic Image-Guided Failure Assessment (DIGFA) of Bone Tissue on Microstructural Level
The final objective of the study was to test the sensitivity of the MCD for biomechanical imaging, regarding visualization and quantification of intracortical microdamage initiation and propagation in a mouse model.
For DIGFA based on SR CT imaging, two different mouse strains have been used, C57BL/6 (B6) and C3H/He (C3H), representing low and high bone mass, respectively (Beamer et al., 1996; Turner et al., 2000). Femora from 16-week old mice were prepared as previously described (Voide et al., 2008b). In short, left femora were extracted and stored in 70% ethanol. The bones were embedded in polymethyl methacrylate cement (PMMA), leaving only 4 mm of the central femoral shaft exposed. POM cylinders (6 mm in diameter) were used to provide stability at the ends. In the next step, all samples were aligned similarly to a previously developed procedure (Voide et al., 2008c). A transverse notch, measuring 0.76 mm in depth and 0.89 mm in width was introduced in the mid-diaphyseal region to create an area of reduced strength, and to induce microdamage formation in this region (Figure 3). Cortical thickness in the mid-diaphysis was significantly different (p < 0.001) between B6 (Ct.Th = 0.17 ± 0.1 mm) and C3H (Ct.Th = 0.34 ± 0.1 mm). Nevertheless, the relative average cross sectional area removed by the defect was comparable in both mouse strains and accounted for 40 ± 5% in average cross-sectional area reduction (Voide et al., 2011). The defect created a weakened region in the cortical bone. A micro-finite element analysis of this loading model showed that, around the reduced cross-section, the strains were parallel to the loading direction and ranged between 0.11 and −1.56% when 1% overall compressive strain was applied (Voide et al., 2009). Before mechanical testing, all samples were rehydrated in phosphate buffered saline (PBS) for 24 h prior to the time-lapsed biomechanical imaging experiments at TOMCAT. During experimental testing and imaging, the samples were immersed in PBS to ensure proper hydration of the tissue. This study was carried out in accordance with the recommendations of and approved by the Kantonales Veterinäramt Zürich (Cantonal Veterinary Office, Zürich, Switzerland).
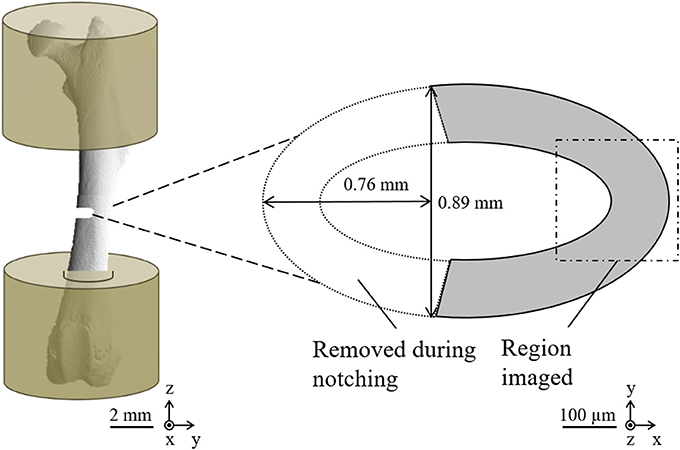
Figure 3. Sample preparation for image-guided failure assessment based on a combination of micro-compression and SR CT imaging. (Left) Schematic drawing of mouse femora embedded in PMMA and notched at the mid-diaphysis. (Right) A cross-sectional sketch, showing the volume of interest for SR CT imaging.
Axial compression tests of the embedded samples were carried out using the MCD. The apparent strains in the experiment are given with respect to the full length of the mouse femurs, typically 16–18 mm. All tests were performed until failure, at an interval of 0.05% strain/step and at a rate of 0.001% strain/second. Each compression step was followed by 5 min relaxation time at constant displacement, providing CT images without any visible movement artifacts. Subsequently, a tomographic scan was acquired within the femoral cortex at the height of the notch (Figure 3) using a 20X objective for optical magnification and including 2X binning on the detector to increase the signal-to-noise ratio, resulting in a voxel size of 740 nm. A total of 1501 projections at an individual exposure time of 150 ms were taken over a range of 180° in a step-and-go mode and at a photon energy of 17.5 keV. The projections have been flat field-corrected using five dark images (X-rays off) and five flat images (sample outside of X-ray beam) taken at the beginning of each experiment and five additional flat images acquired at the end of each run. While the imaging time accounted for less than 1 min per scan, a single cycle of compression, relaxation time, and scanning took on average 7 min. CT reconstruction was performed using standard filtered back-projection including an automated ring removal procedure, where fine-tuning of the CT reconstruction center has been optimized visually. The cylindrical reconstructed volume of interest (VOI), which comprises a segment of the bone mid-diaphysis (see Figure 3), had a diameter and height of 1,024 × 1,024 pixels or 0.76 μm × 0.76 μm. A radial polynomial gradient correction was then applied on the reconstructed data to correct for radial gradients due to the local tomographic setup (Schneider et al., 2009). One of the C3H samples was damaged during sample exchange, while another one was eliminated from the evaluation due to ultimate failure after only two loading steps. Consequently, the total number of successfully assessed samples was four and six for B6 and C3H mice, respectively. Since local mechanical strains are different for regions of varying cross-sectional areas, a normalization of the overall strain for notched and full cross-section regions was performed to provide apparent local mechanical strains. For the normalization, we assumed that the force over each section was equal and that the sum of sectional displacements corresponded to the total displacement. Known variables were cross-sectional areas in the sample (A1 and A2, notched and un-notched), as well as total longitudinal strain (εt), while the two variables to be determined were corresponding strains in each of the cross sections (ε1 and ε2). The total strain εt was first expressed as a function of the applied displacement (D) and the length of two cross-sections (L1 and L2):
Since D itself can be expressed as a sum of the change of length in each section (D = ΔL1 + ΔL2 = ε1L1 + ε2L2), Equation (1) could be written as:
By equating the force (F1 and F2) in each section one can solve for ε1 and ε2. From Young's law a solution for the relationship between ε1 and ε2 can be obtained.
Further combination of Equations (2) and (3) resulted in the following relationship:
Using Equations (3) and (4) the final expressions for ε1 and ε2 can be derived:
Whole-sample apparent strains were used in the context of mechanical testing, while normalized local strains were referred to in the context of bone microstructure and microdamage analysis.
All samples were evaluated for quantitative morphometry according to the following protocol: A previously described method for negative imaging was used to extract the intracortical bone microstructure, in which the mineralized bone matrix was segmented by global thresholding and inverted (Schneider et al., 2007). Pre-processing steps that were applied in this method included Levenberg-Marquardt polynomial gradient correction of ring artifacts, iterative thresholding to produce binary images, generation of the full mask of the bone tissue, inversion of the mask to extract voids within the tissue, and removal of single-voxel artifacts. Extraction of the canal network, osteocyte lacunae, and microcracks was achieved through a combination of different image processing procedures (IPL; Scanco Medical AG, Brüttisellen, Switzerland), including component labeling and morphological operators, namely erosion and dilation. Morphological operators were mainly applied to close the intracortical porosity, providing a solid mask for the cortical bone, needed to segment the different intracortical microstructures from the negative imprint of the mineralized bone tissue and to calculate the cortical bone volume (Ct.BV). All porous elements where then separated into the distinct microstructural phases (canal network, osteocyte lacunae, and microcracks) based on their size and morphology. Thus, pores smaller than 175 μm3 were excluded, elements ranging from 175 to 593 μm3 were classified as osteocyte lacunae, and the ones larger than 1.4·103 μm3 were grouped as canal network, based on the previously reported values (Schneider et al., 2007). Subsequently, pores of the intermediate sizes ranging from 0.5 to 1.4·103 μm3, as well as those grouped as canal network were initially examined visually to refine their morphological classification. In the automated segmentation process, pores morphologically defined as planar surfaces were classified as microcracks.
For each one of the microstructural phases, a set of morphometric indices including number, volume, and volume density was defined similar to Schneider et al. (2007) and Voide et al. (2009) and in line with standard nomenclature for bone morphometry (Parfitt et al., 1987; Bouxsein et al., 2010). Explicitly, we have evaluated cortical bone volume (Ct.BV) in the VOI, as well as numbers of disconnected canals (N.Ca), osteocyte lacunae (N.Lc), and microcracks (N.Cr). Furthermore, volumes of canal network (Ca.V), osteocyte lacunae (Lc.V), and microcracks (Cr.V) have also been assessed. To compensate for the differences in bone size between the two mouse strains, we have normalized microstructural volume parameters (Ca.V, Lc.V, and Cr.V) by Ct.BV, which provides canal volume density (Ca.V/Ct.BV), lacuna volume density (Lc.V/Ct.BV), and crack volume density (Cr.V/Ct.BV). Finally, in an attempt to establish a correlation between the interplay of microstructural elements as a function of the applied mechanical strains, we introduced a parameter for the normalization of crack volume by the volume of canal network (Cr.V/Ca.V), motivated by the reported importance of the canal network for microcrack initiation and propagation (Voide et al., 2011).
Statistical Analysis
Statistical analysis was performed using the GNU statistical package R (version 2.4.1, http://www.r-project.org) unless stated otherwise, including the additional SFSMISC package (version 1.0, http://cran.r-project.org/web/packages/sfsmisc) for residual analysis.
For the assessment of the load cell data a single predictor variable linear regression model was applied. The measurements obtained from the Zwick load cell were taken as the predictor variable, while those from the MCD load cell represented the response variable. The one-to-one linear relation of the variables was taken as the null hypothesis. Rejection of the null hypothesis was based on the F-statistic for the r2 > 0.95, and corresponding residual analysis, where r is Pearson's correlation coefficient used to assess the strength of linear relationship between the two variables. For the satisfactory results of the model fit, a very high value of the F-statistic, as well as the minimal value of the p-value were expected (Christensen, 2002). Mean values of five repeated tests for each test run were used for data fitting. The residuals were checked using graphical methods. The assumptions to be verified were that the mean of errors was 0, that all errors had the same theoretical variance, that the errors were normally distributed, and that all errors were independent. To test those assumptions a scale-location plot, Tukey-Anscombe plots, a histogram and Q-Q plots were applied, respectively. Significance of the model was given by the p-value for the calculated F-statistic, where models with p < 0.05 were considered statistically significant. Eventually, the new calibration coefficient for the MCD load cell was determined based on the linear model.
For the verification of the linear stepper motor operation, assessment of the previously identified factors influencing motor operation (amplitude of the reaction force, speed of displacement, level of plunger extension, and the direction of motion) was performed in a crossed block design (Faraway, 2004, 2005), in which the initial interaction model was constructed using 16 terms. The model was then reduced through the analysis of significance of any given predictor variables, including quadruple interactions of several variables. The final model describing motor displacement included only statistically significant factors for which the p-value was < 0.05 in the analysis.
Relationships between microcracks and canal network were analyzed using linear regression analysis, where p-values < 0.01 were considered statistically significant. Microdamage propagation in terms of Cr.V was studied as a function of normalized local mechanical strains using Excel 2010 (Microsoft, Redmond, OR, USA). In the final part of the analysis, data for the B6 and C3H samples were combined together to establish group-wise trends for microdamage buildup. Increase in the microcrack volume (Cr.V) normalized with one other morphometric parameter at the time was then correlated with the increase in the local mechanical strain. Trend line fitting and statistical evaluation was then further conducted using Excel 2010 (Microsoft, Redmond, OR, USA) to detect any meaningful interactions.
Results
Validation and Calibration of the Micro-Compression Device (MCD)
Validation and calibration of the MCD focused on two integral components of the device, the linear stepper motor and the load cell, which are potentially prone to performance disruption within the integrated construction. For the validation and calibration of the micro load cell, we hypothesized that the performance of the MCD and the calibrating load cells are linearly related, as would be expected by the technical descriptions of both instruments. Consequently, the minimum value of the correlation coefficient of 0.95 was specified as the decision factor for the rejection of the null hypothesis. The correlation coefficients that were actually obtained for the test with the 10 N load cell were equal to 1.00, and those for the 5 kN load cell were greater than 0.99. The F-statistic, calculated from the ratio of sample variances to verify for possible lack of fit in the linear model, was greater than 2.57 × 10⁵ for all tests, and the corresponding p-values were < 0.001 across all tests. The final step in the model validation was the analysis of residuals and consequent hypothesis decision. The graphical results confirmed the assumptions across all tests, and the null hypothesis for the experiment was thus accepted based on the values of the F-statistic and the residual analysis. These results supported the assumption that the micro load cell incorporated into the MCD and the load cells used in the material testing Zwick/Roell system show linear performances. In addition, a new calibration factor was calculated for the micro load cell. Ideally, such calibrations should be performed prior to each high-resolution imaging experiment.
For the verification of the linear stepper motor, the discrepancies in plunger displacement have been investigated as a function of amplitude of the reaction force, speed of displacement, level of plunger extension, and the direction of motion. Statistical analysis compared the experimental data collected by the reference smart encoder system during repeated test runs against the displacements set by the control of the stepper motor. Both individual and combined effects of the experimental variables have been calculated and analyzed. The results showed that the speed of the plunger displacement or its extension level at the beginning of the experiment had no significant influence on the precision of the system. On the other hand, it was noted that high reaction forces before the start of the experiment can both introduce small offsets and influence the precision of the motor displacements. However, statistical analysis did not identify reaction force as a significant factor for the precision of the device. Alternatively, the direction of plunger movement was identified as a significant factor, with p < 0.001, and errors in displacements of 0.9%. The analysis of the quadruple interactions in the full model produced meaningful results; however, none of the evaluated combinations were statistically significant. Thus, from the analysis of the complete interaction model, it can be concluded that the errors in measurement were random and the overall system precision from the full factorial design model verified an accuracy of 1 μm in 99% of the tests.
Biomechanical Imaging
In the current study, dynamic biomechanical imaging has proven to be a powerful tool for tracking microdamage initiation and propagation in cortical bone all the way through complete mechanical failure. A total of 10 samples were tested in a quasi-continuous way for subsequent visualization and morphometric analysis. The microstructural phases (canal network, osteocyte lacunae, and microcracks) of each sample were visualized, classified, and morphometrically analyzed. In addition, for specimens that sustained more than three compression steps until ultimate failure, the rate of microcrack propagation was fitted with exponential functions.
The stepwise nature of the biomechanical imaging approach allowed comparison between whole bone fracture mechanics and the accumulation of local damage on the micro scale (Figure 4, Supplementary Presentation 1). This allowed investigation of the linear, as well as post-yield phases of bone loading and overloading. For B6 mice, ultimate load ranged between 14 and 25 N with corresponding maximal apparent mechanical strains in the range of 3.0–3.7%. In the C3H group, maximum sustained load levels were between 22 and 26 N with equivalent apparent mechanical strains of 3.6–5.5%. The normalized local strain, where microdamage initiation started at the height of the notched region, were 1.45 and 2.66% for B6 and C3H, respectively. In addition, the recorded stress-strain curves (Figure 4, top left) during biomechanical imaging allowed correlation of fracture events (microcrack initiation and propagation shown in Figure 4, bottom)—indicated by stress drops (Figure 4, top left) and microcrack morphometry (Figure 4, top right)—with local tissue deformation (Figure 4, top right). Interestingly, for all B6 samples a sharp decrease in stress levels (at constant apparent strain levels during the relaxation stage) was always observed one or two steps prior to the visualized crack formation and one compression step prior to ultimate failure. For C3H mice, all samples showed stress drops occurring earlier, usually within three compression steps before microcrack detection in the VOI of the SR CT data. Furthermore, multiple succeeding stress drops were noted previous to ultimate bone failure for C3H mice. For each DIGFA experiment the relationship between normalized local strain and microdamage build-up was analyzed and fitted with exponential functions. Regardless of the mouse strain, microcrack propagation could be described with R2-values ranging from 0.58-0.99.
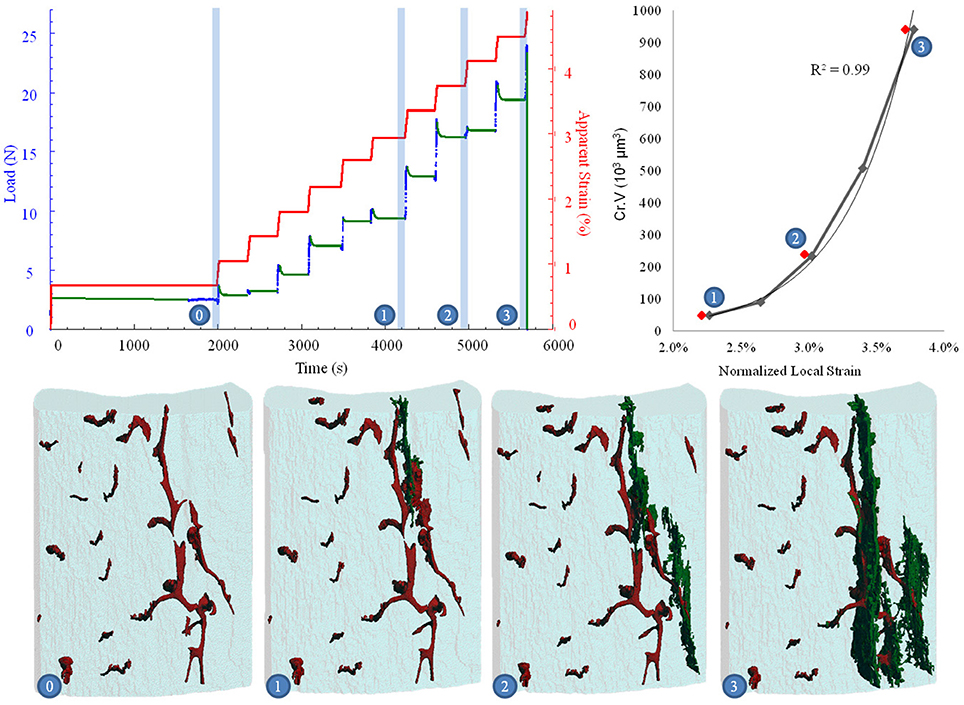
Figure 4. Biomechanical imaging combining bone mechanics (top left) and image-guided failure assessment (bottom and top right). (Top left) Blue and red plots show applied loads and corresponding apparent strains in the sample as a function of time. Time slots of stress relaxation and failure are shown in green. (Top right) Microcrack growth with the increase in applied strains, showing the equation of the fitted exponential function and the corresponding coefficient of determination. (Bottom) Visualized bone microstructure, where canal network is shown in red, microcracks in green, and cortical bone outline in light blue. (0–3) denote matching time points in all images.
Following visualization and classification of the microstructural phases in 3D, a full morphometric evaluation was performed for all samples (Table 1). Cortical bone volume (Ct.BV) was significantly different and twice as high in C3H compared to B6. The number of disconnected canals (N.Ca) showed no statistically significant differences between mouse strains. However, the canal volume (Ca.V) and corresponding canal volume density (Ca.V/Ct.BV) varied significantly. A different trend was observed in lacunar statistics. While number of lacunae (N.Lc) and lacuna volume (Lc.V) were significantly higher in C3H animals compared to B6, lacuna volume density (Lc.V/Ct.BV) showed no significant differences between mouse strains. Finally, number of microcracks (N.Cr) and microcrack volume (Cr.V) were higher in C3H compared to B6 mice, while microcrack volume density (Cr.V/Ct.BV) was found to be higher in B6 mice. Yet, neither of the crack-related morphometric dissimilarities between groups was significant.
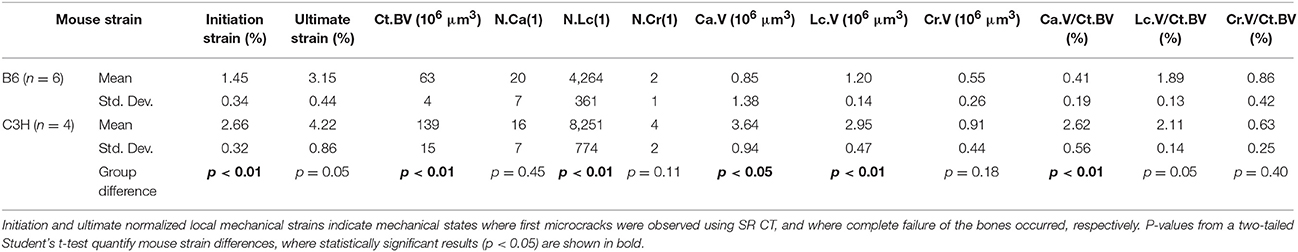
Table 1. Normalized local strains and morphometric measures describing the intracortical microstructures for B6 and C3H mice.
As a final part of the microstructural evaluation, microcrack volume was correlated with morphometric descriptors of the canal network. The only statistically significant result was observed for Cr.V/Ca.V (Figure 5). The normalized local mechanical strain could explain almost 90% of the variation observed in microcrack to canal volume relationship in C3H mice, but only 36% in B6 mice.
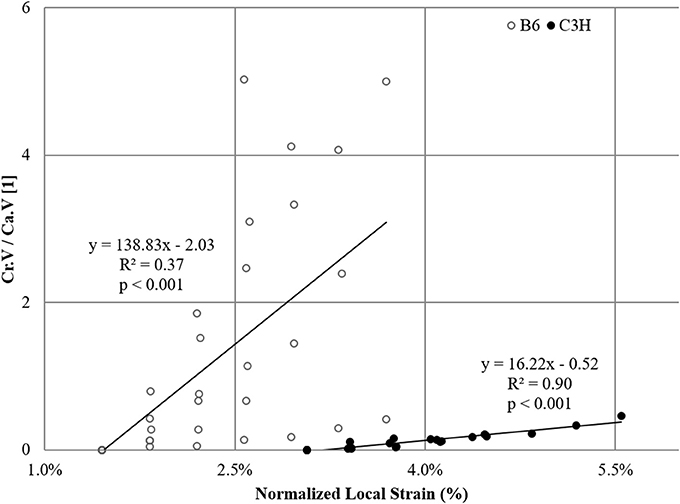
Figure 5. Correlation between microcracks and canal network. Plotted is the volume ratio Cr.V/Ca.V (normalized crack volume) as a function of normalized local mechanical strains for B6 (R2 = 0.37, p < 0.001) and C3H (R2 = 0.90, p < 0.001).
Discussion
When studying bone it is important to look at the hierarchical order of events in the range from macroscopic to microscopic scales (Fratzl and Weinkamer, 2007; Müller, 2009). While constant improvements in visualization and analytical techniques make assessment on each level feasible, it is impossible to subject a single sample to the full range of the available mechanical testing techniques, mainly due to their destructive nature. It is a common approach therefore to combine mechanical assessment with visualization techniques, usually referred to as biomechanical imaging. In this study, we brought together micro-compression experiments and image-guide failure assessment (IGFA) for the visualization and monitoring of microdamage initiation and propagation on macroscopic and microscopic levels. For this purpose, a MCD was constructed and incorporated at a high-resolution 3D imaging station, namely the TOMCAT beamline of the SLS, where the synchrotron radiation-based computed tomography (SR CT) experiments were performed.
Other studies introduced similar devices (Müller et al., 1998; Bleuet et al., 2004; Nazarian and Müller, 2004; Thurner et al., 2006; Voide et al., 2009) combining mechanical compression and CT imaging of bone failure. However, those devices always had a set of constraints, such as bulky size and restricting shape, limited range of motion or accuracy, or lack of validation. For DIGFA studies of either small animal bones or human bone biopsies, we recommend a device with a weight of maximally 2 kg and inner diameters of at least 7 mm in diameter and 30 mm in length with a travel range of the stepper motor of minimally 20 mm and a step resolution of 0.2 μm. The accuracy precision should be 1 μm or better for overall displacement and 1 N or better for the force with a maximum of at least 500 N. In order to reach highest possible resolution, the outer diameters should be not more than 36 mm in diameter with a wall thickness of the radiolucent material of 1 mm or less to allow submicron resolutions without significant local tomography artifacts. A number of commercially available devices have been introduced lately (Jang et al., 2014; Evans et al., 2017). Although these devices promise similar performance, they have not be thoroughly tested and validated yet for applications in bone.
With respect to this objective, the MCD was designed to be versatile, and fully integrated within the experimental CT setup at TOMCAT. The total weight of the machine is less than 2 kg, and the installation at the beamline involves a simple fixation of the device base with four screws. Sample change can be carried out by a single investigator within a few minutes. The fact that the experimental course is fully automated and interlinked with the scanning triggers of the beamline, not only drastically reduces the possibility of human errors, but also allows to cut down the time between scans, better adapting to the dynamic mechanical processes in the sample. It is important to note though that dynamic does not mean real-time as we still have step-wise compression that is both terminal and discontinuous in its image data collection of the bone structure.
In the second objective, we planned and carried out the validation of the key parts of the MCD, and thus confirmed the reliability and accuracy of its mechanical parts, and its robustness within the full range of performance. In addition, the ball-point plunger, originally combined with a stainless steel plunger disk for even distribution of contact pressure in the compressive experiments (Dhillon et al., 2011), can also be substituted with a clipping mechanism attached to the specimen to enable experiments in tensile mode as well (Bergomi et al., 2010).
Finally, the third goal comprised a sensitivity study, in which we performed a multiscale evaluation and high-resolution visualization of microdamage dynamics in murine cortical bone with the newly constructed MCD. To this end, microstructure and microdamage growth within cortical bone of a mouse model was visualized in a quasi-continuous manner in 3D. Similarly to the previous reports for both human and rodent bones (Schaffler et al., 1995; Voide et al., 2009), we have seen that ultimate bone failure is the result of progressive damage accumulation in the bone tissue. In addition, we have also observed numerous events of stress drops, likely associated with stress redistribution and energy dissipation, prior to bone failure. This phenomenon was more frequently observed in C3H compared to the B6 samples, however was commonly seen in both phenotypes preceding the appearance of detectable microcracks in the 3D images, as well as immediately before failure. In several cases, stress-strain curves indicated redistribution of stress in the sample; however, no microcracks were detected in the imaged VOI. Nevertheless, since we only observe a very small VOI, our ability to detect microdamage in the imaged volume represents a limitation of the current biomechanical imaging approach. This also explains the apparent rapid failure in some samples as a consequence of undetected microcrack build-up, as in the case of the eliminated specimen, which failed within two compression steps. While the measurement of overall mechanical strains is a function of the load cell operation, and is therefore subject to the range of errors within the confidence interval of the load cell performance, we believe that the readout from the device is accurate and meaningful. It has to be mentioned though that calculation and normalization of the local mechanical strains relies of a number of assumptions that we have deemed reasonable—namely, that the force over each section is equal and that the sum of sectional displacements correspond to the total displacement. We are aware that the inter-sample variability and human error in the preparation process has an impact on the individual local strains; however, we believe that the proposed method is based on sound underlying mechanical principles, and therefore provides meaningful and relevant calculations of the local mechanical strains.
Both mechanical testing and visual evidence suggest that femoral cortical bone of C3H mice is more resistant to microcracking and can sustain higher strains until ultimate failure than that of B6 mice. Similar results have been reported in the studies employing different assessment methods (Voide et al., 2008b; Courtland et al., 2009), and can be attributed to both structural and architectural differences in bone. Nevertheless, it must be considered that the suitability of the SR CT visualization for the mechanical testing has been disputed due to the adverse effects of X-ray irradiation on the tissue (Barth et al., 2011). In a previous study (Voide et al., 2011) we conducted mechanical testing on femoral specimens of 19-week-old B6 mice under similar SR CT experimental conditions as reported here, to investigate the influence of X-ray irradiation on bone mechanics. We observed a decrease in ultimate load due to X-ray irradiation (49%, p < 0.05) and stiffness (36%, p = 0.09), which was lower than expected (>90%) from model calculations for in situ SR X-ray scattering and CT experiments (Barth et al., 2011). Nevertheless, it is important to note that although SR imaging does negatively affect the mechanical bone properties, it does not affect the microstructure itself. A recent study found high reproducibility and inter-class correlations of microstructural bone parameters (Hemmatian et al., 2017) indicating that there are no significant microstructural changes at this level of resolution even after multiple image acquisitions. Additionally, it should be mentioned that our studies used whole femurs that were notched in the mid-diaphysis of the bones. As the notching is destructive, it may also have changed the bone structure just adjacent of the notch, which is our region of interest to observe microstructure and microcrack initiation and progression. Nevertheless, no changes or damage was observed in our baseline images indicating that possible changes associated with the notching were not detectable in our setting.
The results of the morphometric assessment have shown that the average cortical bone volume for B6 strain is less than half that of C3H samples, similar to the average volume of the accumulated microdamage, initiation strains, and the rate of microcrack propagation (1:2). Average microcrack volume density (Cr.V/Ct.BV) albeit larger in B6 was not significantly different between the two mouse strains, which can be attributed partly to the low number of cracks found in the VOI and the resulting high standard deviation associated with both N.Cr and Cr.V. Nevertheless, the observed microdamage build-up can in part be explained by increased bone mass and density, along with different tissue material properties, such as higher mineral-to-matrix ratio, and corresponding higher stiffness in C3H in contrast to B6 mice (Courtland et al., 2009). Additionally, the influence of bone microstructure has to be equally accounted for. To this end, while a more recent hypothesis suggest that it is the canaliculi, i.e., the tubular connections between different osteocyte lacunae, that are directly involved in the initiation of microcracks (Ebacher et al., 2012), it has previously been shown that osteocytes can play an active role, both as stress concentrating elements and contributors to crack blunting (Peterlik et al., 2006; Christen et al., 2012). Nevertheless, when we look only at the differences in the number of osteocyte lacunae, we were not able to show a significant effect of osteocyte number on microcrack development. It may well be though that osteocyte lacunae are more important for crack progression than initiation as suggested by these authors. Conversely, canal volume density (Ca.V/Ct.BV) was significantly different for the two mouse strains, and was more than six times greater in C3H than in B6 mice. Several studies comment on the significance of the canal network in the initiation and propagation of microdamage (Voide et al., 2009, 2011). In our assessment, we have found that while microcracks always ran parallel to the direction of loading, they were aligned with the canal network only if it was also parallel to the loading axis, which was common in C3H samples, but rarely observed in the B6 strain in this work. A recent study has shown that microcracks orientation is also dependent on the type of mechanical loading applied (Wolfram et al., 2016). Where compression resulted in microcracks parallel to the loading axis, tension provoked microcracks to align perpendicular to the loading axis. In our study, the applied strain was a significant factor in almost 90% of the interactions between microcrack and canal volumes in C3H samples, but only in 36% for the B6 mouse strain (Figure 5). The lower correlation can be explained by the almost complete absence of canals in the B6 mice, where microcracks initiate on the endocortical side of the bone and propagate outwards to the periosteal cortex rather than along the internal canals as seen in C3H mice.
An important benefit of the proposed dynamic image-guide failure assessment (DIGFA) technique is quasi-continuous visualization and quantification of microdamage in 3D. This approach enabled creation of dynamic animations of crack propagation and to establish relationships for the post-yield phase of bone overloading. For both mouse strains the relationship between strain and microdamage build-up could be described as an exponential function (R2-values ranged from 0.58 to 0.99). The coefficients of the exponent varied from as low as 34 to as high as 315, with no obvious inter-phenotype differences. When juxtaposed with visualized microdamage this analysis yielded a correlation in which lowest coefficients corresponded to the samples that failed due to the propagation of the planar microcracks, which aligned well with canals, a process typically seen in brittle materials (Peterlik et al., 2006). In the samples with highest exponential coefficients visualized microdamage contained multiple disconnected and frequently out-of-plane cracks, which could be categorized as quasiductile failure mechanism. Previously, the distinction between brittle and quasiductile failure in bone has been attributed to the collagen fiber orientation (Peterlik et al., 2006) and can be further supported by findings of more complex interactions between microstructure and material properties in murine bone tissue (Courtland et al., 2009; Kerschnitzki et al., 2011). Consequently, performing similar kinds of DIGFA experiments on human bone samples will further elucidate the interactions between material properties and architecture of bone tissue and their role in the initiation and propagation of bone microdamage.
Because of the non-lamellar structure of rodent bones the biological results of this study cannot be directly exploited for a better understanding of failure in human bones. However, having established and validated the MCD at hand for 3D visualization and quantification of dynamic bone failure, this biomechanical imaging approach is now ready to be used for studies of human bone. In the long run, better understanding of failure mechanisms in cortical bone can lead to more successful ways of prediction and prevention of both age- and injury-related bone fractures.
Author Contributions
PS, AL, and RM designed the experiment. AL, PS, MM, PV, and FD performed the study. All authors were involved in drafting the work and approved it for publication.
Conflict of Interest Statement
The authors declare that the research was conducted in the absence of any commercial or financial relationships that could be construed as a potential conflict of interest.
Acknowledgments
The authors thank Marco Hitz and Peter Schwilch for help with the device design and construction. This study was supported by a fellowship from the Whitaker Foundation (AL).
Supplementary Material
The Supplementary Material for this article can be found online at: https://www.frontiersin.org/articles/10.3389/fmats.2018.00032/full#supplementary-material
Supplementary Presentation 1. Image-guided failure assessment of time-lapsed cortical bone failure in B6 and C3H mice. Visualized bone microstructure, where canal network is shown in red, microcracks in green, and cortical bone outline in light blue.
References
Barth, H. D., Zimmermann, E. A., Schaible, E., Tang, S. Y., Alliston, T., and Ritchie, R. O. (2011). Characterization of the effects of x-ray irradiation on the hierarchical structure and mechanical properties of human cortical bone. Biomaterials 32, 8892–8904. doi: 10.1016/j.biomaterials.2011.08.013
Beamer, W. G., Donahue, L. R., Rosen, C. J., and Baylink, D. J. (1996). Genetic variability in adult bone density among inbred strains of mice. Bone 18, 397–403. doi: 10.1016/8756-3282(96)00047-6
Bergomi, M., Cugnoni, J., Wiskott, H. W. A., Schneider, P., Stampanoni, M., Botsis, J., et al. (2010). Three-dimensional morphometry of strained bovine periodontal ligament using synchrotron radiation-based tomography. J. Anat. 217, 126–134. doi: 10.1111/j.1469-7580.2010.01250.x
Bleuet, P., Roux, J. P., Dabin, Y., and Boivin, G. (2004). In-situ microtomography study of human bones under strain with synchrotron radiation. Dev. X-Ray Tomogr. Iv 5535, 129–136. doi: 10.1117/12.555670
Bouxsein, M. L., Boyd, S. K., Christiansen, B. A., Guldberg, R. E., Jepsen, K. J., and Müller, R. (2010). Guidelines for assessment of bone microstructure in rodents using micro-computed tomography. J. Bone Miner. Res. 25, 1468–1486. doi: 10.1002/jbmr.141
Burr, D. B., Martin, R. B., Schaffler, M. B., and Radin, E. L. (1985). Bone remodeling in response to in vivo fatigue microdamage. J. Biomech. 18, 189–200. doi: 10.1016/0021-9290(85)90204-0
Burr, D. B., Turner, C. H., Naick, P., Forwood, M. R., Ambrosius, W., Hasan, M. S., et al. (1998). Does microdamage accumulation affect the mechanical properties of bone? J. Biomech. 31, 337–345. doi: 10.1016/S0021-9290(98)00016-5
Carter, D. R., and Spengler, D. M. (1978). Mechanical properties and composition of cortical bone. Clin. Orthop. Relat. Res. 135, 192–217. doi: 10.1097/00003086-197809000-00041
Choi, K., and Goldstein, S. A. (1992). A comparison of the fatigue behavior of human trabecular and cortical bone tissue. J. Biomech. 25, 1371–1381. doi: 10.1016/0021-9290(92)90051-2
Christen, D., Levchuk, A., Schori, S., Schneider, P., Boyd, S. K., and Müller, R. (2012). Deformable image registration and 3D strain mapping for the quantitative assessment of cortical bone microdamage. J. Mech. Behav. Biomed. Mater. 8, 184–193. doi: 10.1016/j.jmbbm.2011.12.009
Christensen, R. (2002). Plane Answers of Linear Models: The Theory of Linear Models. New York, NY: Springer.
Cooper, D. M. L., Erickson, B., Peele, A. G., Hannah, K., Thomas, C. D. L., and Clement, J. G. (2011). Visualization of 3D osteon morphology by synchrotron radiation micro-CT. J. Anat. 219, 481–489. doi: 10.1111/j.1469-7580.2011.01398.x
Courtland, H. W., Spevak, M., Boskey, A. L., and Jepsen, K. J. (2009). Genetic variation in mouse femoral tissue-level mineral content underlies differences in whole bone mechanical properties. Cells Tissues Organs 189, 237–240. doi: 10.1159/000151381
Currey, J. D. (1988). The effect of porosity and mineral-content on the youngs modulus of elasticity of compact-bone. J. Biomech. 21, 131–139. doi: 10.1016/0021-9290(88)90006-1
Currey, J. D. (2012). The structure and mechanics of bone. J. Mat. Sci. 47, 41–54. doi: 10.1007/s10853-011-5914-9
Dhillon, A., Schneider, P., Kuhn, G., Reinwald, Y., White, L. J., Levchuk, A., et al. (2011). Analysis of sintered polymer scaffolds using concomitant synchrotron computed tomography and in situ mechanical testing. J. Mat. Sci. Mat. Med. 22, 2599–2605. doi: 10.1007/s10856-011-4443-z
Diab, T., and Vashishth, D. (2005). Effects of damage morphology on cortical bone fragility. Bone 37, 96–102. doi: 10.1016/j.bone.2005.03.014
Donahue, S. W., and Galley, S. A. (2006). Microdamage in bone: implications for fracture, repair, remodeling, and adaptation. Crit. Rev. Biomed. Eng. 34, 215–271. doi: 10.1615/CritRevBiomedEng.v34.i3.20
Dong, P., Haupert, S., Hesse, B., Langer, M., Gouttenoire, P. J., Bousson, V., et al. (2014). 3D osteocyte lacunar morphometric properties and distributions in human femoral cortical bone using synchrotron radiation micro-CT images. Bone 60, 172–185. doi: 10.1016/j.bone.2013.12.008
Ebacher, V., Guy, P., Oxland, T., and Wang, R. (2012). Sub-lamellar microcracking and roles of canaliculi in human cortical bone. Acta Biomater. 8, 1093–1100. doi: 10.1016/j.actbio.2011.11.013
Evans, N. T., Torstrick, F. B., Safranski, D. L., Guldberg, R. E., and Gall, K. (2017). Local deformation behavior of surface porous polyether-ether-ketone. J. Mech. Behav. Biomed. Mater. 65, 522–532. doi: 10.1016/j.jmbbm.2016.09.006
Faraway, J. J. (2004). “Linear models with R,” in Chapman and Hall/CRC Texts in Statistical Science, eds B. P. Carlin, C. Chatfield, M. Tanner, and J. Zidek (Boca Raton, FL: CRC Press), 200–210.
Faraway, J. J. (2005). “Extending the linear model with r: generalized linear, mixed effects and nonparametric regression models,” in Chapman & Hall/CRC Texts in Statistical Sciences, eds B. P. Carlin, C. Chatfield, M. Tanner, and J. Zidek (Boca Raton, FL: CRC Press), 153–174.
Fazzalari, N. L., Forwood, M. R., Manthey, B. A., Smith, K., and Kolesik, P. (1998). Three-dimensional confocal images of microdamage in cancellous bone. Bone 23, 373–378. doi: 10.1016/S8756-3282(98)00111-2
Fratzl, P., and Weinkamer, R. (2007). Nature's hierarchical materials. Prog. Mater. Sci. 52, 1263–1334. doi: 10.1016/j.pmatsci.2007.06.001
Goulet, R. W., Goldstein, S. A., Ciarelli, M. J., Kuhn, J. L., Brown, M. B., and Feldkamp, L. A. (1994). The relationship between the structural and orthogonal compressive properties of trabecular bone. J. Biomech. 27, 375–389. doi: 10.1016/0021-9290(94)90014-0
Hemmatian, H., Laurent, M. R., Ghazanfari, S., Vanderschueren, D., Bakker, A. D., Klein-Nulend, J., et al. (2017). Accuracy and reproducibility of mouse cortical bone microporosity as quantified by desktop microcomputed tomography. PLoS ONE 12:e0182996. doi: 10.1371/journal.pone.0182996
Hernandez, C. J., Lambers, F. M., Widjaja, J., Chapa, C., and Rimnac, C. M. (2014). Quantitative relationships between microdamage and cancellous bone strength and stiffness. Bone 66, 205–213. doi: 10.1016/j.bone.2014.05.023
Jang, A. T., Lin, J. D., Seo, Y., Etchin, S., Merkle, A., Fahey, K., et al. (2014). In situ compressive loading and correlative noninvasive imaging of the bone-periodontal ligament-tooth fibrous joint. J. Vis. Exp. 85:51147. doi: 10.3791/51147
Kerschnitzki, M., Wagermaier, W., Roschger, P., Seto, J., Shahar, R., Duda, G. N., et al. (2011). The organization of the osteocyte network mirrors the extracellular matrix orientation in bone. J. Struct. Biol. 173, 303–311. doi: 10.1016/j.jsb.2010.11.014
Larrue, A., Rattner, A., Peter, Z. A., Olivier, C., Laroche, N., Vico, L., et al. (2011). Synchrotron radiation micro-CT at the micrometer scale for the analysis of the three-dimensional morphology of microcracks in human trabecular bone. PLoS ONE 6:e21297. doi: 10.1371/journal.pone.0021297
Mccalden, R. W., Mcgeough, J. A., Barker, M. B., and Courtbrown, C. M. (1993). Age-related-changes in the tensile properties of cortical bone - the relative importance of changes in porosity, mineralization, and microstructure. J. Bone Joint Surg. Am. 75, 1193–1205. doi: 10.2106/00004623-199308000-00009
Müller, R. (2009). Hierarchical microimaging of bone structure and function. Nat. Rev. Rheumatol. 5, 373–381. doi: 10.1038/nrrheum.2009.107
Müller, R., Gerber, S. C., and Hayes, W. C. (1998). Micro-compression: a novel technique for the nondestructive assessment of local bone failure. Technol. Health Care 6, 433–444.
Nalla, R. K., Kruzic, J. J., Kinney, J. H., and Ritchie, R. O. (2004). Effect of aging on the toughness of human cortical bone: evaluation by R-curves. Bone 35, 1240–1246. doi: 10.1016/j.bone.2004.07.016
Nazarian, A., and Müller, R. (2004). Time-lapsed microstructural imaging of bone failure behavior. J. Biomech. 37, 55–65. doi: 10.1016/S0021-9290(03)00254-9
Pacureanu, A., Langer, M., Boller, E., Tafforeau, P., and Peyrin, F. (2012). Nanoscale imaging of the bone cell network with synchrotron X-ray tomography: optimization of acquisition setup. Med. Phys. 39, 2229–2238. doi: 10.1118/1.3697525
Palanca, M., Bodey, A. J., Giorgi, M., Viceconti, M., Lacroix, D., Cristofolini, L., et al. (2017). Local displacement and strain uncertainties in different bone types by digital volume correlation of synchrotron microtomograms. J. Biomech. 58, 27–36. doi: 10.1016/j.jbiomech.2017.04.007
Parfitt, A. M., Drezner, M. K., Glorieux, F. H., Kanis, J. A., Malluche, H., Meunier, P. J., et al. (1987). Bone histomorphometry: standardization of nomenclature, symbols, and units. report of the ASBMR histomorphometry nomenclature committee. J. Bone Miner. Res. 2, 595–610. doi: 10.1002/jbmr.5650020617
Peterlik, H., Roschger, P., Klaushofer, K., and Fratzl, P. (2006). From brittle to ductile fracture of bone. Nat. Mater. 5, 52–55. doi: 10.1038/nmat1545
Reilly, D. T., and Burstein, A. H. (1975). The elastic and ultimate properties of compact bone tissue. J. Biomech. 8, 393–405. doi: 10.1016/0021-9290(75)90075-5
Reilly, G. C. (2000). Observations of microdamage around osteocyte lacunae in bone. J. Biomech. 33, 1131–1134. doi: 10.1016/S0021-9290(00)00090-7
Rho, J. Y., Kuhn-Spearing, L., and Zioupos, P. (1998). Mechanical properties and the hierarchical structure of bone. Med. Eng. Phys. 20, 92–102. doi: 10.1016/S1350-4533(98)00007-1
Schaffler, M. B., Choi, K., and Milgrom, C. (1995). Aging and matrix microdamage accumulation in human compact bone. Bone 17, 521–525. doi: 10.1016/8756-3282(95)00370-3
Schneider, P., and Müller, R. (2010). Automated micro-compression device for dynamic image-guided failure assessment of bone ultrastructure and bone microdamage. Biomed. Eng. 55, 8–10. doi: 10.1515/BMT.2010.703
Schneider, P., Stauber, M., Voide, R., Stampanoni, M., Donahue, L. R., and Müller, R. (2007). Ultrastructural properties in cortical bone vary greatly in two inbred strains of mice as assessed by synchrotron light based micro- and nano-CT. J. Bone Miner. Res. 22, 1557–1570. doi: 10.1359/jbmr.070703
Schneider, P., Voide, R., Stampanoni, M., Donahue, L. R., and Muller, R. (2013). The importance of the intracortical canal network for murine bone mechanics. Bone 53, 120–128. doi: 10.1016/j.bone.2012.11.024
Schneider, P., Voide, R., Stampanoni, M., and Müller, R. (2009). Post-processing technique for improved assessment of hard tissues in the submicrometer domain using local synchrotron radiation-based computed tomography. Biomed. Tech. Biomed. Eng. 54, 48–54. doi: 10.1515/BMT.2009.007
Stampanoni, M., Groso, A., Isenegger, A., Mikuljan, G., Chen, Q., Meister, D., et al. (2007). TOMCAT: a beamline for tomographic microscopy and coherent radiology experiments. Sync. Radiat. Instrument. 879, 848–851. doi: 10.1063/1.2436193
Thurner, P. J., Wyss, P., Voide, R., Stauber, M., Stampanoni, M., Sennhauser, U., et al. (2006). Time-lapsed investigation of three-dimensional failure and damage accumulation in trabecular bone using synchrotron light. Bone 39, 289–299. doi: 10.1016/j.bone.2006.01.147
Tommasini, S. M., Trinward, A., Acerbo, A. S., De Carlo, F., Miller, L. M., and Judex, S. (2012). Changes in intracortical microporosities induced by pharmaceutical treatment of osteoporosis as detected by high resolution micro-CT. Bone 50, 596–604. doi: 10.1016/j.bone.2011.12.012
Turner, C. H. (2006). Bone strength: current concepts. Skelet. Dev. Remodel. Health Dis. Aging 1068, 429–446. doi: 10.1196/annals.1346.039
Turner, C. H., Hsieh, Y. F., Müller, R., Bouxsein, M. L., Baylink, D. J., Rosen, C. J., et al. (2000). Genetic regulation of cortical and trabecular bone strength and microstructure in inbred strains of mice. J. Bone Miner. Res. 15, 1126–1131. doi: 10.1359/jbmr.2000.15.6.1126
Voide, R., Schneider, P., Stauber, M., Van Lenthe, G. H., Stampanoni, M., and Müller, R. (2011). The importance of murine cortical bone microstructure for microcrack initiation and propagation. Bone 49, 1186–1193. doi: 10.1016/j.bone.2011.08.011
Voide, R., Schneider, P., Stauber, M., Wyss, R., Stampanoni, M., Sennhauser, U., et al. (2009). Time-lapsed assessment of microcrack initiation and propagation in murine cortical bone at submicrometer resolution. Bone 45, 164–173. doi: 10.1016/j.bone.2009.04.248
Voide, R., Van Lenthe, G. H., and Müller, R. (2008a). Bone morphometry strongly predicts cortical bone stiffness and strength, but not toughness, in inbred mouse models of high and low bone mass. J. Bone Miner. Res. 23, 1194–1203. doi: 10.1359/jbmr.080311
Voide, R., Van Lenthe, G. H., and Müller, R. (2008b). Differential effects of bone structural and material properties on bone competence in C57BL/6 and C3H/He inbred strains of mice. Calcif. Tissue Int. 83, 61–69. doi: 10.1007/s00223-008-9120-y
Voide, R., Van Lenthe, G. H., and Müller, R. (2008c). Femoral stiffness and strength critically depend on loading angle: a parametric study in a mouse-inbred strain. Biomed. Tech. Biomed. Eng. 53, 122–129. doi: 10.1515/BMT.2008.019
Voide, R., Van Lenthe, G. H., Stauber, M., Schneider, P., Thurner, P. J., Wyss, P., et al. (2008d). Functional microimaging: a hierarchical investigation of bone failure behavior. J. Jpn. Soc. Bone Morphometry 18, 9–21. Available Online at: https://ci.nii.ac.jp/naid/10024127139
Wehrli, F. W. (2007). Structural and functional assessment of trabecular and cortical bone by micro magnetic resonance imaging. J. Magn. Reson. Imaging 25, 390–409. doi: 10.1002/jmri.20807
Keywords: bone, microstructure, synchrotron radiation-based computed tomography, dynamic image-guided failure assessment, step-wise micro-compression, microdamage
Citation: Levchuk A, Schneider P, Meier M, Vogel P, Donaldson F and Müller R (2018) An Automated Step-Wise Micro-Compression Device for 3D Dynamic Image-Guided Failure Assessment of Bone Tissue on a Microstructural Level Using Time-Lapsed Tomography. Front. Mater. 5:32. doi: 10.3389/fmats.2018.00032
Received: 09 November 2017; Accepted: 15 May 2018;
Published: 05 June 2018.
Edited by:
Gianluca Tozzi, University of Portsmouth, United KingdomReviewed by:
Andrew Anthony Pitsillides, Royal Veterinary College, United KingdomAndrew J. Bodey, Diamond Light Source, United Kingdom
Copyright © 2018 Levchuk, Schneider, Meier, Vogel, Donaldson and Müller. This is an open-access article distributed under the terms of the Creative Commons Attribution License (CC BY). The use, distribution or reproduction in other forums is permitted, provided the original author(s) and the copyright owner are credited and that the original publication in this journal is cited, in accordance with accepted academic practice. No use, distribution or reproduction is permitted which does not comply with these terms.
*Correspondence: Ralph Müller, cmFtQGV0aHouY2g=