 Mohanad Mousa
 Yu Dong
- School of Civil and Mechanical Engineering, Curtin University, Perth, WA, Australia
Polyvinyl alcohol (PVA) nanocomposite films reinforced with bamboo charcoal (BC) nanoparticles were successfully fabricated via solution casting and their nanomechanical properties in terms of material phases were determined by a peak force quantitative nanomechanical tapping mode (PFQNM). Our experimental results revealed that the elastic modulus of PVA semicrystalline phase in stack-bundle form was 24 ± 4.2 GPa with the semicrystalline phase width being 20–76 nm, as opposed to 11.4 ± 3.1 GPa and 18–65 nm for corresponding PVA amorphous phase accordingly. The incorporation of BC nanoparticles enhanced the elastic moduli of both crystalline and amorphous phases of PVA by ~51% and ~100%, respectively. Moreover, the phase width was decreased to be in range of 5–53 nm for crystalline phase and 4–35 nm for amorphous phase.
Introduction
Advances in material science have led to increasing annual production of synthetic polymers. To date 8.3 billion metric tons of synthetic polymers have been produced (Geyer et al., 2017), and 6.3 billion metric tons became the waste, of which only about 9% has been recycled along with 12% incineration. The other 79% of plastic waste is stored in landfills or else directly released into the environment (Geyer et al., 2017). With increasing the production of synthetic polymers, serious concerns have been raised in relation to heavy pollution to ground and surface water, as well as landfilling. More importantly, the disposal of synthetic polymers becomes more challenging considering that a majority of these polymers resist physical and chemical degradation (Jayasekara et al., 2005; Mousa et al., 2016). As such, PVA, as one of popular biopolymers has received great attention as the alternative to general synthetic polymers owing to its good flexibility, water solubility, recyclability and biotribological properties. PVA was widely used for industrial applications such as tissue engineering, pharmaceutical formation, drug delivery, cosmetics and biosensors (Yang et al., 2008; Dorigato and Pegoretti, 2012; Huang and Wang, 2013; Cataldi et al., 2018). Carbon based nanofillers such as carbon nanotubes (CNTs) are considered as more effective nanoreinforcements. However, high material cost and nanotoxicity may hinder their widespread use in nanocomposite systems since human cells can be damaged by inhaling CNT nanoparticles that are potentially accumulated in cytoplasm (Mousa et al., 2016). On the other hand, evident particle agglomeration at high content levels becomes a typical obstacle to the use of graphene sheets. In particular, when the toxic and biocompatible levels of graphene oxides (GOs) were examined on A549 cells (Chang et al., 2011), it was noted that oxidative stress arouse from the inclusion of GOs, which induced a slight decrease in cell viability at high GO contents. Among different biocompatible nanofillers, bamboo charcoal (BC) nanoparticles are regarded as newly used carbon-based nanofillers with great potential due to their extraordinary characteristics such as eco-friendliness, environmental sustainability and high adsorption performance (Liao et al., 2012). Furthermore, high specific surface area and large pore volume of BCs render them to be successfully used for humidity regulators (Yeh et al., 2009), removing adverse effect of harmful gasses, anti-bacterial (Li et al., 2014) and anti-fungal features. BCs with rough walls and internal pores (Gray et al., 2014) can actively interact with hydrophilic PVA molecules resulting in high-pressure positive capillary to drive those molecular chains into BC pores with both mechanical and chemical bondings according to the Laplace theory (Brockhoff et al., 2010; Gray et al., 2014).
In a nanocomposite system, conventional mechanical testing is often used to evaluate the elastic behavior of bulk materials at a macroscopic level. Nevertheless, the features of interfacial bonding between polymer matrices and nanofillers, as well as local nanoreinforcement effect and deformation directly determined by experimental measurements have not been holistically studied (Xiong et al., 2016). As expected, the elastic behavior of polymer nanocomposites can be totally different at a nanoscaled level. Even with respect to neat polymers alone, the elastic modulus of crystalline phases for semicrystalline polymers has been found to be much higher than that of amorphous phases (Panaitescu et al., 2015). It was suggested that in a peak-force quantitative tapping mode (PFQNM), the elastic modulus of polypropylene crystalline phase was increased by 69.23% as opposed to that of amorphous phase (Voss et al., 2014). In a similar manner, elastic modulus of PVA crystalline phase was enhanced by 15% when compared with that of its amorphous phase (Pakzad et al., 2012). On the other hand, the incorporation of nanofillers and resulting interphases in terms of highly distinct interphase dimensions and properties not only can change the property of polymer matrices, but also greatly influence the material performance of resulting nanocomposites. For instance, the analysis of epoxy/carbon fiber composites according to dynamic nanomechanical imaging technique demonstrated that the existence of interphase between carbon fibers and epoxy matrices (interphase thickness: 118 ± 3 nm) tended to enhance the storage modulus of neat epoxy from 17.2 GPa to be in range of 26–45 GPa in the interphase regions (Gu et al., 2010).
In our previous work (Mousa and Dong, 2018b), very strong PVA nanocomposite films with the incorporation of BC nanoparticles were prepared at different BC contents of 0, 3, 5, and 10 wt% with the average particle diameter of 69.43 nm. The maximum increase of tensile strength of such nanocomposites was achieved by 110% with the reinforcement of 3 wt% BC nanoparticles as opposed to that of neat PVA at 70.32 MPa. This significant improvement of tensile strength is believed to be associated with the inclusion of BC nanoparticles to affect morphological structures and nanomechanical behavior of PVA phases in PVA/BC nanocomposites. Consequently, nanomechanical properties in relation to crystalline and amorphous phases of PVA were investigated in this study with or without the incorporation of BC nanoparticles in order to understand the effect of nanofillers on mechanical performance of PVA nanophases in PVA/BC nanocomposites via PFQNM.
Materials
Bamboo charcoal (BC) nanoparticles was purchased from US Research Nanomaterials, Inc. Co., USA with specific surface area and average particle diameter being 624.81 m2/g and 69.43 nm, respectively (Mousa and Dong, 2018b). PVA powders (commercial grade: MFCD00081922) were obtained from Sigma Aldrich Pty. Ltd, Australia at the saponification degree above 99%.
Fabrication of Bionanocomposite Films
Typical procedure for the fabrication of PVA /BC nanocomposite films was mentioned in details in our previous work (Mousa and Dong, 2018b). Briefly, PVA solution was obtained by dissolving 10 g PVA pellets in 190 ml deionized water via vigorous magnetic stirring at 90°C for 3 h. In the meantime, BC suspension was prepared separately by blending particles in deionized water under mechanical mixing at 40°C for 2 h, and then followed by ultra-sonication for 1 h at 25 kHz and 40°C. Moreover, BC aqueous suspensions were gradually added in a dropwise manner into PVA solutions, which was simultaneously subjected to mechanical mixing at 40°C for 2 h. Then, such a mixture was stirred at 90°C for 1 h prior to the following sonication for 30 min to achieve uniform BC dispersion. The optimum BC content of 3 wt% was chosen according to our previously determined results (Mousa and Dong, 2018b) in the manufacture of final PVA/BC nanocomposites. Homogeneous PVA/BC solution was cast into a glass petri dish subjected further drying in an air-circulating oven at 40°C until nanocomposite thin films (thickness: ~0.8 mm) were peeled off.
Characterization Methods
Nanomechanical properties of PVA/BC nanocomposites were measured by PFQNM in this study (Wu et al., 2008; Pittenger, 2009; Mousa and Dong, 2018a). Force-distance measurments were collected at high modulation frequencies of 1–2 kHz to acquire two-dimensional arrays containing a force-distance curve at each pixel (Pittenger, 2009; Mousa and Dong, 2018a). The cantilever follows the sinusoidal movement of cantilever base because this system is driven at a frequency far below cantilever's resonant frequency. During the scanning process, the feedback loop of tapping mode controls the peak on the tip so that material sample and AFM tip can be protected from any damages. Material property in term of adhesion, modulus, deformation and energy dissipation are acquired at each single tap by analyzing force-distance data, as illustrated in Figure 1. At the step (1), the tip is still far away from the sample with little or no force on the tip. As the tip approaches the sample surface, the cantilever is pulled down by attraction forces (e.g., van der Waals, capillary or electrostatic forces), which can be represented by the force below the horizontal axis in Figure 1A. At the step (2), attractive forces overcome cantilever stiffness and the tip is pulled to the surface until it touches the sample surface shown in Figure 1B. Then the tip is pushed into the sample until the force reaches the peak force at the step (3). Subsequently, the probe begins to pull up from sample surface and the peak force decreases to a minimum point at the step (4). The adhesion represents the force at this point. Finally, the tip comes off the surface until it reaches step (5), which is called the “pull-off” step.
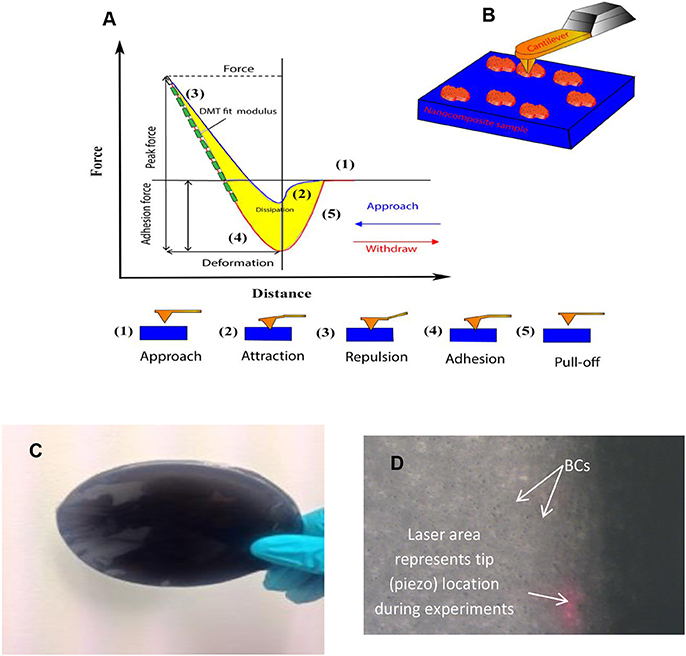
Figure 1. (A) schematic diagram of force vs. tip-sample separation obtained from AFM tapping on the sample surface where the separation is calculated from z peizo position and cantilever deflection (Blue and red curves denote loading and unloading portions, respectively and green dash line is obtained by DMT model fitting. The minimum force in the withdraw curve is used for mapping adhesion force. Steps from (1) to (5) represent tip-sample interactions throughout 0.5 ms (Pakzad et al., 2012), Reprinted with copyright permission from Elsevier, (B) schematic diagram representing a probe tapping process for nanocomposite samples,(C) typical PVA/BC nanocomposite film, and (D) probe-tip location on the film surface of PVA/BC nanocomposites.
The elastic modulus can be determined by fitting the green dash line in Figure 1A to Derjaguin-Muller-Toropov (DMT) model using the following equation (Derjaguin et al., 1975)
Where FLc−Fadh is the net force between the cantilever force (FLc) and the adhesion force (Fadh), E*is the reduced Young's modulus, R is the tip-end radius, and z−zo is the deformation on the sample as defined by the difference between current piezo position z and orginal position z0.The reduced modulus E* can be used to determine sample modulus (Es) when the elastic modulus of AFM tip (Etip) and poisson's ratios of the sample and AFM tip (i.e., vs and vtip) are given, respectively according to the rearranged equation as follows (Pittenger, 2009; Mousa and Dong, 2018a):
The second mechanical property acquired in AFM topographic mapping is adhesion force, which can be identified by the minimum force in Figure 1A.The source of adhesion force can be any attraction between AFM tip and material sample. The yellow region in Figure 1A corresponds to the dissipation energy into the sample during a tapping cycle. Elastic modulus, dissipation energy and adhesion are generally measured at a specific modulation frequency, which thus cannot represent complete rheological tests. Material deformation or tip indentation depth into crystalline and amorphous phases of surface samples can be quantified from the difference in the separation between tip sample at the point where the peak force is zero.
In this work, nanomechanical properties and topographical characteristics for PVA nanocomposite films (see Figure 1C) were obtained by using a Bruker Dimension FastScan AFM system in PFQNM. Moreover, AFM tests were carried out on nanocomposite films at room temperature of ~25°C with relative humidity about 30%. Nanomechanical mapping presented in this research was acquired using a Bruker RTESPA 525A probe specified with the nominal spring constant of 200 N/m, nominal tip radius of 8 nm and nominal resonant frequency of 525 kHz. Moreover, prior to each test, the deflection sensitivity was calibrated using the stiff sapphire-12 surface and corresponding spring constant was detected by using a thermal tuning method (Pittenger, 2009). AFM imaging analysis was performed by using the RTESPA Bruker probes with the normal spring constant of 40 N/m and tip radius of 8 nm. The resonant frequency was about 2 Hz with 256 × 256 digital pixel resolution. Three nanocomposite film samples in size of 1.5 × 1.5 cm were cut for further AFM work. For each sample, five different zones based on probe-tip locations in Figure 1D were investigated for AFM mapping images accordingly.
Results and Discussion
Nanomechanical properties of PVA films were presented in Figure 2. As seen in Figure 2A, there are two typical distinct phases known as crystalline phase (in bright white color) and amorphous phase (in dark color), which are generally detected in semicrystalline polymers like PVA (Voss et al., 2014; Panaitescu et al., 2015). DMT modulus mapping image of PVA, as illustrated in Figure 2B, was analyzed in a typical section A1-B1 with associated results depicted in Figure 2C. The regions with a high modulus level of 24 ± 4.2 GPa and phase width of 20–76 nm were related to the bundles of semicrystalline stacks in crystalline phase. This value appeared to be far higher than the elastic modulus of 9.9 GPa for local PVA/poly (acrylic acid) (PAA) nanophases, as previously reported by Pakzad et al. (2012). Nonetheless, it was as close as to the corresponding modulus of 23.69 GPa obtained from PVA/chitosan composite film coating (Mishra and Kannan, 2014). In comparison, the regions assigned to amorphous phase had a relatively low modulus of 11.4 ± 3.1 GPa along with the amorphus phase width of 18–65 nm. The variation of crystalline phase width is attributed to different orientation of semicrystalline stack bundles for the designated section (Panaitescu et al., 2013). Elastic modulus of bulk PVA films was about 2.08 GPa at a macroscopic level (Mousa and Dong, 2018b), which is less than that of local PVA nanoscaled regions based on AFM. Such a phenomenon is mainfested when nanomechanical properties are compared with those of bulk composites (Gu et al., 2010; Niu et al., 2016). In epoxy/carbon fiber composites, nanomechanical results showed that the modulus of epoxy was 17 GPa as opposed to 3–4 GPa for bulk composites (Gu et al., 2010). In a similar manner, local PVA nanoscaled region yielded a elastic modulus of 11.9 GPa in contrast with 2.08 GPa for bulk PVA films (Mousa and Dong, 2018b). Such differences can be associated with several reasons for consideration. First of all, the shape function of the topmost probe tip may not be accurate enough at the low indentation depth (Clifford and Seah, 2005; Yedla et al., 2008) notwithstanding the calibration of AFM parameters before each measurement. Low indentation depth comes from low indentation force used to induce residual stress and plastic deformation from next indents, thus leading to the maximization of lateral resolution capabilities, particularly at a nanoscaled level. Secondly, in many cases, nanoproperties of local material surfaces vary greatly from bulk properties. The penetration depth plays an important role in the measurement of elastic modulus at a nanoscaled level, which is attributed to the discrepancy in morphological structures between outer skins on local material surfaces and bulk materials (Clifford and Seah, 2005). Finally, it is worth mentioning that distinct measurement mechanisms mainly arise from PFQNM for local DMT modulus and conventional tensile testing for tensile modulus in material bulk properties (Syed Asif et al., 2001).
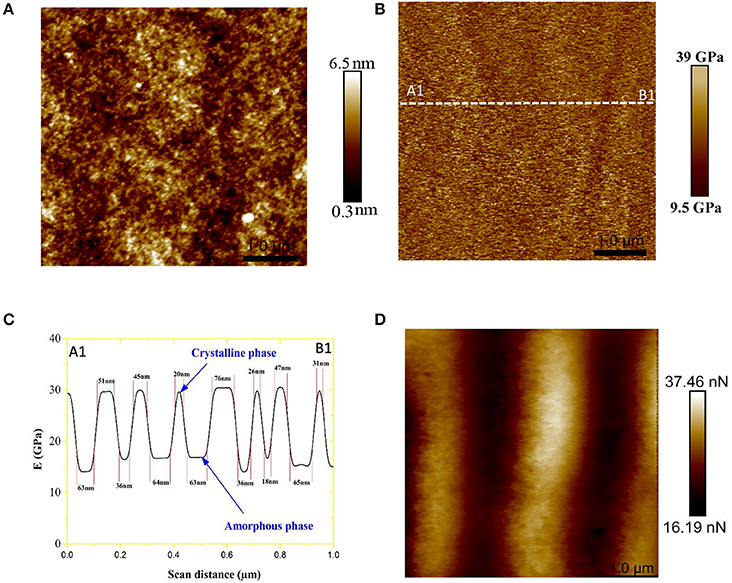
Figure 2. 2D AFM mapping images of PVA films for (A) height and (B) DMT modulus, (C) DMT modulus-scan distance curve for corresponding typical section A1-B1 in (B) and (D) 2D adhesion mapping image of PVA films.
The difference in PVA phases could also be characterized by the adhesion force mapping image exhibited in Figure 2D, in which adhesion forces for cyrstalline and amorphous phases were measured to be 19.7 ± 0.6 and 33 ± 2.8 nN, respectively. The higher adhesion force of amorphous phases may result from prevalent viscoelastic material behavior generally taking place in amorphous polymers in a non-glassy state. This finding indicates that amorphus phases have relatively low density and surface tension as compared to crystalline phases (Voss et al., 2014).
The DMT modulus profile of PVA/BC bionanocomposites in Figure 3B was assessed on a typical section A2-B2, as depicted in Figure 3A. The circled peaks with relatively high modulus values can be associated with the presence of BCs within PVA matrices. In addition, the cyclic pattern of low and high modulus domains, depicted in Figure 3B, can be correlated with the alternating sequence of amorphous and crystalline phases of PVA accordingly, which becomes a very common trend in semi-crystalline polymers (Panaitescu et al., 2013; Voss et al., 2014) Furthermore, the modulus trend of PVA nanocomposites with the addition of 3 wt% BCs, as shown in Figure 3B, is totally different from that of neat PVA along with the change in the degree of structural orderness, Figure 2C. Such a difference can be attributed to the reinforcing effect of BCs on both crystalline and amorphous phases of PVA matrices (Manna et al., 2016). The morphological structures of nanocomposites in term of height and adhesion force mapping were further investigated at high magnifications in Figures 3C,D with the data analysis of DMT modulus profile on a typical section A3-B3 presented in Figure 3E. It could be noticed that both crystalline and amorphous phase widths were in range of 5–53 and 4–35 nm, respectively, appearing to be lower than that of corresponding PVA, Figure 2C. Decreasing the phase width means the reduction of stack sizes accordingly from neat polymer to nanocomposite films. In other words, the number of lamellae stacks per unit volume, on the other hand, increases from PVA to PVA/BC nanocomposites, as suggested in Figure 3F, thus resulting in the improvement of tensile strengths of nanocomposites. This phenomenon could be interpreted by the Hall–Petch relation (Hall, 1951; Song et al., 2015), in which yield stress and tensile stress are dependent on the grain size. As a consequence, according to our previous work (Mousa and Dong, 2018b), much higher tensile strength of PVA/BC nanocomposites at 147.94 MPa could be achieved as opposed to that of PVA at 70.32 MPa with the inclusion of 3 wt% BCs. This nanomeasurement offers the insight to establish a more accurate theoretical modeling framework by combining both nanomechanical properties and bulk properties at the macrosopic level of nanocomposites.
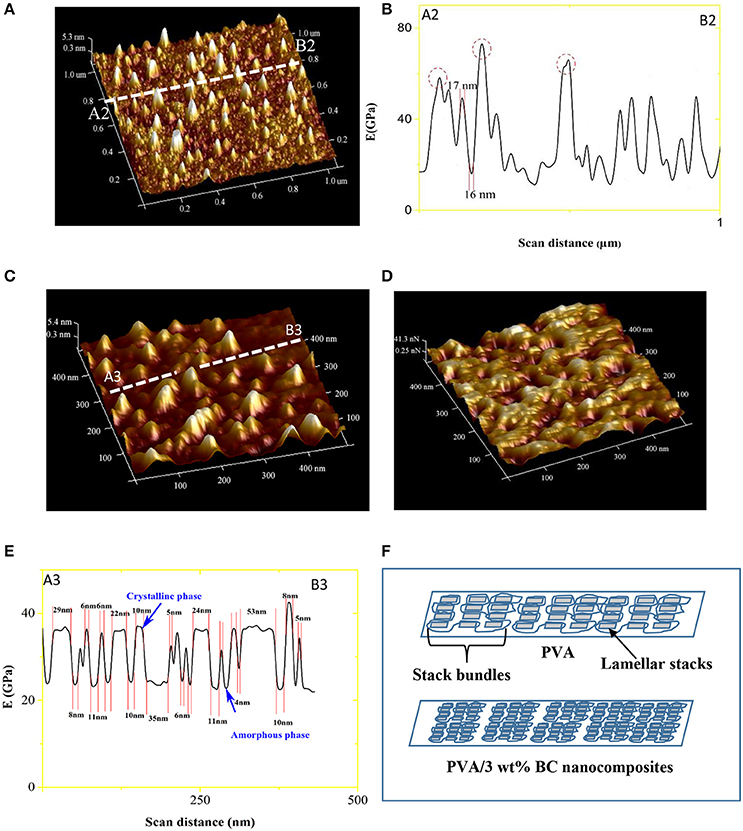
Figure 3. (A) 3D AFM height mapping image of PVA/BC nanocomposites and (B) DMT modulus-scan distance curve for corresponding typical section A2-B2 in (A), 3D AFM mapping images of PVA/BC nanocomposites for (C) height and (D) adhesion force at high magnifications, (E) DMT modulus-scan distance curve for corresponding typical section A3-B3 in (C) and (F) schematic diagram for bundles of lamellar stacks in both PVA and PVA /BC nanocomposite films.
Conclusions
In this study, nanomechanical properties of PVA phases with and without BC nanoparticles were determined via PFQNM. The AFM measurements of PVA films indicated that elastic moduli of PVA crystalline and amorphous phases in morphological structures vary from 24 ± 4.2 to 11.4 ± 3.1 GPa, respectively. Moreover, its crystalline and amorphous phase widths were detected to be 20–76 and 18–65 nm, respectively, as opposed to 5–53 and 4–35 nm for corresponding counterparts in PVA/BC nanocomposites. With the incorporation of BCs, the lamellae size increased with increasing the number of lamellae stacks per unit volume, which was believed to be a major reason for the significant improvement of tensile strength of PVA/BC nanocomposites. The nanomechanical characterization implemented in this study offers good opportunity to understand the effect of BC nanoparticles on nanomechanical properties of PVA phases as the appropriate guidance to further investigate the nexus between nanomechanical properties and bulk mechanical properties of polymer nanocomposites.
Author Contributions
MM did the experimental work and characterization of material samples, MM and YD analyzed the data and jointly prepared the research manuscript.
Conflict of Interest Statement
The authors declare that the research was conducted in the absence of any commercial or financial relationships that could be construed as a potential conflict of interest.
Acknowledgments
The first author MM acknowledges the Higher Committee for Education Development (HCED) in Iraq to award the research scholarship for his PhD studies at Curtin University. The authors would also like to thank Dr. Thomas Becker from Nanochemistry Research Institute, Curtin University for the technical assistance in PFQNM measurements.
References
Brockhoff, S. R., Christians, N. E., Killorn, R. J., Horton, R., and Davis, D. D. (2010). Physical and mineral-nutrition properties of sand-based turfgrass root zones amended with biochar. Agron. J. 102, 1627–1631. doi: 10.2134/agronj2010.0188
Cataldi, A., Rigotti, D., Nguyen, V., and Pegoretti, A. (2018). Polyvinyl alcohol reinforced with crystalline nanocellulose for 3D printing application. Mater. Today Commun. 15, 236–244. doi: 10.1016/j.mtcomm.2018.02.007
Chang, Y., Yang, S. T., Liu, J. H., Dong, E., Wang, Y., Cao, A., et al. (2011). in vitro toxicity evaluation of graphene oxide on A549 cells. Toxicol. Lett. 200, 201–210. doi: 10.1016/j.toxlet.2010.11.016
Clifford, C. A., and Seah, M. P. (2005). Quantification issues in the identification of nanoscale regions of homopolymers using modulus measurement via AFM nanoindentation. Appl. Surf. Sci. 252, 1915–1933. doi: 10.1016/j.apsusc.2005.08.090
Derjaguin, B. V., Muller, V. M., and Toporov, Y. P. (1975). Effect of contact deformations on the adhesion of particles. J. Colloid Interf. Sci. 53, 314–326. doi: 10.1016/0021-9797(75)90018-1
Dorigato, A., and Pegoretti, A. (2012). Biodegradable single-polymer composites from polyvinyl alcohol. Colloid Polym. Sci. 290, 359–370. doi: 10.1007/s00396-011-2556-z
Geyer, R., Jambeck, J. R., and Law, K. L. (2017). Production, use, and fate of all plastics ever made. Sci. Adv. 3:e1700782. doi: 10.1126/sciadv.1700782
Gray, M., Johnson, M. G., Dragila, M. I., and Kleber, M. (2014). Water uptake in biochars: the roles of porosity and hydrophobicity. Biomass Bioenergy 61, 196–205. doi: 10.1016/j.biombioe.2013.12.010
Gu, Y., Li, M., Wang, J., and Zhang, Z. (2010). Characterization of the interphase in carbon fiber/polymer composites using a nanoscale dynamic mechanical imaging technique. Carbon 48, 3229–3235. doi: 10.1016/j.carbon.2010.05.008
Hall, E. O. (1951). The deformation and ageing of mild steel: III discussion of results. Proc. Phys. Soc. B, 64, 747. doi: 10.1088/0370-1301/64/9/303
Huang, D., and Wang, A. (2013). Non-covalently functionalized multiwalled carbon nanotubes by chitosan and their synergistic reinforcing effects in PVA films. RSC Adv. 3, 1210–1216. doi: 10.1039/C2RA22016D
Jayasekara, R., Harding, I., Bowater, I., and Lonergan, G. (2005). Biodegradability of a selected range of polymers and polymer blends and standard methods for assessment of biodegradation. J. Polym. Environ. 13, 231–251. doi: 10.1007/s10924-005-4758-2
Li, X., Lei, B., Lin, Z., Huang, L., Tan, S., and Cai, X. (2014). The utilization of bamboo charcoal enhances wood plastic composites with excellent mechanical and thermal properties. Mater. Des. 53, 419–424. doi: 10.1016/j.matdes.2013.07.028
Liao, P., Ismael, Z. M., Zhang, W., Yuan, S., Tong, M., Wang, K., et al. (2012). Adsorption of dyes from aqueous solutions by microwave modified bamboo charcoal. Chem. Eng. J. 195, 339–346. doi: 10.1016/j.cej.2012.04.092
Manna, K., Srivastava, S. K., and Mittal, V. (2016). Role of enhanced hydrogen bonding of selectively reduced graphite oxide in fabrication of poly (vinyl alcohol) nanocomposites in water as EMI shielding material. J. Phys. Chem. C 120, 17011–17023. doi: 10.1021/acs.jpcc.6b03356
Mishra, S. K., and Kannan, S. (2014). Development, mechanical evaluation and surface characteristics of chitosan/polyvinyl alcohol based polymer composite coatings on titanium metal. J. Mech. Behav. Biomed. Mater. 40, 314–324. doi: 10.1016/j.jmbbm.2014.08.014
Mousa, M., and Dong, Y. (2018b). Strong polyvinyl alcohol (PVA)/bamboo charcoal (BC) nanocomposite films with particle size effect. ACS Sustain. Chem. Eng. 6, 467–479. doi: 10.1021/acssuschemeng.7b02750
Mousa, M., and Dong, Y. (2018a). Novel three-dimensional interphase characterisation of polymer nanocomposites using nanoscaled topography. Nanotechnology 29:385701. doi: 10.1088/1361-6528/aacd5d
Mousa, M. H., Dong, Y., and Davies, I. J. (2016). Recent advances in bionanocomposites: preparation, properties, and applications. Int. J. Polym. Mater. Polym. Biomater. 65, 225–254. doi: 10.1080/00914037.2015.1103240
Niu, Y. F., Yang, Y., Gao, S., and Yao, J. W. (2016). Mechanical mapping of the interphase in carbon fiber reinforced poly (ether-ether-ketone) composites using peak force atomic force microscopy: interphase shrinkage under coupled ultraviolet and hydro-thermal exposure. Polym. Test. 55, 257–260. doi: 10.1016/j.polymertesting.2016.09.008
Pakzad, A., Simonsen, J., and Yassar, R. S. (2012). Gradient of nanomechanical properties in the interphase of cellulose nanocrystal composites. Compos. Sci. Technol. 72, 314–319. doi: 10.1016/j.compscitech.2011.11.020
Panaitescu, D. M., Frone, A. N., Ghiurea, M., and Chiulan, I. (2015). Influence of storage conditions on starch/PVA films containing cellulose nanofibers. Ind. Crops Prod. 70, 170–177. doi: 10.1016/j.indcrop.2015.03.028
Panaitescu, D. M., Frone, A. N., and Nicolae, C. (2013). Micro-and nano-mechanical characterization of polyamide 11 and its composites containing cellulose nanofibers. Eur. Polym. J. 49, 3857–3866. doi: 10.1016/j.eurpolymj.2013.09.031
Pittenger, B. (2009). Bruker Application Note 128: Quantitative Mechanical Mapping at Nanoscale With Peak Force QNM. Available Online at: https://www.bruker.com/fileadmin/user_upload/8-PDF-Docs/SurfaceAnalysis/AFM/ApplicationNotes/AN128-RevB0-Quantitative_Mechanical_Property_Mapping_at_the_Nanoscale_with_PeakForceQNM-AppNote.pdf
Song, K., Zhang, Y., and Minus, M. L. (2015). Polymer interphase self-reinforcement and strengthening mechanisms in low-loaded nanocomposite fibers. Macromol. Chem. Phys. 216, 1313–1320. doi: 10.1002/macp.201500011
Syed Asif, S. A., Wahl, K. J., Colton, R. J., and Warren, O. L. (2001). Quantitative imaging of nanoscale mechanical properties using hybrid nanoindentation and force modulation. J. Appl. Phys. 90, 1192–1200. doi: 10.1063/1.1380218
Voss, A., Stark, R. W., and Dietz, C. (2014). Surface versus volume properties on the nanoscale: elastomeric polypropylene. Macromolecules 47, 5236–5245. doi: 10.1021/ma500578e
Wu, K. H., Ting, T. H., Liu, C. I., Yang, C. C., and Hsu, J. S. (2008). Electromagnetic and microwave absorbing properties of Ni0.5 Zn0.5 Fe2 O4/bamboo charcoal core–shell nanocomposites. Compos. Sci. Technol. 68, 132–139. doi: 10.1016/j.compscitech.2007.05.028
Xiong, R., Hu, K., Grant, A. M., Ma, R., Xu, W., Lu, C.V, et al. (2016). Ultrarobust transparent cellulose nanocrystal graphene membranes with high electrical conductivity. Adv. Funct. Mater. 28, 1501–1509. doi: 10.1002/adma.201504438
Yang, X., Zhang, X., Liu, Z., Ma, Y., Huang, Y., and Chen, Y. (2008). High-efficiency loading and controlled release of doxorubicin hydrochloride on graphene oxide. J. Phy. Chem. C 112, 17554–17558. doi: 10.1021/jp806751k
Yedla, S. B., Kalukanimuttam, M., Winter, R. M., and Khanna, S. K. (2008). Effect of shape of the tip in determining interphase properties in fiber reinforced plastic composites using nanoindentation. J. Eng. Mater. Technol. 130:041010. doi: 10.1115/1.2975234
Keywords: nanocomposites, nanomechanical properties, polyvinyl alcohol (PVA), bamboo charcoal (BC) nanoparticles, peak force quantitative nanomechanical tapping mode (PFQNM)
Citation: Mousa M and Dong Y (2018) Elastic Behavior of Nanophases in Polyvinyl Alcohol (PVA)/Bamboo Charcoal (BC) Nanocomposite Films. Front. Mater. 5:44. doi: 10.3389/fmats.2018.00044
Received: 12 February 2018; Accepted: 09 July 2018;
Published: 03 August 2018.
Edited by:
Jinsong Leng, Harbin Institute of Technology, ChinaReviewed by:
Francesca Lionetto, University of Salento, ItalyAlessandro Pegoretti, University of Trento, Italy
Copyright © 2018 Mousa and Dong. This is an open-access article distributed under the terms of the Creative Commons Attribution License (CC BY). The use, distribution or reproduction in other forums is permitted, provided the original author(s) and the copyright owner(s) are credited and that the original publication in this journal is cited, in accordance with accepted academic practice. No use, distribution or reproduction is permitted which does not comply with these terms.
*Correspondence: Yu Dong, eS5kb25nQGN1cnRpbi5lZHUuYXU=