 Byung-Keun Song1
 Tausif Mulla
 Seung-Bok Choi
- 1Department of Mechanical System Engineering, Incheon National University, Incheon, South Korea
- 2Department of Mechanical Engineering, Inha University, Incheon, South Korea
This paper discusses the potential use of deionized water as a smart material for actuating microsystems. Dielectric liquids such as water exhibit significant displacement under a high electric field. Alike smart materials, oscillations of such dielectric liquids can be manipulated using controlled voltage. This study investigates the actuation of a water droplet by applying an electrical voltage across two parallel plate electrodes covered by a thin dielectric material. The dynamic characteristics of the water droplet response are evaluated using step input voltage. The sensitivity of the droplet response to a change in the system parameters is also analyzed. The procedure of analysis of variance is adopted to analyze the effectiveness and the combined effect of different parameters on the response. Accordingly, several parameters such as the relative permittivity of the dielectric substrate, thickness of the dielectric substrates, gap between the electrodes, relative permittivity of the dielectric fluid, and applied electric voltage are chosen as control factors. The steady-state response and damping ratio are considered as the output responses. The quadratic regression model associated with the response surface methodology is thereafter used to correlate the output response with the system parameters. It is shown that the gap between the electrodes is the dominant factor affecting the steady-state response whereas the thickness of the dielectric substrate is the dominant factor affecting the damping ratio. In addition, a good consistency is observed between the predicted and experimental responses.
Introduction
Recent developments in smart materials have facilitated their use in various microsystems. Smart materials can be defined as materials that react in suitable, consistent, and repeating manner under an external force or reagent to perform a specific task (Bogue, 2012). Solid-type smart materials, such as piezoceramics and shape memory alloys, are widely used to precisely control and manipulate the motion of a system by stimulating them. Piezoceramic materials have good electrical control and can produce high actuating force (Judy, 2001). Another class of smart materials called as smart fluids comprises magneto-rheological fluids, electro-rheological fluids, colloidal fluids, ionic liquids, polar solvents, etc. These fluids are used for various applications such as heat dissipation, damping control, and actuating microsystems. However, both types of smart materials have certain demerits-they are expensive, require precise manufacturing, and exhibit some critical hysteresis behavior (Jung and Gweon, 2000; Bell et al., 2005). Dielectric and ionic liquids are widely used in microfluidic systems for transportation, separation, and mixing phenomena. Such types of liquids can be significantly treated as smart materials for actuating microsystems (Zhang et al., 2016). These liquids have low energy consumption. They can be easily actuated in simple and reduced geometries at nano and micro scales (Chen et al., 2009). This can reduce the mechanical complexities in microsystems and provide cost-efficient products. Deionized water is one of the dielectric and ionic liquids and being used in electrowetting on dielectric (EWOD) and liquid dielectrophoresis (LDEP) mechanisms in various microfluidic devices (Wang and Jones, 2005; Chen et al., 2011). Extensive studies have been reported the EWOD and LDEP mechanisms of water droplets for micro transportation and micromixing in the last few years. The contribution of electrowetting and dielectrophoresis (DEP) forces for actuating a liquid droplet was discussed by Chatterjee et al. using a lumped parameter model of liquid under an electrical field (Chatterjee et al., 2009). Wang et al. investigated the EWOD and DEP phenomena to determine the rise in the height of a liquid under a nonuniform electrical field (Wang and Jones, 2005). Chun-Hong Chen et al. analyzed the effect of voltage, frequency, and gap on the minimum actuation voltage required for EWOD and LDEP phenomena (Chen et al., 2009, 2011). Lu et al. discussed the combined numerical and experimental approach to study the EW response of DI water and the effect of actuating frequency, contact radius and contact angle on the droplet movement (Lu et al., 2017). Li et al. proposed a control mechanism to manipulate the gap height between electrodes by using piezoelectric cantilever structure. By controlling the bending of the piezoelectric structure, the gap between the two electrodes is changed to improve the EWOD effect of DI water (Li et al., 2016). Torabinia et al. proposed electromechanical model to study the performance of DI water for EWOD (Torabinia et al., 2018). A numerical approach is used by Raman et al. for studying the jumping and transport of DI water in EWOD (Ashoke Raman et al., 2016). Choi et al. (2015) studied the dynamic characteristics of the DI water under the external electrical field. The response of a dielectric liquid in the EWOD phenomenon depends on several parameters such as the applied voltage, applied frequency, thickness of the dielectric material, relative permittivity of the dielectric fluid, relative permittivity of the substrate material, gap between the electrodes, and volume of the fluid. As such, it is crucial to study the effect of different parameters on the response of the system for optimizing the performance of the system. These parameters have been studied previously by many researchers majorly focusing on optimization of the EWOD or LDEP effects for micromixing or micro transportation applications. Few studies were noted on the dynamic behavior of the actuating liquid due to these effects for actuating the microsystems. In addition, controllability of the oscillating liquid surface in such active microsystems is rarely accounted by any researcher. It is worth to analyse the combined effect of system parameters on the dynamic behavior of the oscillating liquids in microsystems. Deionized water is commonly available dielectric and ionic liquid and is widely used in many other microfluidic applications. These are the key reasons develops the motive behind conducting this study.
Many methods are available to determine the combined effect of different parameters on the response of the system and for sensitivity analysis. Analysis of variance (ANOVA) is the most commonly used statistical method for estimating the parameter effect. Response surface methodology (RSM) is another statistical method used for modeling the empirical relation between the control factors and output response. RSM is also widely used for the optimization of control parameters (Montgomery, 2012). Hessainia et al. used the RSM method to model the relation between the surface roughness and machining parameters in a hard turning process (Hessainia et al., 2013). Liu et al. analyzed the effect of different parameters on the manufacturing accuracy of bent parts using the ANOVA technique (Liu et al., 2017). The effectiveness of the system parameters on the radiation heat transfer was studied by Shirvan et al. using RSM (Milani Shirvan et al., 2016).
The main technical objectives of this work are summarized as follows: i) experimental investigation of the effect of different parameters on the response of the system to identify the crucial factors, ii) demonstration of the practical feasibility of a water droplet as a smart controllable dielectric fluid for a micro-actuating system. The response of the water droplet is initially evaluated using step input voltage. The dynamic characteristics of the step response are calculated subsequently to establish a system identified transfer function model. To evaluate the effect of different parameters on the response, the study of the design of experiments (DOE) is performed. The ANOVA technique associated with DOE is used for the assessment of these parameters. This reveals the relative contribution of the parameters to the motion of the water droplet. In addition, RSM is used to determine the empirical relation between the response and control factors using multiple regression analysis.
Electrically Driven Water Droplet Actuation
Principle of Working
Water possesses both conductive and dielectric properties. Water molecules are not symmetrical in shape simply because there are more electrons on the oxygen side than on the hydrogen side and because of the high electronegativity of the oxygen atom. The individual dipoles of the bonds between the oxygen atom and hydrogen atoms create a specific angle (approximately 104°) as shown in Figure 1A. Consequently, water molecules have a permanent dipole with polarity. Hence, there is a net dipole moment acting on the water molecule, causing a slight bend in it.
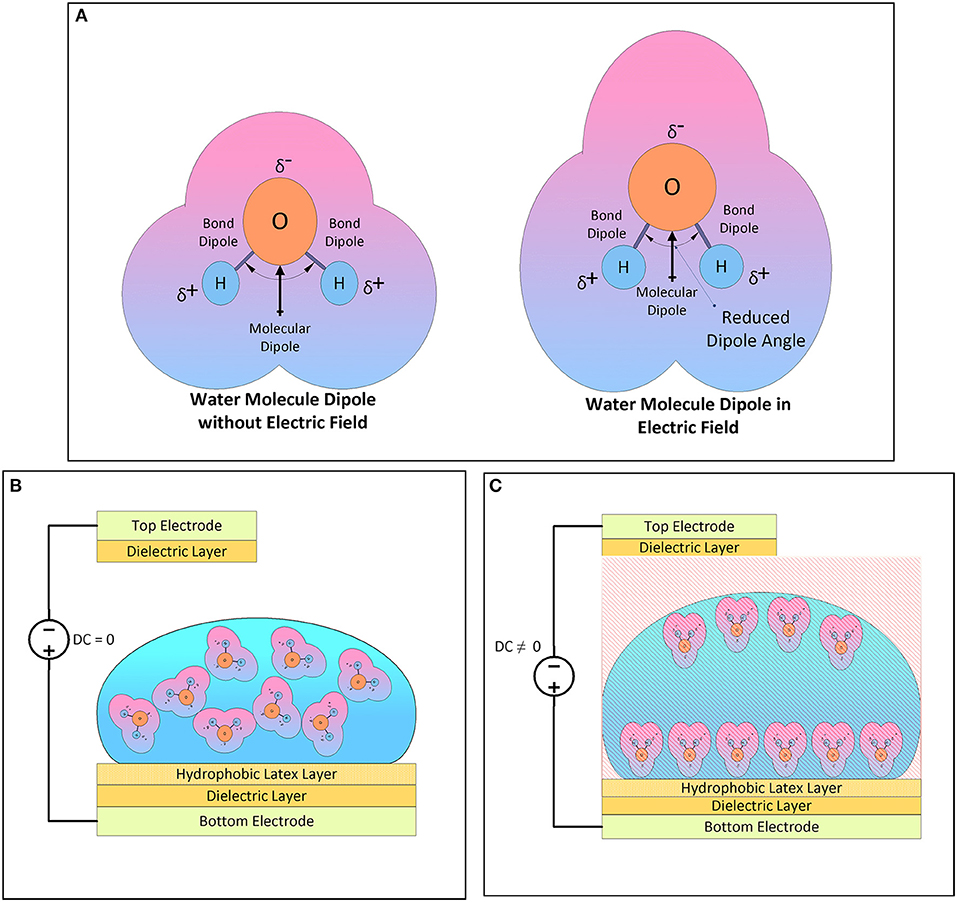
Figure 1. (A) Schematic of water molecule dipole (B) Schematic of water molecules randomly oriented in the droplet. (C) Schematic of water molecules aligned with the electrical field in the droplet.
Under the influence of an electrical field, positively charged hydrogen atoms are attracted toward the external negative charge and the negatively charged oxygen atom is attracted toward the external positive charge. Consequently, the dipole angle between the atomic bonds is reduced, producing more bend in the water molecule. This causes a change in the shape of the water molecule. In the absence of an electrical field, water molecules are randomly oriented in the droplet as shown in Figure 1B. When a water droplet is placed in a dielectric medium under an electric field, water molecules tend to align with the electrical field as shown in Figure 1C. When the applied frequency of the electrical field is low and below a certain threshold frequency, the electrical charge is distributed across the boundary of the water droplet and substrate material. Consequently, water behaves as a conductive medium and EWOD phenomena lead to a change in the contact angle of the droplet relative to the substrate. This change in the contact angle produces significant movement of the water droplet. However, if the applied frequency is high and greater than the threshold frequency, charge is distributed along the water volume and water behaves as a dielectric material. This causes a movement of the water droplet owing to the electrical actuating force called as a ponderomotive force in LDEP (Chen et al., 2011).
In this study, the working of the proposed water actuator system is similar to the EWOD/LDEP phenomena. The liquid droplet is placed between the two parallel electrodes covered with a dielectric material. The movement of water is considered as the hydrodynamic effect owing to the electrical force in the dielectric medium.
Experimental Setup
Figure 2 shows the configuration of the electrically actuated two parallel plate water droplet actuator system. Two copper electrodes of thickness 0.2 mm were placed parallel to each other. A rectangular-shaped bottom copper electrode of size 50 × 60 mm2 was attached to the base traverse support. A dielectric substrate made of Teflon (polytetrafluoroethylene) with the thickness of 0.05 mm and size of 70 × 70 mm2 was attached to the base electrode. A protective layer of latex material of the same size with the thickness of 0.03 mm was attached to the dielectric substrate. This arrangement facilitates uniform spreading of the water droplet over the dielectric substrate and results in a considerably flat surface of the droplet. To facilitate controlled volume and to avoid the dispersion of the water droplet outside the region of interest, closed rectangular boundaries of Teflon layers were created with the thickness of 1 mm and size of 12 × 24 mm2. This arrangement provides accurate wettable water layers as shown in Figure 2A.
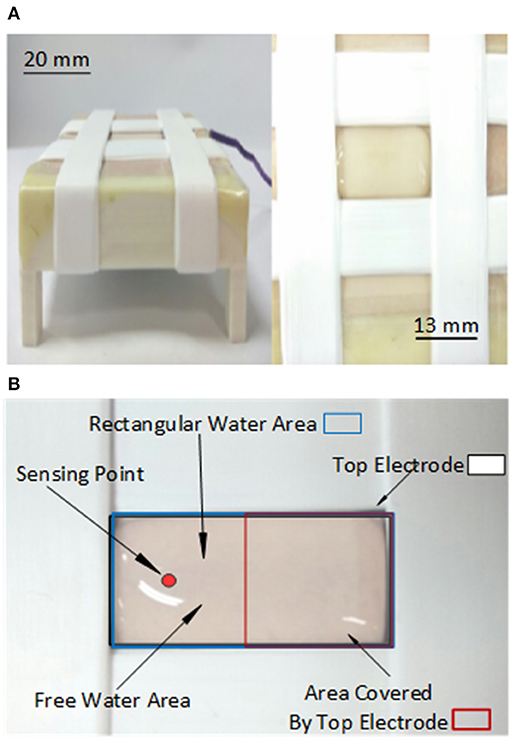
Figure 2. Electrically actuated water droplet actuator system (A) Images of actual System. (B) Detailed top view of a water droplet.
A fixed volume of the water droplet was measured using a micropipette (AH-100, OHASUS) and deployed over the dielectric substrate. The top copper electrode of the same thickness but with the size of 12 × 24 mm2 was positioned above the water droplet by using another traverse. Teflon material was wrapped around the top copper plate to avoid the electrolysis and direct contact in case of bursting of the water droplet. The top electrode was positioned over the water droplet such that half of the water droplet volume was exposed to the top electrode.
The remaining water droplet volume was made available for the measurement of the droplet oscillations. A laser sensor was positioned above the free water surface at its geometrical center point. The gap between the two electrode surfaces was larger than the static equilibrium height of the water droplet so that it can oscillate freely without touching the top electrode.
A DC step voltage was generated using a power supply (E3643A, Agilent) and amplified using a voltage amplifier (10/10A TREK). The bottom electrode was attached to the positive terminal and the top electrode was grounded. The response (displacement) of the water droplet was measured using a laser sensor (LK-G30, KEYENCE) and recorded using a data acquisition system (R1104, dSpace). Figure 3 shows the schematic of the experimental setup.
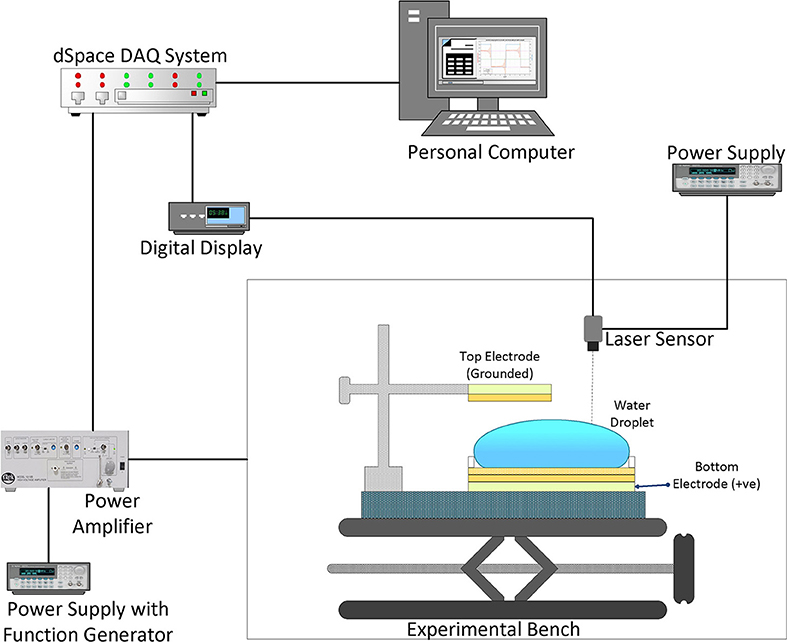
Figure 3. Schematic of the detailed experimental setup.
Design of Experiments Using Response Surface Methodology
RSM is a procedure used to assess the individual parameter effect. It is also used to determine the relationship between independent input system parameters and output responses. Five system input parameters (continuous control factors)–i.e., (A) relative permittivity of the dielectric substrate εs, (B) thickness of the dielectric material ds, (C) gap between the two electrodes H, (D) relative permittivity of the dielectric fluid εw, and (E) applied excitation voltage V—were considered in this analysis. Three types of dielectric materials were used as a substrate in the experiments: Polytetrafluoroethylene (εs = 2.1), Polymethylmethacrylate (εs = 2.6), and Polyethylene terephthalate polyester (εs = 3.2). Three water samples—pure deionized water, water solutions with 3 and 6% of salt (NaCl) concentration by weight - were used as different dielectric liquids. The relative permittivity of deionized water was measured using an HP-4284A LCR meter (εw = 80). The relative permittivity of 3% salt solution (normality, N = 0.51) and 6% salt solution (normality, N = 1.02) were calculated via interpolation based on the data provided in references (Hasted et al., 1948; Gavish and Promislow, 2016; Persson, 2017). It is assumed that static dielectric constant decreases linearly as the normality of the water–salt solution increases from 0 to 2 N. Hence, the relative permittivity estimated for the 0.51 N solution is 75 and for the 1.02 N solution is 70. The different levels specified for each control factor are summarized in Table 1.
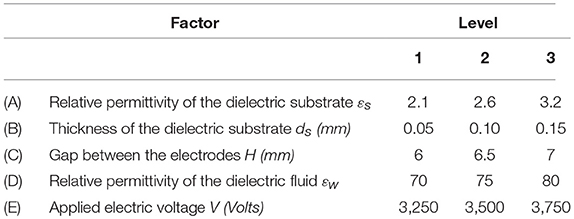
Table 1. Control factors considered for DOE and their specified levels.
The steady-state response and damping ratio were considered as the output responses. Based on various control factors and their individual levels, orthogonal-array-based Box–Behnken design criteria were chosen. Forty-six experimental trail configurations were selected and analyzed subsequently. The statistical analysis using ANOVA was performed to estimate the parameter effect.
The relationship between the steady-state response and input parameters is considered as
where R is the desired steady-state response and f is the surface response function. A similar relation is assumed for the correlation between the damping ratio ζ and input parameters as follows:
The quadratic polynomial regression model was used to correlate the output response with the input parameters. The quadratic model for R can be written as
where a0 is a constant, ai, aii, and aij represent the coefficients of linear, quadratic, and cross product terms, respectively. Xi is a coded form of an individual control parameter. A similar expression can be used for determining the damping ratio ζ.
Results and Discussions
Response of Water Droplet to Step Input Voltage
To study the dynamic behavior of the water droplet, experiments were carried out with a step input voltage signal of 3 kV and period of 12 s. The voltage was applied to 500 μL of water placed on the bottom electrode. The oscillations on the water surface were observed such that water surface under the influence of the top electrode moves in an upward direction and the remaining surface, which is freely exposed to air, moves in the downward direction. This downward motion of the water surface was recorded using the laser sensor. Figure 4 shows the difference between the water level without and with the input signal.
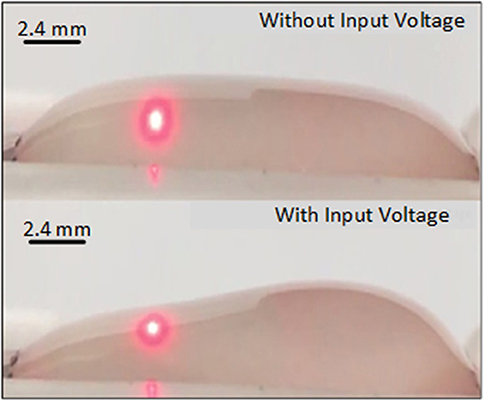
Figure 4. Images of the actual water droplet movement.
The droplet oscillations were recorded over 30 s and analyzed in the time domain. The plot of displacement of the water droplet surface against the applied input voltage is shown in Figure 5. The continuous red line indicates the displacement of the water droplet and the dotted magenta line indicates the applied voltage. It was observed that the water droplet showed damped oscillations. The oscillations were similar to second-order damped vibrations. From the results, the mean (M), root mean square, and upper standard deviation (Mean + SD) values were estimated as −0.027 mm, 0.0399, and −0.0564, respectively. Notably, the upper standard deviation was the best approximation for the steady-state response value of the water droplet motion. The dynamic characteristics of the response were estimated by determining the rise time, peak time, and pick value as 0.088 s, 0.154 s, and 0.1016 mm, respectively. The rise time is actually a falling time of the response. The damping ratio ζ and natural frequency ωn were calculated (Ogata, 2012) to be 0.0332 and 20.4112 rad/s, respectively.
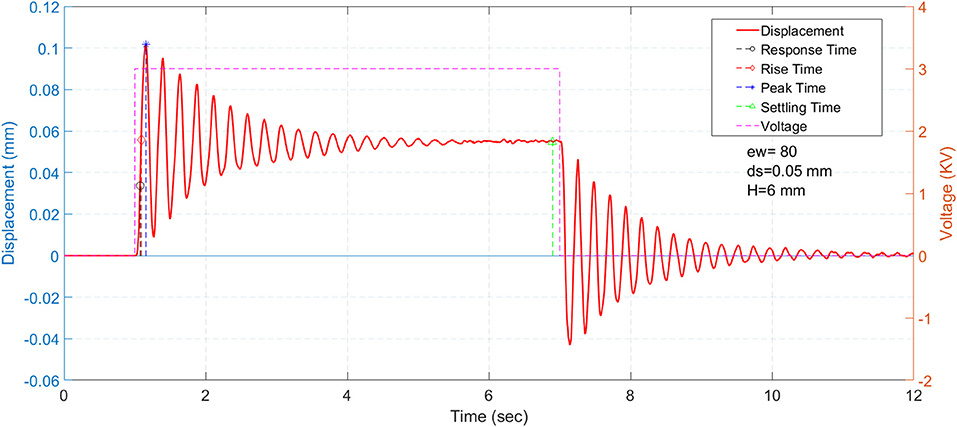
Figure 5. Response of the water droplet to a step voltage of 3 kV.
Based on these parameters, the nonstandard form of transfer function was obtained as
The steady-state response value and the overshoot value of such a system are manipulative. These values can be controlled for a stable system by changing the system parameters. The overshoot in the response of the water droplet can be reduced by controlling the damping ratio. Hence, further analysis using design of experiments was conducted to understand the effects of different system parameters on the response of the water.
Parameter Effect Analysis Using ANOVA
Two response variables were considered for the ANOVA separately: the steady-state response (Mean + SD) and the damping ratio ζ. Both response variables were calculated for each trial. The details of these experimental trials with results are presented in Table 2.
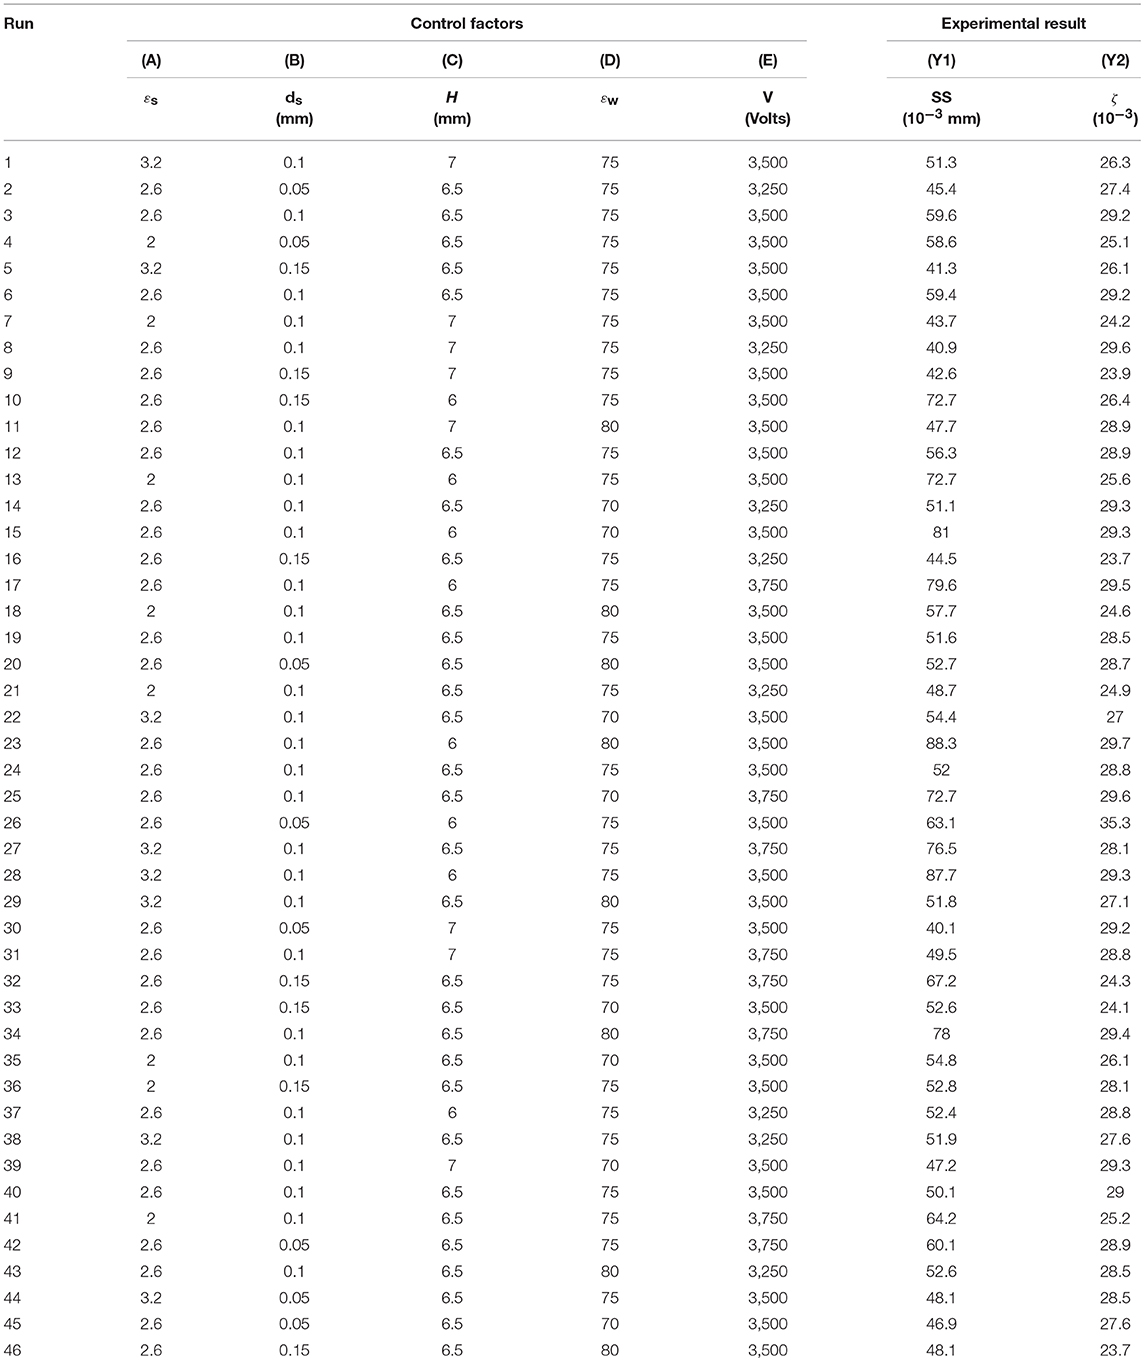
Table 2. Details of DOE using RSM with experimental results.
ANOVA for a Steady-State Response (R)
ANOVA for the steady-state value as the response variable with 95% confidence is presented in Table 3. Larger F- values indicate that the effect of a given control factor is high and this factor is more influential. A statistical significance of the control factor is determined by the P-value with the significance level of α = 0.05. If the P < 0.05, the factor is considered the most significant. The last column shows the percentage contribution of each factor to the response value. The greater the percentage contribution, the greater is the influence of a factor on a response variable (Hessainia et al., 2013).

Table 3. Results of the ANOVA for the steady-state value as the response variable.
According to the results presented in Table 3, the gap between the electrodes (H) was the most significant factor with a contribution of 49.22% to the response. The applied voltage (V) was the second most significant factor with a contribution of 23.00%. The other significant contributions were noted with square terms-for the (ds × ds) term as 3.72%, for the (H × H) term as 2.94%, for the (εw×εw) term as 1.08%, and for the interaction (H × V) term as 1.23%. The remaining terms accounted for <1% of the contribution. The remaining terms could be neglected in the model and ANOVA could be performed again in order to obtain a better fit of the model. However, during this process, one should consider the hierarchy of the quadratic model used for fitting.
Response Surface Plot for Steady-State Value (R)
Response surfaces plots for the steady-state value based on RSM are shown in Figures 6A–F for graphical interpretation. Figures 6A–D show the effect of the interaction of the applied voltage (V) with other parameters. Figure 6A shows the estimated response for the corresponding voltage (V) and gap between the electrodes (H). The gap between the electrodes had the most significant effect on the response and its variation was very high compared with that of other parameters. This figure also indicates the decrease in the response with an increase in the gap between the electrodes, at a constant applied voltage. Figure 6B shows the variation in the response for the applied voltage (V) and dielectric constant of the liquid (εw) together. As the dielectric constant of the liquid decreases, the response also decreases. However, effect of the voltage dominated the effect of dielectric constant of the liquid. Figures 6C,D show the estimated response corresponding to the thickness of the substrate material (ds) and its dielectric constant (εs) with respect to the applied voltage (V), respectively. The interaction plot of the thickness of the substrate material (ds) and dielectric constant of the liquid (εw) is shown in Figure 6E. This figure shows the significant nonlinear effect of the parameters on the response. Figure 6F shows the estimated response for the corresponding gap between the electrodes (H) and dielectric constant of the liquid (εw). The gap between the electrodes had a greater effect on the response than the dielectric constant of the liquid.
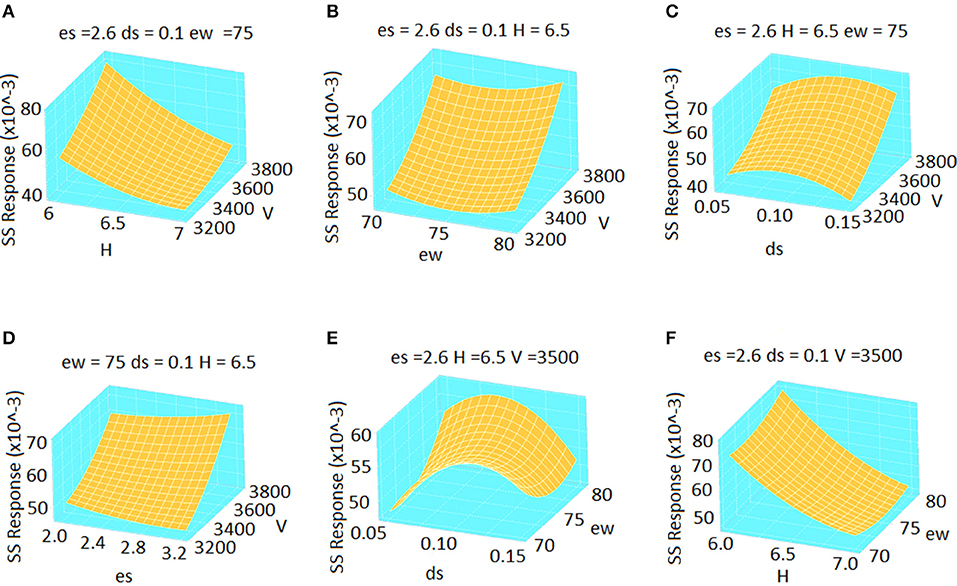
Figure 6. Response surface plots of the steady-state value (Mean + SD) × 10–3 mm value according to the change in various control factors (A–F).
Regression Analysis for Steady-State Response R
The correlation between the input parameters and output response had been modeled using quadratic regression analysis. The equation for the steady-state value was obtained as follows:
This empirical equation shows good consistency, >95% of the fit values, and with the experimental values with an average error of 6.86%. Hence, this equation can be used to approximate the (Mean + SD) response value as a good approximation of the steady-state value. Figure 7 shows the comparison between the experimental and predicted values of the steady-state response.
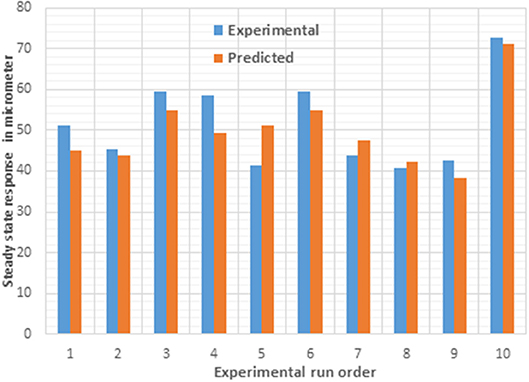
Figure 7. Comparison of experimental and predicted values of steady-state response (Mean + SD).
ANOVA for Damping Ratio ζ Value as a Response
ANOVA for ζ as a response variable with 95% confidence is presented in Table 4. Based on the results, the thickness of the dielectric substrate (ds) was the most significant parameter affecting the response with a contribution of 24.83%. The square of the dielectric constant of the substrate material (εs×εs) was the second most dominant parameter, contributing 13.94% to the response. Its linear term (εs) contributed 7.05% to the response. The gap between the electrodes(H) affected the response with a contribution of 5.04%. The other significant contributions were noted for the (ds×ds) term as 8.2%, for the (H×H)term as 1.95%, and for the interaction (ds×H) term as 1.23%. The remaining terms had a contribution of <1% to the response and were not statistically significant.
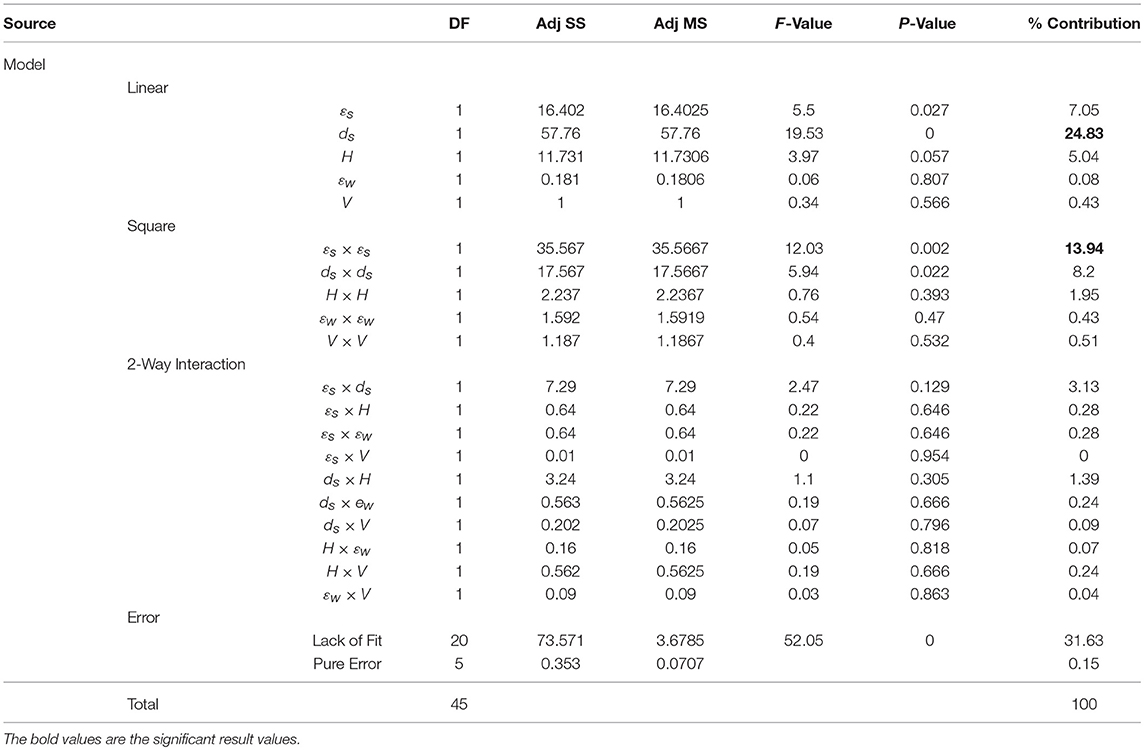
Table 4. Results of the ANOVA for Zeta as the response variable.
Response Surface Plot for Damping Ratio ζ
Response surfaces plots for ζ value as a response are plotted in Figures 8A–F. Figures 8A–C show the effect of the interaction of the applied voltage (V) with other parameters. Figure 8A shows the estimated response for the corresponding voltage (V) and substrate material thickness (ds). The substrate material thickness had the most significant effect on the response and its variation was very high as compared with that of the other parameters. This figure also indicates the decrease in the response as the substrate material thickness increases. Figure 8B shows the variation in the response for the applied voltage (V) and dielectric constant of the substrate material (εs) As the dielectric constant of the substrate material increases, the response also increases. A decrease in the response was observed with a further increase in the dielectric constant of the substrate material. However, the effect of the voltage did not dominate the effect of dielectric constant of the substrate material. Figure 8C shows the estimated response corresponding to the gap between the electrodes (H) and applied voltage (V). The response decreases as the gap between the electrodes increases under constant voltage. The interaction plot of the thickness of the substrate material (ds) and gap between electrodes (H) is shown in Figure 8D. Figure 8E shows the estimated response for the corresponding gap between the electrodes (H) and dielectric constant of the substrate material (εs). This plot indicates major nonlinear behavior. The effect of the dielectric constant of the substrate material (εs)and thickness of the substrate material (ds) is shown Figure 8F. A significant nonlinearity was observed at the endpoints whereas slight flatness was observed at the middle.
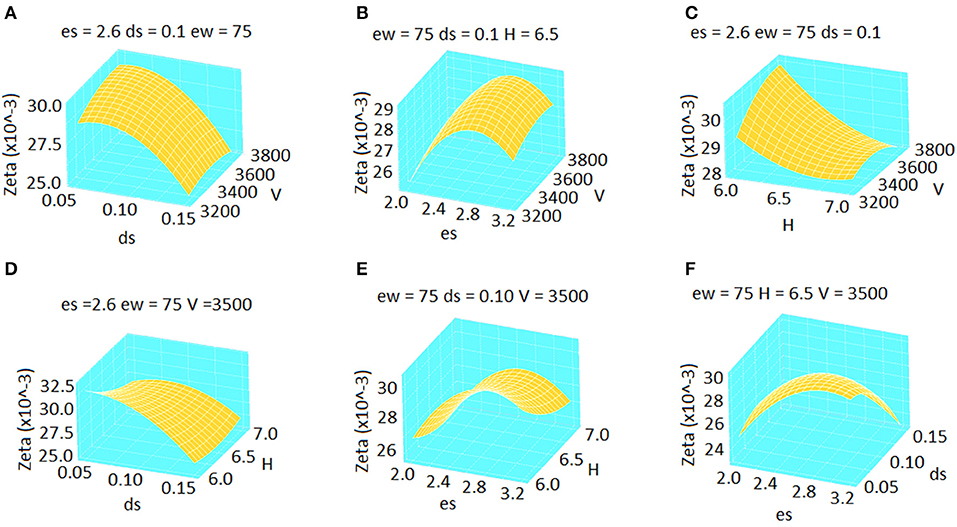
Figure 8. Response surface plots of damping ratio value according to the change in various control factors (A-F).
Regression Analysis for Damping Ratio ζ
The correlation between the input parameters and output response ζ is given by
This empirical equation shows good consistency, >95% of the fit values and with the experimental values with an average error of 3.39%. Hence, this equation can be used to approximate the ζ value as a response value. Error! Reference source not found. Figure 9 shows the comparison between the experimental and predicted values of ζ.
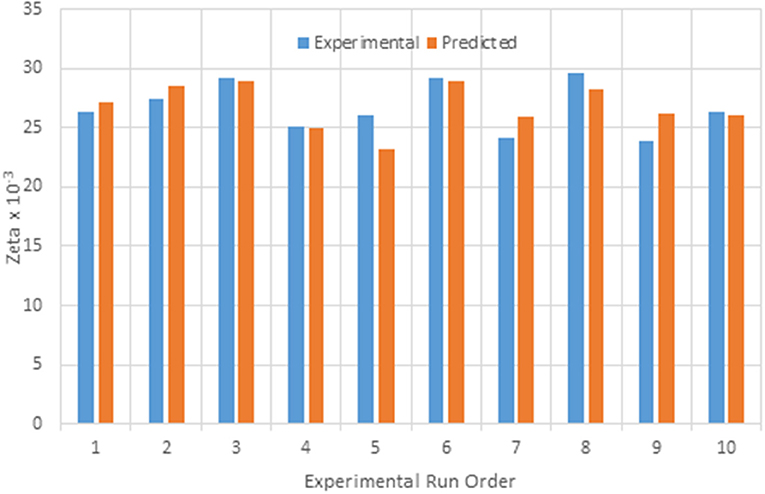
Figure 9. Comparison of experimental and predicted values of Zeta.
Conclusion
In this work, dynamic characteristics of a water droplet actuator were evaluated to analyze the system behavior. Accordingly, the oscillations of a water droplet of volume 500 μL between two parallel plate electrodes were observed and analyzed in the time domain. The observed response of the water droplet was similar to seconds-order damped vibrations. It was observed that, at high electrical voltage, the water droplet burst after specific movement. Subsequently, the steady-state response of the droplet was reduced. The evaporation of the water droplet was observed subsequently. ANOVA demonstrates that the gap between the electrodes had the highest influence on the steady-state response of the system. The applied electrical voltage had the second highest influence on the response. In the case of the damping ratio, the dielectric substrate had the highest influencing factor. The square of the dielectric constant of the substrate material was the second most dominant parameter to the response zeta.
In addition, the response surface plot for the steady-state value and zeta value show the consistent results as ANOVA. These plots are well demonstrating the interactive effects of the parameters on the response. Both the quadratic models of steady-state response and damping ratio are valid according to ANOVA and possess high significance. A good consistency was observed between the experimental and predicted results. Therefore, the approach presented in this paper is useful for assessing the parameter effects in water droplet actuation for microsystems. This approach is useful for optimizing the system parameters for various objectives.
Although this study is limited to a very basic investigation, some issues have been observed and can be addressed in a future work. The evaporation and hysteresis of water or other dielectric liquids must be considered for a more rigorous analysis. It is also remarked that enhancing the water droplet movement at low voltages is another issue to be studied. The study of mixing some additives or surfactants in DI water and then to check its controllability is interesting part. Or else the use of piezoelectric substrate plates below the dielectric coatings certainly accelerate the water droplet motion at very low AC voltages and can be studies separately.
It is concluded that dielectric liquids such as water can be used for actuating microsystems. Such liquids can be treated as smart materials for the actuation of microdevices and they have potential to be a cheaper alternative to the existing class of smart materials.
Author Contributions
B-KS and S-BC evaluated experimental data using the statistical analysis of variance and the regression approach. They also wrote the main body of the manuscript. TM set up experimental apparatus, conducted experiments and collected all measured data. He also prepared all tables and figures of this manuscript.
Funding
This research was supported by the Incheon National University (INU) research grant in 2018.
Conflict of Interest Statement
The authors declare that the research was conducted in the absence of any commercial or financial relationships that could be construed as a potential conflict of interest.
References
Ashoke Raman, K., Jaiman, R. K., Lee, T. S., and Low, H. T. (2016). A numerical study on electrowetting-induced jumping and transport of droplet. Int. J. Heat Mass Transf. 99, 805–821. doi: 10.1016/j.ijheatmasstransfer.2016.04.038
Bell, D. J., Lu, T. J., Fleck, N. A., and Spearing, S. M. (2005). MEMS actuators and sensors: Observations on their performance and selection for purpose. J. Micromech. Microeng. 15, S153–S164. doi: 10.1088/0960-1317/15/7/022
Bogue, R. (2012). Smart materials: a review of recent developments. Assem. Autom. 32, 153–164 3–7. doi: 10.1108/01445151211198674
Chatterjee, D., Shepherd, H., and Garrell, R. L. (2009). Electromechanical model for actuating liquids in a two-plate droplet microfluidic device. Lab Chip 9, 1219–1229. doi: 10.1039/b901375j
Chen, C. H., Tsai, S. L., Chen, M. K., and Jang, L. S. (2011). Effects of gap height, applied frequency, and fluid conductivity on minimum actuation voltage of electrowetting-on-dielectric and liquid dielectrophoresis. Sens. Actuators B Chem. 159, 321–327. doi: 10.1016/j.snb.2011.06.063
Chen, C. H., Tsai, S. L., and Jang, L. S. (2009). Droplet creation using liquid dielectrophoresis. Sens. Actuators B Chem. 142, 369–376. doi: 10.1016/j.snb.2009.08.001
Choi, S. B., Kim, H. C., Han, C., and Kim, P. (2015). A novel actuator system featuring electric-responsive water layers: preliminary experimental results. Sens. Actuators. A. Phys. 235, 281–291. doi: 10.1016/j.sna.2015.10.016
Gavish, N., and Promislow, K. (2016). Dependence of the dielectric constant of electrolyte solutions on ionic concentration: a microfield approach. Phys. Rev. E 94, 1–14. doi: 10.1103/PhysRevE.94.012611
Hasted, J. B., Ritson, D. M., and Collie, C. H. (1948). Dielectric properties of aqueous ionic solutions. Parts I and II. J. Chem. Phys. 16, 1–21. doi: 10.1063/1.1746645
Hessainia, Z., Belbah, A., Yallese, M. A., Mabrouki, T., and Rigal, J. F. (2013). On the prediction of surface roughness in the hard turning based on cutting parameters and tool vibrations. Meas. J. Int. Meas. Confed. 46, 1671–1681. doi: 10.1016/j.measurement.2012.12.016
Judy, J. W. (2001). Microelectromechanical systems (MEMS): fabrication, design and applications. Smart Mater. Struct. 10, 1115–1134. doi: 10.1088/0964-1726/10/6/301
Jung, H., and Gweon, D.-G. (2000). Creep characteristics of piezoelectric actuators. Rev. Sci. Instrum. 71, 1896–1900. doi: 10.1063/1.1150559
Li, Y., Baker, R. J., and Raad, D. (2016). Improving the performance of electrowetting on dielectric microfluidics using piezoelectric top plate control. Sens. Actuators B Chem. 229, 63–74. doi: 10.1016/j.snb.2016.01.108
Liu, X., Zhao, S., Qin, Y., Zhao, J., and Wan-Nawang, W. A. (2017). A parametric study on the bending accuracy in micro W-bending using Taguchi method. Meas. J. Int. Meas. Confed. 100, 233–242. doi: 10.1016/j.measurement.2016.12.007
Lu, Y., Sur, A., Pascente, C., Ravi Annapragada, S., Ruchhoeft, P., and Liu, D. (2017). Dynamics of droplet motion induced by Electrowetting. Int. J. Heat Mass Transf. 106, 920–931. doi: 10.1016/j.ijheatmasstransfer.2016.10.040
Milani Shirvan, K., Mamourian, M., Mirzakhanlari, S., Ellahi, R., Milani, K., Mamourian, M., et al. (2016). Two phase simulation and sensitivity analysis of effective parameters on combined heat transfer and pressure drop in a solar heat exchanger filled with nanofluid by RSM. J. Mol. Liq. 220, 888–901. doi: 10.1016/j.molliq.2016.05.031
Montgomery, D. C. (2012). Design and Analysis of Experiments, 8 Edn. New York, NY: John Wiley & Sons.
Ogata, K. (2012). Modern Control Engineering. Upper Saddle River, NJ: Prentice-hall, Inc. doi: 10.1109/TAC.1972.1100013
Persson, R. A. (2017). On the dielectric decrement of electrolyte solutions: a dressed-ion theory analysis. Phys. Chem. Chem. Phys. 19, 1982–1987. doi: 10.1039/C6CP07515K
Torabinia, M., Farzbod, A., and Moon, H. (2018). Electromechanical model to predict the movability of liquids in an electrowetting-on-dielectric microfluidic device. J. Appl. Phys. 123, 154902. doi: 10.1063/1.5014045
Wang, K. L., and Jones, T. B. (2005). Electrowetting dynamics of microfluidic actuation. Langmuir 21, 4211–4217. doi: 10.1021/la0468702
Keywords: water droplet actuator, smart actuator, step response, actuating displacement, analysis of variance, response surface methodology
Citation: Song B-K, Mulla T and Choi S-B (2018) Controllable Water Droplet for Microsystem Actuators: An Experimental Analysis. Front. Mater. 5:54. doi: 10.3389/fmats.2018.00054
Received: 09 April 2018; Accepted: 10 August 2018;
Published: 30 August 2018.
Edited by:
Ilkwon Oh, Korea Advanced Institute of Science & Technology (KAIST), South KoreaCopyright © 2018 Song, Mulla and Choi. This is an open-access article distributed under the terms of the Creative Commons Attribution License (CC BY). The use, distribution or reproduction in other forums is permitted, provided the original author(s) and the copyright owner(s) are credited and that the original publication in this journal is cited, in accordance with accepted academic practice. No use, distribution or reproduction is permitted which does not comply with these terms.
*Correspondence: Seung-Bok Choi, c2V1bmdib2tAaW5oYS5hYy5rcg==