 Taro Ueda
 Keijiro Ishida
- Graduate School of Engineering, Nagasaki University, Nagasaki, Japan
Porous (pr-) In2O3 powders loaded with and without noble metals (Au, Pd, or Pt) were prepared by ultrasonic spray pyrolysis employing the PMMA microspheres as a template (typical particle size (ps): 28 or 70 nm with a diameter), and their NO2 sensing properties were examined. The Au loading on the pr-In2O3 was effective to increase the NO2 response at lower operating temperature (≤200°C), while the metal loading of Pd or Pt were hardly effective. In addition, a decrease in the PMMA microspheres (from 70 to 28 nm in ps) largely increased the NO2 response, and an optimized amount of Au loaded on the pr-In2O3 sensor was 1.0 wt%. The decrease in the thickness of the sensing layer improved the NO2 response and response speed. It was suggested that the Au loading enhanced the amount of the negatively adsorbed NO2 on the bottom part of the sensing layer, leading to the increase in the NO2 response. Furthermore, the introduction of additional macropores (ps: 150 nm) to the 1.0 wt% Au loaded pr-In2O3 sensor increased the response to a low concentration of NO2 (0.025 ppm) at 30°C. Therefore, it was found that easy gas diffusion from the surface to the bottom part of the sensing layer increased the effective concentration of NO2, and thus the NO2 response was increased.
Introduction
Sensing performances of semiconductor-type gas sensors are largely improved by the morphological control of the sensing layer, probably due to the promotion of the gas reactivity on their oxide surfaces by an increase in the surface area per unit volume and the gas diffusivity in the sensing layer (Chen et al., 2014; Sun et al., 2014). Therefore, many researchers have reported the enhanced sensing performances by the structural modification of the sensing layer with rod-like (Wei et al., 2014; Takacs et al., 2015), plate-like (Chen et al., 2014; Guo, 2016), flower-like (Wang et al., 2014, 2015), or urchin-like structured oxide (Tang et al., 2013). Our group has also studied the introduction of ordered porous structures into metal-oxide layers of semiconductor-type gas sensors to enhance their gas diffusivity and surface area during the last 20 years (Hyodo et al., 2001, 2002, 2003, 2005, 2010, 2013, 2017; Hashimoto et al., 2008; Hieda et al., 2008; Firooz et al., 2010). For example, we synthesized mesoporous SnO2 powders by utilizing the self-assembly of surfactants with a size of several nanometers, and their sensors showed the quite large H2 response due to an increase in the specific surface area (Hyodo et al., 2001, 2002, 2003). We also reported macroporous SnO2 layers fabricated by a sol-gel technique employing polymethylmethacrylate (PMMA) microspheres (Soken Chem. & Eng. Co., Ltd., typical particle size (ps): 150, 400, 800, and 1,500 nm in diameter) as a template, and the one fabricated by using the smallest PMMA microspheres (ps: 150 nm) showed the largest H2 response among them (Hyodo et al., 2005). In addition, we also attempted the fabrication of the macroporous In2O3 powders by ultrasonic spray pyrolysis employing a precursor solution containing PMMA microspheres (ps: 150 nm), and their sensors showed much larger NO2 response and quicker NO2 response/recovery speeds than those of the conventional In2O3 sensor prepared by the similar preparation technique employing a PMMA-free In(NO3)3 aqueous solution (Hashimoto et al., 2008; Hyodo et al., 2010). Recently, we focused on the preparation of smaller-sized PMMA microspheres by an ultrasonic-assisted emulsion polymerization technique, and demonstrated an increase in the amount of sodium lauryl sulfate as a surfactant in the polymerization process of methyl methacrylate monomers decreased the size of the synthesized PMMA microspheres (Hyodo et al., 2013). In addition, the fabricated porous (pr-) In2O3 sensor employing smaller-sized PMMA microspheres (ps: 26 nm) as a template in a precursor solution of ultrasonic spray pyrolysis was effective in improving the magnitude of NO2 response to a low concentration of NO2 (e.g., 1 ppm) at relatively low temperature (150°C) (Hyodo et al., 2017).
Another important technique to realize a large sensor response of semiconductor-type gas sensors is loading of a noble metal such as Au, Pd, Pt, etc., to metal oxides. The effects are known as the chemical and/or electronic sensitization phenomena (Yamazoe et al., 2003). Kim et al. reported the Au decoration on hematite nanotubes improved the magnitude of acetone response as well as acetone selectivity against ethanol (Kim et al., 2018b). Degler et al. clarified that the Au loading on the surface of SnO2 accelerated negative adsorption of O2 on the surface by the spillover effects, leading to the enhancement of the CO sensing performances (Degler et al., 2016a). They also demonstrated that the Pt loading on SnO2 increased the CO response in humidified air, and nano-sized PtO2 clusters on SnO2 surface accelerated the CO oxidation reaction (Degler et al., 2016b). Ogel et al. synthesized Pd-loaded hollow-structured SnO2 powders by a water-in-oil (w/o) microemulsion-based method, and found that the Pd loading on the outside of the SnO2 shell was effective in achieving large CO response at lower operating temperatures (≤150°C) (Ogel et al., 2017). Kim et al. reported that the sensor of nitrogen-doped WO3-nanofiber functionalized with Pt nanoparticles by physical mixing showed the enhanced NO2 response (Kim et al., 2018a). We also confirmed that the loading of Sb (Hieda et al., 2008) increased H2 responses of pr-SnO2 powders synthesized by ultrasonic spray pyrolysis employing the PMMA microspheres as a template.
In this study, we synthesized pr-In2O3 powders loaded with and without a noble metal such as Au, Pd, or Pt by ultrasonic spray pyrolysis employing home-made PMMA microspheres (ps: 28, 70, 150 nm) as a template, and their NO2 sensing properties were examined. On the basis of the results obtained, the effects of the introduction of well-developed porous structure into the spherical In2O3 powders and the loading of the noble metal to the In2O3 surface on their NO2 sensing properties were discussed.
Experimental
Synthesis of PMMA Microspheres
PMMA microspheres were synthesized by ultrasonic-assisted emulsion polymerization. Methyl methacrylate monomer (MMA; Wako Pure Chem. Ind., Ltd., 150 cm3) was washed with 0.05 M NaOH aqueous solution (1 dm3) for three times, to remove a polymerization inhibitor from the MMA monomer. The pure MMA monomer obtained (8 g), sodium lauryl sulfate (SLS; Nacalai Tesque, Inc., 0.1 or 0.5 g) as a surfactant and ammonium persulfate (Wako Pure Chem. Ind., 0.3 g) as an initiator were added to deionized water (100 cm3), and then the resultant oil/water (o/w) emulsion was ultrasonically treated by an ultrasonic homogenizer (Nissei Corp., US-150T, 19.5 ± 1 kHz). The polymerization of MMA to PMMA was initiated in the micelles, just upon the irradiation of strong ultra-sonic wave to the o/w emulsion at RT, and the temperature of the o/w emulsion increased from RT to ca. 65°C within 15 min. After the ultrasonic irradiation for 30 min, the aqueous dispersion containing PMMA microspheres was obtained (Hyodo et al., 2017). The particle-size distribution of the synthesized PMMA microspheres in the aqueous dispersion was measured at 25°C by dynamic light scattering (DLS; Malvern Instrument Ltd., HPPS), and the average particle size of PMMA microspheres in the aqueous dispersion was confirmed as ca. 70 or 28 nm for the additive amount of SLS of 1.0 g or 5.0 g, respectively.
Preparation of pr-In2O3 Powders by Ultrasonic Spray Pyrolysis
The aqueous dispersion containing PMMA microspheres (37.5 cm3) was mixed with 0.05 mol dm−3 In(NO3)3 aqueous solution (62.5 cm3) and the mixture was served as an aqueous precursor solution. In some cases, an appropriate amount of HAuCl4, Pd(NO3)2, or PtCl4 aqueous solution (0.1 mol dm−3) was added to the precursor solution for the loading of Au, Pd, or Pt, respectively. Precursor mists were obtained by ultrasonication of the aqueous precursor solution in a plastic container equipped with a polyethylene thin film at one end, which was perpendicularly set over an ultrasonic vibrator (Honda Electric Co., Ltd., HM-303 N, 2.4 MHz) at a distance of 0.5–1.0 cm in water. A specially designed mist-supplier for the ultrasonic-spray pyrolysis was used to get uniform mists of the precursor solution (Hyodo et al., 2017). Only small droplets separated in a glass vessel were fed into an electric furnace heated at 1,000°C under flowing air (1,500 cm3 min−1). As the mists were momentarily heated at the electric furnace, the evaporation of water and the thermal decomposition of In(NO3)3 and PMMA microspheres simultaneously happened and spherical indium oxide powders are produced in the electric furnace under the air flow. The detail of the ultrasonic spray pyrolysis was already reported in our previous paper (Hyodo et al., 2017). The obtained porous powders loaded with and without noble metal were denoted as M(m)/pr-In2O3(n) and pr-In2O3(n) [M: the kind of noble metal, m: the loading amount of M (wt%), n: the diameter of PMMA microspheres (nm)], respectively. The microstructure of these powders was observed by scanning electron microscopy (SEM; JEOL Ltd., JSM-7500F) and transmission electron microscopy (TEM; JEOL Ltd., JEM2010). The pore-size distribution and specific surface area (SSA) of these powders were measured by Barrett–Joyner–Halenda (BJH) and Brunauer–Emmett–Teller (BET) methods using N2 adsorption-desorption isotherms (Micromeritics Instrument Corp., Tristar3000), respectively. Crystal phase of these powders was characterized by X-ray diffraction analysis (XRD; Rigaku Corp., RINT2200) using Cu Kα radiation (40 kV, 40 mA), and their crystallite size (CS) was calculated from the (222) diffraction peak using Scherrer equation. Chemical state of the surface of these powders was characterized by X-ray photoelectron spectroscopy using Al Kα radiation (XPS, Kratos Analytical Ltd., Axis Ultra DLD), and the binding energy was calibrated by using the C1s level (285.0 eV) from usual contamination.
Fabrication of Thick Film Sensors and Measurement of Their Gas Sensing Properties
The fabricated In2O3-based powder was mixed with an appropriate amount of α-terpineol (generally, powder: α-terpineol = 1: 2, in weight), and the obtained paste was screen-printed onto an alumina substrate equipped with a pair of interdigitated Pt electrodes (gap size: ca. 200 μm), followed by drying at 100°C. In some cases, this paste was laminated three times to increase the thickness of the sensing layer, while the paste containing the larger amount of α-terpineol (weight ratio: 1:5 or 1:10) was also prepared to decrease the thickness of the sensing layer. Then, they are calcined at 550°C for 5 h in ambient air. Gas responses of these sensors were measured to 0.025, 0.25, 1.0, and 5.0 ppm NO2 balanced with dry air at a flow rate of 100 cm3 min−1 at 25–500°C. The magnitude of response to NO2 was defined as the ratio (Rg/Ra) of resistance in NO2 balanced with air (Rg) to that in air (Ra). The obtained sensors were denoted as pr-In2O3(n)-t or M(m)/pr-In2O3(n)-t [t: thickness of the sensing layer (μm)].
Results and Discussion
Characterizations of pr-In2O3(n) and M(m)/pr-In2O3(n) Powders and Their NO2 Sensing Properties
Figure 1 shows SEM photographs of representative pr-In2O3(n) and M(m)/pr-In2O3(n) powders. All the In2O3-based particles were spherical with well-developed homogenous porous structures on the surface, due to the thermal decomposition of the PMMA microspheres. The pore size of the pr-In2O3(70) powder was larger than that of the pr-In2O3(28) powder, and the observed pore structure was unchanged by the loading of Au. Supplementary Figures 1, 2 show their XRD patterns and pore-size distributions, respectively. Table 1 summarizes crystallite sizes (CSs) calculated from their XRD spectra, most frequent values of diameter (mode diameters) of pores in pore-size distributions calculated from N2 adsorption and desorption isotherms, and specific surface areas (SSAs) of pr-In2O3(n) and Au(0.5)/pr-In2O3(n) powders. All the powders were assigned to cubic In2O3 and the CS of the pr-In2O3(70) powder was larger than that of the pr-In2O3(28) powder. In addition, the pore diameter of the pr-In2O3(70) powder was also larger than that of the pr-In2O3(28) powder. For details, the pore diameter calculated from N2 adsorption isotherm of the pr-In2O3(70) powder (ca. 80 nm) was much larger than that of the pr-In2O3(28) powder (ca. 30 nm), while the pore diameter calculated from N2 desorption isotherm of the pr-In2O3(70) powder (ca. 30 nm) was slightly larger than the that of the pr-In2O3(28) powder (ca. 22 nm). Generally, the difference between pore diameters calculated from N2 adsorption and desorption isotherms arises from the ink-bottle porous morphology of both the pr-In2O3(n) powders. Therefore, the pore diameter calculated from N2 desorption isotherm reflects the width of the necks formed between the spherical pores, and the one calculated from N2 adsorption isotherm reflects the diameter of spherical pores, which originates from the morphology of PMMA microspheres as a template. Actually, the size of pores on the surface of both the pr-In2O3(n) powders was quite similar to the pore diameter calculated from N2 adsorption isotherm. Furthermore, the loading of Au hardly affected the values of their SSA and CS as well as their pore-size distributions, and the XRD peaks derived from Au were not confirmed in XRD spectra of the Au(0.5)/pr-In2O3(n) powders. The porous morphology on the surface of both the Au(0.5)/pr-In2O3(n) powders was also comparable to that of both the pr-In2O3(n) powders. These results indicate that Au could be highly dispersed in the Au(0.5)/pr-In2O3(n) powders.
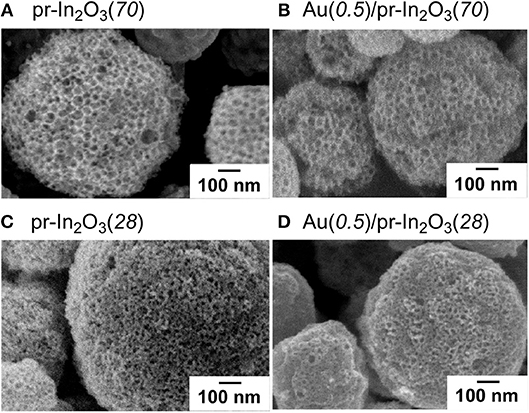
Figure 1. SEM photographs of (A,C) pr-In2O3(n) and (B,D) Au(0.5)/pr-In2O3(n) powders [n: 28 and 70 (nm)].
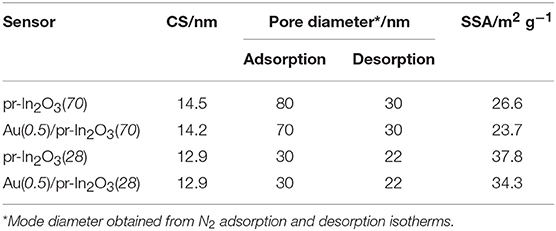
Table 1. Comparison of crystallite size (CS), pore diameter, and specific surface area (SSA) of the pr-In2O3(n), and Au(0.5)/pr-In2O3(n) powders.
Figure 2 shows variations in response of the pr-In2O3(70)-20 and the M(0.5)/pr-In2O3(70)-20 sensors (M: Au, Pd, Pt) to 1 and 5 ppm NO2 in dry air with operating temperature. Supplementary Figure 3 shows their typical response transients. The magnitude of response of these sensors increased with a decrease in the operating temperatures, regardless of NO2 concentration. The loading of Pd to pr-In2O3(70) was hardly effective in improving the NO2 response and the loading of Pt to pr-In2O3(70) had negative effect on the NO2 response in the whole operating temperature range examined. On the other hand, the loading of Au increased the NO2 response especially at lower temperatures (≤200°C), even though the NO2 response of the Au(0.5)/pr-In2O3(70)-20 sensor was much smaller than that of the pr-In2O3(70)-20 sensor at higher temperatures of more than 300°C. In addition, the Au(0.5)/pr-In2O3(70)-20 sensor showed faster recovery speed at lower temperatures (≤300°C) than that of the pr-In2O3(70)-20 sensor. The loading of Au to pr-In2O3(70) is found to be effective to improve response properties at lower operating temperatures. Therefore, sensing properties of Au(0.5)/pr-In2O3(n)-20 sensors to further low concentration of NO2 were evaluated at the lower operating temperatures. Figure 3 shows variations in response of the pr-In2O3(n)-20 and the Au(0.5)/pr-In2O3(n)-20 sensors (n: 28, 70) to 0.25 ppm NO2 with operating temperature in dry air. Figure 4 shows response transients of the pr-In2O3(n)-20 and the Au(0.5)/pr-In2O3(n)-20 sensors (n: 28, 70) to 0.25 ppm NO2 in dry air at 30 and 200°C. Both the pr-In2O3(n)-20 sensors showed quite a small response to 0.25 ppm NO2 at 350°C, but their NO2 response increased with a decrease in the operating temperature at 200–350°C. However, the NO2 response of the pr-In2O3(n)-20 sensors decreased with a decrease in operating temperature at <200°C. In addition, the NO2 response of the pr-In2O3(28)-20 sensor was comparable to that of the pr-In2O3(70)-20 sensor in the entire examined temperature range. On the other hand, the NO2 responses of the Au(0.5)/pr-In2O3(n)-20 sensors increased with a decrease in operating temperatures, and especially they were much larger than those of the pr-In2O3(n)-20 sensors at <150°C. These results indicate that the loading of 0.5 wt% Au was effective in improving the NO2 response, only at lower temperatures. In addition, the NO2 response of the Au(0.5)/pr-In2O3(28)-20 sensor was much larger than that of the Au(0.5)/pr-In2O3(70)-20 sensor at the lower temperatures, and the Au(0.5)/pr-In2O3(28) sensor showed the largest NO2 response (ca, 1 × 10⁵) at 30°C among the sensors. On the other hand, the response speed of these sensors at 30°C was much slower than that at 200°C, and their resistance did not recover to their original values.
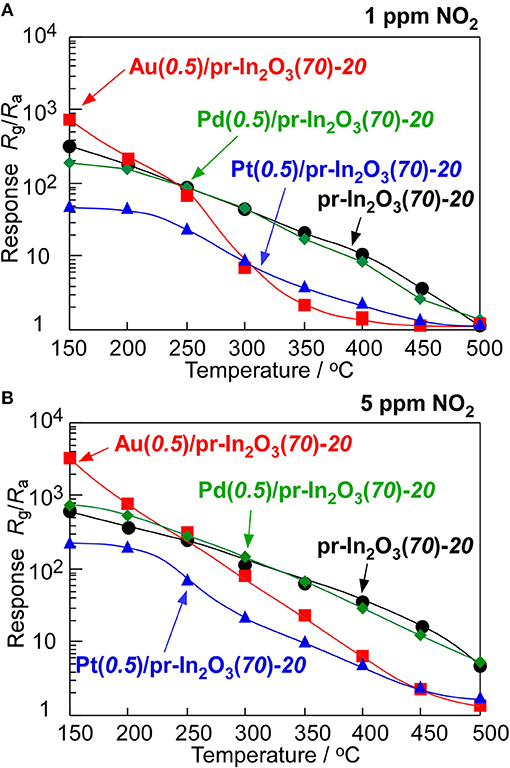
Figure 2. Variations in response of the pr-In2O3(70)-20 and M(0.5)/pr-In2O3(70)-20 sensors to (A) 1 and (B) 5 ppm NO2 in dry air with operating temperature.
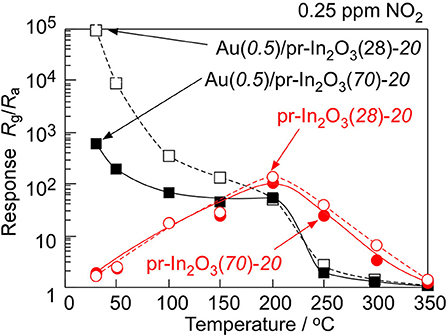
Figure 3. Variations in response of the pr-In2O3(n)-20 and Au(0.5)/pr-In2O3(n)-20 sensors to 0.25 ppm NO2 in dry air with operating temperature.
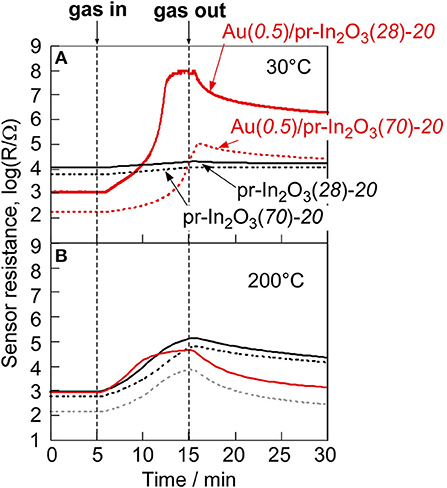
Figure 4. Response transients of the pr-In2O3(n)-20 and Au(0.5)/pr-In2O3(n)-20 sensors to 0.25 ppm NO2 at (A) 50 and (B) 200°C in dry air.
Figure 5 shows variations in response of the Au(m)/pr-In2O3(28)-20 sensors (m: 1.0, 1.5, 2.0, 5.0) to 0.25 ppm NO2 in dry air with operating temperature in order to examine the effects of the loading amount of Au. Figure 6 shows response transients of the Au(m)/pr-In2O3(28)-20 sensors (m: 1.0, 1.5, 2.0, 5.0) to 0.25 ppm NO2 in dry air at 50°C. These Au(m)/pr-In2O3(28)-20 sensors also showed extremely large NO2 responses at 30°C, as is the case with the Au(0.5)/pr-In2O3(28)-20 sensor, but the resistance values of these sensors in 0.25 ppm NO2 were as large as 109 Ω, which is beyond the limitation of our measurement setup. Thus, we did not obtain correct response values at 30°C. The NO2 response of all the Au(m)/pr-In2O3(28)-20 sensors increased with a decrease in the operating temperature, and the Au(1.0)/pr-In2O3(28)-20 sensor showed the largest NO2 response among them. All the Au(m)/pr-In2O3(28)-20 sensors showed quite slow response behavior. The resistance of the Au(1.0)/pr-In2O3(28)-20 sensor most swiftly increased upon exposure to NO2 and it reached a constant value, just like that of the Au(0.5)/pr-In2O3(28)-20 sensor. However, the resistance of other Au(m)/pr-In2O3(28)-20 sensors (m: 1.5, 2.0, 5.0) did not reach a constant value during the exposure period of NO2 (10 min), which indicates that too large loading of Au (m: 1.5, 2.0, 5.0) slowed down the response speed to 0.25 ppm NO2 in air.
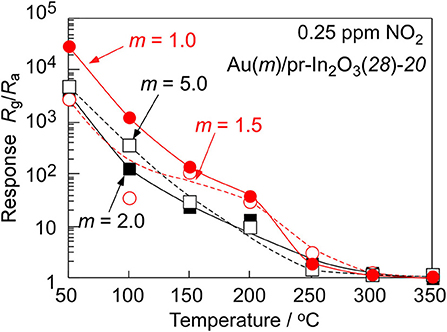
Figure 5. Variations in response of the Au(m)/pr-In2O3(28)-20 sensors to 0.25 ppm NO2 in dry air with operating temperature.
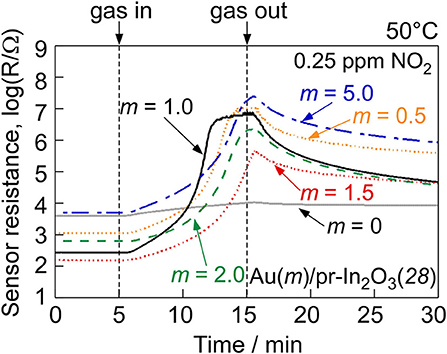
Figure 6. Response transients of the Au(m)/pr-In2O3(28)-20 sensors to 0.25 ppm NO2 at 50°C in dry air.
Effects of the Au Loading to pr-In2O3(n) Powders on the NO2 Sensing Properties
The In2O3-based sensors generally respond to NO2 since NO2 molecules are negatively adsorbed on the oxide surface (Roso et al., 2017). The magnitude of NO2 response of the pr-In2O3(n)-20 sensors was increased by the loading of a small amount of Au as shown in the previous section, which indicates that the highly dispersed Au nanoparticles loaded enhanced the amount of negatively charged NO2 adsorbed on the oxide surface. Several researchers also reported an increase in the NO2 response of the semiconductor-type gas sensors by Au loading onto the metal oxides, and they suggested an increase in the adsorption amount of NO2 as a result of spillover effects (Choi et al., 2011; Mun et al., 2013; Shim et al., 2013). In addition, the Au(m)/pr-In2O3(28)-20 (m: 0.5, 1.0) sensors showed rather larger NO2 response than the Au(m)/pr-In2O3(28)-20 (m: 1.5, 2.0, 5.0) sensors. Supplementary Figure 4 shows XRD patterns of the Au(m)/pr-In2O3(28) powders (m: 1.0, 5.0). The both powders were assigned to cubic In2O3, and a small amount of Au was detected in the Au(5.0)/pr-In2O3(28) powder. Supplementary Figure 5 shows XPS spectra of In3d and Au4f of the pr-In2O3(28) and the Au(m)/pr-In2O3(28) powders (m: 1.0, 5.0). Two peaks corresponding to In3d5/2 (e.g., ca. 444.7, 444.7, and 444.8 eV for the pr-In2O3(28), the Au(1.0)/pr-In2O3(28), and the Au(5.0)/pr-In2O3(28), respectively) and In3d3/2 (e.g., ca. 452.2, 452.2, and 452.3 eV for the pr-In2O3(28), the Au(1.0)/pr-In2O3(28), and the Au(5.0)/pr-In2O3(28), respectively) were observed, and all the In3d peaks indicate the chemical state of In3+ (Atashbar et al., 1999; Wu et al., 2003). In addition, two peaks corresponding to Au4f7/2 [e.g., ca. 83.9 eV for the Au(1.0)/pr-In2O3(28) and the Au(5.0)/pr-In2O3(28)] and Au4f5/2 [e.g., ca. 87.6 eV for the Au(1.0)/pr-In2O3(28), and the Au(5.0)/pr-In2O3(28)] showed the chemical state of Au loaded on the pr-In2O3 was metal (Seah et al., 1998; Liu et al., 2012). Supplementary figure 6 shows SEM photographs and pore-size distributions of the Au(m)/pr-In2O3(28) powders (m: 1.0, 5.0). Well-developed spherical pores were observed on the surface of the both powders. The mode diameter in pore-size distribution calculated from the N2 desorption isotherm of the Au(5.0)/pr-In2O3(28) powders was ca. 18 nm, which was smaller than those of the Au(1.0)/pr-In2O3(28) powders (ca. 22 nm) and the Au(0.5)/p-In2O3(28) powders (ca. 22 nm, Table 1). In addition, the SSA of the Au(5.0)/p-In2O3(28) powders (33.1 m2/g) was smaller than that of the Au(1.0)/p-In2O3(28) powders (36.9 m2/g). Considering the SSA values of all the Au(m)/p-In2O3(28) powders and the magnitude of NO2 responses of all the Au(m)/p-In2O3(28) sensors, the increase in the SSA was obviously effective in enhancing the NO2 responses. Figure 7 shows TEM images of the Au(m)/pr-In2O3(28) powders (m: 1.0, 5.0), together with an EDX image of Au in the Au(5.0)/pr-In2O3(28) powders. The TEM photographs showed that the Au loaded was highly dispersed in both the Au(m)/pr-In2O3(28) particles, while a quite large Au agglomerate with a diameter of ca. 22 nm was also observed in a Au(5.0)/pr-In2O3(28) particle(particle (Figure 7Bi)). This result suggests the 5 wt% loading of Au exceeds the limit for the well-dispersion of Au on the pr-In2O3 surface. In addition, the resistance of the Au(1.0)/pr-In2O3(28)-20 sensor in air was much smaller than that of the pr-In2O3(28)-20 sensor, while the resistance of the Au(5.0)/pr-In2O3(28)-20 sensor in air was comparable with that of the pr-In2O3(28)-20 sensor (Figure 6). Subramanian et al., revealed the size of Au nanoparticles largely affects the flat band potential of Au/TiO2. They reported that the loading of 3-nm-diameter Au nanoparticles on TiO2 induced a greater negative shift in flat band potential than that of 8-nm-diameter Au nanoparticles. Therefore, the size of the Au nanoparticles possibly affects the number of free electrons and thus decrease the resistance of the Au(m)/pr-In2O3(28)-20 sensors in air. The lower resistance of the Au(1.0)/pr-In2O3(28) sensor in air is one of advantages to detect the oxidizing gases such as NO2, because the resistance increases by the negatively adsorption of NO2. Furthermore, the response of semiconductor-type gas sensors arises from the resistance change at the bottom part of the sensing layer between interdigitated Pt electrodes. Therefore, the NO2 adsorption on the oxide surface at the upper part of the sensing layer decreases the effective concentration of NO2 at the bottom part of the sensing layer at the initial process of the NO2 response, and thus it brings a large delay to reach the maximum concentration (e.g., ca. 0.25 ppm in Figure 6) of NO2. Especially, the Au(5.0)/pr-In2O3(28)-20 sensor didn't reach to the steady-state value during the NO2 exposure in this study, while the Au(1.0)/pr-In2O3(28)-20 sensor reached to the almost constant value. This results showed the larger adsorption amount of NO2 on the surface of the sensing layer of the Au(5.0)/pr-In2O3(28)-20 sensor than that of the Au(1.0)/pr-In2O3(28)-20 sensor, leading to a decrease in the NO2 response. As a result, these facts suggest that the 1.0 wt% of Au loading on the pr-In2O3 was the most effective in increasing the amount of NO2 adsorbed on the bottom part of the sensing layer among the sensors. In addition, the response speed of the Au(0.5)/pr-In2O3(70)-20 sensor was much slower than that of the Au(0.5)/pr-In2O3(28)-20 sensor at 30°C, probably due to facile gas diffusion of the Au(0.5)/pr-In2O3(28)-20 sensor. Introducing the pores using the PMMA microspheres as a template improves gas diffusion from the surface part to the bottom part of the sensing layer. In addition, the sensing layer of the Au(0.5)/pr-In2O3(28)-20 sensor contains larger number of pores than that of the Au(0.5)/pr-In2O3(70)-20 sensor. This is because the PMMA microspheres were polymerized by using the same weight of MMA, and thus the concentration of PMMA microspheres (ps: 28 nm) in the precursor solution of ultrasonic spray pyrolysis was higher than that of the ones (ps: 70 nm). Therefore, the gases rapidly diffused to the whole sensing layer of the Au(0.5)/pr-In2O3(28)-20 sensor, leading to the faster response speed.
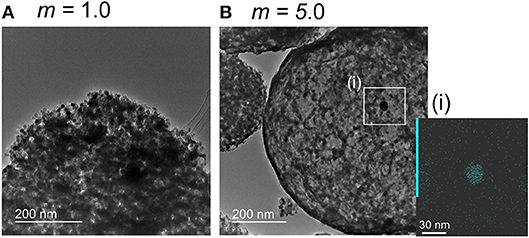
Figure 7. TEM photographs of (A) the Au(1.0)/pr-In2O3(28) powder and (B) the Au(5.0)/pr-In2O3(28) powder, and [inset in B(i)] an EDX photograph of the Au(5.0)/pr-In2O3(28) powder.
On the other hand, the NO2 response of the pr-In2O3(70)-20 sensor was largely decreased by the small loading amount of Au at the higher temperatures (≥300°C) (Figure 2). Generally, the given amount of NO2 partially converts to NO, especially at more than 200°C, and the ratio of conversion increased with an increase in the temperature (Miura et al., 2007; Kim et al., 2010). Therefore, the loading of Au onto the In2O3 surface increased the decomposition efficiency from NO2 to NO, leading to a reduction of the effective concentration of NO2 at the bottom part of the sensing layer and a decrease in the NO2 response of the sensor.
NO2 Sensing Properties of Au(1.0)/pr-In2O3(28)-t Sensors
In order to understand effects of the Au loading, the NO2-sensing properties of the Au(1.0)/pr-In2O3(28)-t sensors (t: 5, 10, 60) were also examined. Figure 8 shows cross-sectional SEM photographs of the sensing layers of the Au(1.0)/pr-In2O3(28)-t (t: 5, 10, 20, 60) sensors, together with their thickness. Figure 9 shows variations in response of these sensors to 0.25 and 5 ppm NO2 in dry air with operating temperature, together with that of the Au(1.0)/pr-In2O3(28)-20 sensor. Figure 10 shows response transients of all these sensors to 0.25 ppm NO2 in dry air at 50 and 200°C. The response of all the sensors to NO2 increased with a decrease in the operating temperature, whereas only the Au(1.0)/pr-In2O3(28)-60 sensor showed much smaller response only to 0.25 ppm NO2 than others. The response speed of these sensors to NO2 increased with a decrease in the thickness of the Au(1.0)/pr-In2O3(28)-t sensors, especially at 50°C. Among them, note that the response speed of the Au(1.0)/pr-In2O3(28)-5 sensor was faster than that of the Au(1.0)/pr-In2O3(28)-10 sensor, even though the magnitude of NO2 response and the recovery speed of the both sensors were quite comparable to each other. This trend is understandable by a decrease in the NO2 diffusion time from the surface part to the bottom part of the sensing layer between interdigitated Pt electrodes. In addition, the smaller NO2 diffusion may bring the smaller NO2 response, especially for the detection of lower concentration of NO2, because the effective concentration of NO2 at the bottom part of the sensing layer won't change for a long time by the adsorption of NO2 on the surface of the Au(1.0)/pr-In2O3(28) during gas diffusion. The sensing properties to lower concentration of NO2 at 50°C were examined in the next section.
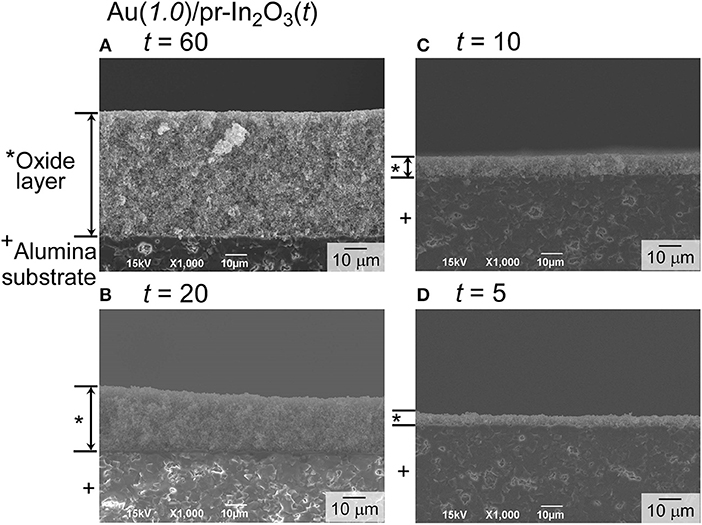
Figure 8. Cross-sectional views of the sensing layers of the Au(1.0)/pr-In2O3(70)-t sensors [t: (A) 60, (B) 20, (C) 10, and (D) 5 (μm)]. The weight ratio between the Au(1.0)/pr-In2O3(28) powder and α-terpineol was 1:2 (t: 20 and 60), 1:5 (t: 10), 1:10 (t: 5). The paste for the Au(1.0)/pr-In2O3(70)-60 sensor was laminated three times to obtain the thickest sensing layer.
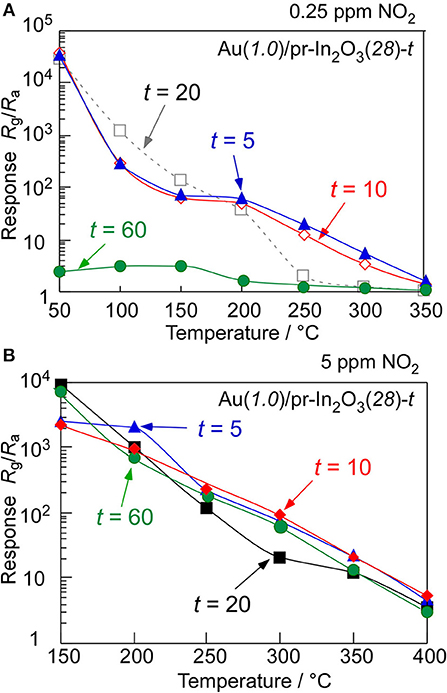
Figure 9. Variations in response of the Au(1.0)/pr-In2O3(28)-t sensors to (A) 0.25 and (B) 5 ppm NO2 in dry air with operating temperature.
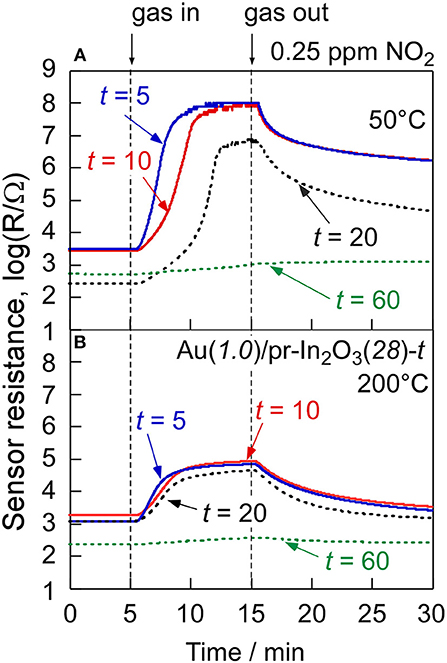
Figure 10. Response transients of the Au(1.0)/pr-In2O3(28)-t sensors to 0.25 ppm NO2 at (A) 50 and (B) 200°C in dry air.
In addition, the Au(1.0)/pr-In2O3(28)-t (t: 5, 10) sensors showed larger response to 0.25 ppm NO2 than that of the Au(1.0)/pr-In2O3(28)-20 sensor at high temperatures more than 200°C. Furthermore, the response and recovery speeds as well as the magnitude of NO2 response of the Au(1.0)/pr-In2O3(28)-5 sensor were also comparable to those of the Au(1.0)/pr-In2O3(28)-10 sensor at 200°C, because the gas-diffusion rate at 200°C was much higher than that at 50°C and thus the effects of thickness of the sensing layers on the NO2-sensing properties were decreased. On the other hand, the decrease in the response to a low concentration of NO2 (0.25 ppm) with an increase in the thickness of the sensing layers at more than 200°C is probably due to the decomposition of NO2 in the sensing layer and thus the decrease in the effective concentration of NO2 at the bottom part of the sensing layer. Since the increase in the thickness of the sensing layer increased the decomposition efficiency from NO2 to NO to reduce the effective concentration of NO2 at the bottom part of the sensing layer at more than 200°C, the NO2 response of the Au(1.0)/pr-In2O3(28)-t sensors decreased with an increase in the thickness of the sensing layer in the temperature range. However, the catalytic activity of the decomposition of NO2 to NO over the oxide surface in air is not so high. Therefore, a decrease in the effective concentration of NO2 at higher concentration (5 ppm) on the basis of the catalytic decomposition of NO2 to NO is not significant to a decrease in the NO2 response, compared to that at lower concentration (0.25 ppm) as shown in Figure 9.
NO2 Sensing Properties of Au(1.0)/pr-In2O3(28+150)-t Sensors
Easy gas diffusion of NO2 from the oxide surface to the bottom part of the sensing layer enhances the NO2 response and the response speed at low operating temperatures. Thus, the introduction of much larger pores has been attempted into the Au(1.0)/pr-In2O3(28) powder. Commercial PMMA microspheres with a diameter of ca. 150 nm (Soken Chem. & Eng. Co. Ltd., MP-1451) were mixed into the precursor solution containing homemade PMMA microspheres with a diameter of ca. 28 nm, and then 1.0 wt% Au-loaded pr-In2O3 powder with two kinds of spherical pores (Au(1.0)/pr-In2O3(28+150) powders) were prepared by ultrasonic spray pyrolysis. Figure 11 shows an SEM photograph and pore-size distribution of the Au(1.0)/pr-In2O3(28+150) powder with its SSA. The SEM photograph shows that both macropores (80–100 nm in diameter) and mesopores (20–30 nm in diameter) are well developed in the Au(1.0)/pr-In2O3(28+150) powder. The existence of the macropores was also confirmed in the pore-size distribution calculated from N2 adsorption isotherm in a diameter range of 80–100 nm. These results strongly support that the macropores were based on the commercial large PMMA microspheres. On the other hand, the introduction of macropores has little effect on SSA. Figure 12 shows response transients of the Au(1.0)/pr-In2O3(28)-t and Au(1.0)/pr-In2O3(28+150)-t sensors (t: 5, 10, 20) to 0.025 ppm NO2 in dry air at 50°C. The resistance of all the sensors gradually increased upon exposure to the very low concentration of NO2, and the Au(1.0)/pr-In2O3(28+150)-t sensors showed larger NO2 response than those of the Au(1.0)/pr-In2O3(28)-t sensors. In addition, a decrease in the thickness of the Au(1.0)/pr-In2O3(28+150)-t sensors increased the NO2 response. Among them, the Au(1.0)/pr-In2O3(28+150)-5 sensor showed the largest NO2 response. This is because the introduction of the well-developed macropores improves the gas diffusion from the surface to the bottom part of the sensing layer and increases the effective concentration of NO2 at the bottom part of the sensing layer. Therefore, it was confirmed that the smaller NO2 diffusion brings the smaller NO2 response due to the adsorption of NO2 during gas diffusion, especially for the detection of the lower concentration of NO2.
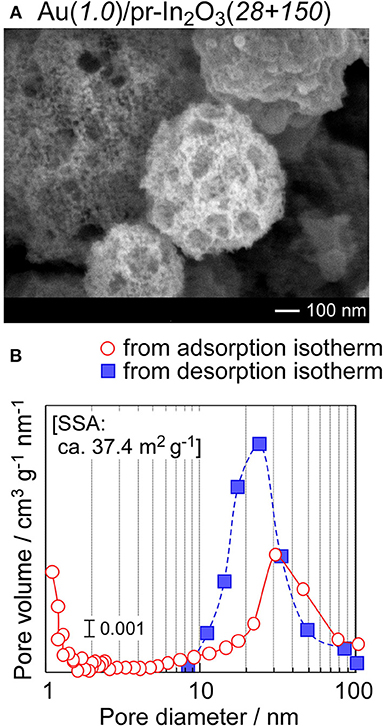
Figure 11. (A) SEM photograph and (B) pore-size distribution of the Au(1.0)/pr-In2O3(28 + 150) powder with its specific surface area (SSA).
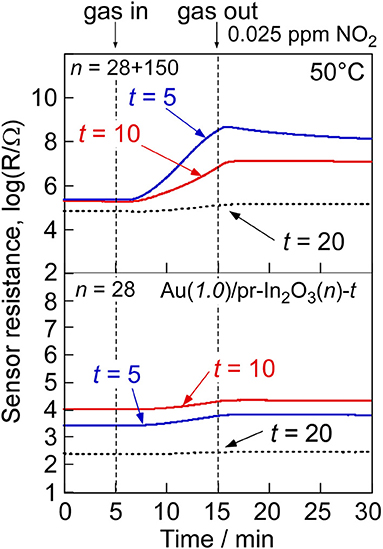
Figure 12. Response transients of the Au(1.0)/pr-In2O3(28+150)-20 and Au(1.0)/pr-In2O3(28)-20 sensors to 0.025 ppm NO2 at 50°C in dry air.
Conclusion
The NO2 sensing properties of the pr-In2O3 sensors loaded with and without noble metal (Au, Pd, or Pt) were examined, and factors for enhancing the NO2 sensing properties were discussed. The Au(0.5)/pr-In2O3(70)-20 sensor showed larger NO2 response at lower temperatures (≤200°C) than the pr-In2O3(70)-20 sensor, while the Pd or Pt loading were hardly effective for improving the NO2 response. The NO2 response of the pr-In2O3(n)-20 sensors increased with a decrease in the operating temperature at 200–350°C, but their NO2 response decreased with a decrease in operating temperature at <200°C. However, the NO2 response of the Au(0.5)/pr-In2O3(n)-20 sensors increased with a decrease in operating temperature, and the Au(0.5)/pr-In2O3(28)-20 sensor showed the much larger NO2 response than that of the Au(0.5)/pr-In2O3(70)-20 sensor at <150°C. Therefore, we concluded the highly dispersed Au nanoparticles enhance the amount of negatively charged NO2 adsorbed on the oxide surface.
The Au(1.0)/pr-In2O3(28)-20 sensor showed the highest NO2 response among the Au(m)/pr-In2O3(28)-20 sensors. The magnitude of response to 0.25 ppm NO2 of the Au(1.0)/pr-In2O3(28)-60 sensor was smallest and the response speed of the Au(1.0)/pr-In2O3(28)-5 sensor was fastest among the Au(1.0)/pr-In2O3(28)-t sensors at 50°C. In addition, the Au(1.0)/pr-In2O3(28+150)-t sensors showed larger NO2 response than those of the Au(1.0)/pr-In2O3(28)-t sensors. A decrease in the thickness of the Au(1.0)/pr-In2O3(28+150)-t sensors increased the NO2 response. Among them, the Au(1.0)/pr-In2O3(28+150)-5 sensor showed the largest NO2 response. It was suggested that the introduction of the well-developed macropores improves the gas diffusion from the surface to the bottom part of the sensing layer. And thus, the effective concentration of NO2 at the bottom part of the sensing layer increased, leading to the large NO2 response.
Author Contributions
TU, KK, TH, and YS: manuscript writing and results interpretation; KI: experiments.
Conflict of Interest Statement
The authors declare that the research was conducted in the absence of any commercial or financial relationships that could be construed as a potential conflict of interest.
Supplementary Material
The Supplementary Material for this article can be found online at: https://www.frontiersin.org/articles/10.3389/fmats.2019.00081/full#supplementary-material
References
Atashbar, M., Gong, B., Sun, H. T., Wlodarski, W., and Lamb, R. (1999). Investigation on ozone-sensitive In2O3 thin films. Thin Solid Films 354, 222–226. doi: 10.1016/S0040-6090(99)00405-8
Chen, D., Ge, L., Yin, L., Shi, H., Yang, D., Yang, J., et al. (2014). Solvent-regulated solvothermal synthesis and morphology-dependent gas-sensing performance of low-dimensional tungsten oxide nanocrystals. Sens. Actuators B 205, 391–400. doi: 10.1016/j.snb.2014.09.007
Choi, S.-W., Jung, S.-H., and Kim, S. S. (2011). Significant enhancement of the NO2 sensing capability in networked SnO2 nanowires by Au nanoparticles synthesized via γ-ray radiolysis. J. Hazard. Mater. 193, 243–248. doi: 10.1016/j.jhazmat.2011.07.053
Degler, D., Carvalho, H. W. P., Kvashnina, K., Grunwaldt, J.-D., Weimar, U., and Barsan, N. (2016b). Structure and chemistry of surface-doped Pt:SnO2 gas sensing materials. RSC Adv. 6, 28149–28155. doi: 10.1039/C5RA26302F
Degler, D., Rank, S., Müller, S., Carvalho, H. W., Grunwaldt, J.-D., Weimar, U., et al. (2016a). Gold-loaded tin dioxide gas sensing materials: mechanistic insights and the role of gold dispersion. ACS Sens. 1, 1322–1329. doi: 10.1021/acssensors.6b00477
Firooz, A. A., Hyodo, T., Mahjoub, A. R., Khodadadi, A. A., and Shimizu, Y. (2010). Synthesis and gas-sensing properties of nano- and meso-porous MoO3-doped SnO2. Sens. Actuators B 147, 554–560. doi: 10.1016/j.snb.2010.03.021
Guo, W. (2016). Design of gas sensor based on Fe-doped ZnO nanosheet-spheres for low concentration of formaldehyde detection. J. Electrochem. Soc. 163, B517–B525. doi: 10.1149/2.1261609jes
Hashimoto, M., Inoue, H., Hyodo, T., Shimizu, Y., and Egashira, M. (2008). Preparation and gas sensor application of ceramic particles with submicron-size spherical macropores. Sens. Lett. 6, 887–890. doi: 10.1166/sl.2008.524
Hieda, K., Hyodo, T., Shimizu, Y., and Egashira, M. (2008). Preparation of porous tin dioxide powder by ultrasonic spray pyrolysis and their application to sensor materials. Sens. Actuators B 133, 144–150. doi: 10.1016/j.snb.2008.02.002
Hyodo, T., Abe, S., Shimizu, Y., and Egashira, M. (2003). Gas-sensing properties of ordered mesoporous SnO2 and effects of coatings thereof. Sens. Actuators B 93, 590–600. doi: 10.1016/S0925-4005(03)00208-9
Hyodo, T., Fujii, E., Ishida, K., Ueda, T., and Shimizu, Y. (2017). Microstructural control of porous In2O3 powders prepared by ultrasonic-spray pyrolysis employing self-synthesized polymethylmethacrylate microspheres as a template and their NO2-sensing properties. Sens. Actuators B 244, 992–1003. doi: 10.1016/j.snb.2017.01.091
Hyodo, T., Furuno, S., Fujii, E., Matsuo, K., Motokucho, S., Kojio, K., et al. (2013). Porous In2O3 powders prepared by ultrasonic-spray pyrolysis as a NO2-sensing material: Utilization of polymethylmethacrylate microspheres synthesized by ultrasonic-assisted emulsion polymerization as a template. Sens. Actuators B 187, 495–502. doi: 10.1016/j.snb.2013.02.090
Hyodo, T., Inoue, H., Motomura, H., Matsuo, K., Hashishin, T., Tamaki, J., et al. (2010). NO2 sensing properties of macroporous In2O3-based powders fabricated by utilizing ultrasonic spray pyrolysis employing polymethylmethacrylate microspheres as a template. Sens. Actuators B 151, 265–273. doi: 10.1016/j.snb.2010.09.002
Hyodo, T., Nishida, N., Shimizu, Y., and Egashira, M. (2001). Preparation of thermally stable mesoporous tin dioxide powders with high specific surface area by utilizing self-assembly of surfactants. J. Ceram. Soc. Jpn. 109, 481–483. doi: 10.2109/jcersj.109.1270_481
Hyodo, T., Nishida, N., Shimizu, Y., and Egashira, M. (2002). Preparation and gas-sensing properties of thermally stable mesoporous SnO2. Sens. Actuators B 83, 209–215. doi: 10.1016/S0925-4005(01)01042-5
Hyodo, T., Sasahara, K., Shimizu, Y., and Egashira, M. (2005). Preparation of macroporous SnO2 films using PMMA microspheres and their sensing properties to NOx and H2. Sens. Actuators B 106, 580–590. doi: 10.1016/j.snb.2004.07.024
Kim, C. H., Qi, G., Dahlberg, K., and Li, W. (2010). Strontium-doped perovskites rival platinum catalysts for treating NOx in simulated diesel exhaust. Science 327, 1624–1627. doi: 10.1126/science.1184087
Kim, D.-H., Jung, J.-W., Choi, S.-J., Jang, J.-S., Koo, W.-T., and Kim, I.-D. (2018a). Pt nanoparticles functionalized tungsten oxynitride hybrid chemiresistor: low-temperature NO2 sensing. Sens. Actuators B 273, 1269–1277. doi: 10.1016/j.snb.2018.07.002
Kim, D.-H., Kim, T.-H., Sohn, W., Suh, J.-M., Shim, Y.-S., Kwon, K.-C., et al. (2018b). Au decoration of vertical hematite nanotube arrays for further selective detection of acetone in exhaled breath. Sens. Actuators B 274, 587–594. doi: 10.1016/j.snb.2018.07.159
Liu, X., Liu, M.-H., Luo, Y.-C., Mou, C.-Y., Lin, S. D., Cheng, H., et al. (2012). Strong metal–support interactions between gold nanoparticles and ZnO nanorods in CO oxidation. J. Am. Chem. Soc. 134, 10251–10258. doi: 10.1021/ja3033235
Miura, N., Wang, J., Elumalai, P., Ueda, T., Terada, D., and Hasei, M. (2007). Improving NO2 sensitivity by adding WO3 during processing of NiO sensing-electrode of mixed-potential-type zirconia-based sensor. J. Electrochem. Soc. 154, J246–J252. doi: 10.1149/1.2747532
Mun, Y., Park, S., An, S., Lee, C., and Kim, H. W. (2013). NO2 gas sensing properties of Au-functionalized porous ZnO nanosheets enhanced by UV irradiation. Ceram. Int. 39, 8615–8622. doi: 10.1016/j.ceramint.2013.04.035
Ogel, E., Meller, S. A., Sackmann, A., Gyger, F., Bockstaller, P., Brose, E., et al. (2017). Comparison ofthe catalytic performance and carbon monoxide sensing behavior of Pd-SnO2 Core@Shell nanocomposites. ChemCatChem 9, 407–413. doi: 10.1002/cctc.201601132
Roso, S., Degler, D., Llobet, E., Barsan, N., and Urakawa, A. (2017). Temperature-dependent NO2 sensing mechanisms over indium oxide. ACS Sens. 2, 1272–1277. doi: 10.1021/acssensors.7b00504
Seah, M. P., Gilmore, I. S., and Beamson, G. (1998). XPS: Binding energy calibration of electron spectrometers 5–Re-evaluation of the reference energies. Surf. Interface Anal. 26, 642–649. doi: 10.1002/(SICI)1096-9918(199808)26:9<642::AID-SIA408>3.0.CO;2-3
Shim, Y.-S., Moon, H. G., Kim, D. H., Zhang, L., Yoon, S.-J., Yoon, Y. S., et al. (2013). Au-decorated WO3 cross-linked nanodomes for ultrahigh sensitive and selective sensing of NO2 and C2H5OH. RSC Adv. 3, 10452–10459. doi: 10.1039/c3ra41331d
Sun, P., Zhou, X., Wang, C., Wang, B., Xu, X., and Lu, G. (2014). One-step synthesis and gas sensing properties of hierarchical Cd-doped SnO2 nanostructures. Sens. Actuators B 190, 32–39. doi: 10.1016/j.snb.2013.08.045
Takacs, M., Ducso, C., and Pap, A. E. (2015). Fine-tuning of gas sensitivity by modification of nano-crystalline WO3 layer morphology. Sens. Actuators B 221, 281–289. doi: 10.1016/j.snb.2015.06.081
Tang, L., Tian, Y., Liu, Y., Wang, Z., and Zhou, B. (2013). One-step solution synthesis of urchin-like ZnO superstructures from ZnO rods. Ceram. Int. 39, 2303–2308. doi: 10.1016/j.ceramint.2012.08.077
Wang, C., Li, X., Feng, C., Sun, Y., and Lu, G. (2015). Nanosheets assembled hierarchical flower-like WO3 nanostructures: synthesis, characterization, and their gas sensing properties. Sens. Actuators B 210, 75–81. doi: 10.1016/j.snb.2014.12.020
Wang, C., Sun, R., Li, X., Sun, Y., Sun, P., Liu, F., et al. (2014). Hierarchical flower-like WO3 nanostructures and their gas sensing properties. Sens. Actuators B 204, 224–230. doi: 10.1016/j.snb.2014.07.083
Wei, S., Wang, S., Zhang, Y., and Zhou, M. (2014). Different morphologies of ZnO and their ethanol sensing property. Sens. Actuators B 192, 480–487. doi: 10.1016/j.snb.2013.11.034
Wu, X. C., Hong, J. M., Han, Z. J., and Tao, Y. R. (2003). Fabrication and photoluminescence characteristics of single crystalline In2O3 nanowires. Chem. Phys. Lett. 373, 28–32. doi: 10.1016/S0009-2614(03)00582-7
Keywords: NO2 sensor, porous In2O3 powder, loading of Au, ultrasonic spray pyrolysis, polymethylmethacrylate microsphere, ultrasonic-assisted emulsion polymerization
Citation: Ueda T, Ishida K, Kamada K, Hyodo T and Shimizu Y (2019) Improvement in NO2 Sensing Properties of Semiconductor-Type Gas Sensors by Loading of Au Into Porous In2O3 Powders. Front. Mater. 6:81. doi: 10.3389/fmats.2019.00081
Received: 23 January 2019; Accepted: 05 April 2019;
Published: 24 April 2019.
Edited by:
Qasem Ahmed Drmosh, King Fahd University of Petroleum and Minerals, Saudi ArabiaReviewed by:
Nittaya Tamaekong, Maejo University, ThailandSubhasis Roy, University of Calcutta, India
Copyright © 2019 Ueda, Ishida, Kamada, Hyodo and Shimizu. This is an open-access article distributed under the terms of the Creative Commons Attribution License (CC BY). The use, distribution or reproduction in other forums is permitted, provided the original author(s) and the copyright owner(s) are credited and that the original publication in this journal is cited, in accordance with accepted academic practice. No use, distribution or reproduction is permitted which does not comply with these terms.
*Correspondence: Taro Ueda, dGFyb3VlZGFAbmFnYXNha2ktdS5hYy5qcA==