 Ramiro Ruiz-Rosas*
 Francisco J. García-Mateos
 María del Carmen Gutiérrez
 José Rodríguez-Mirasol
 Tomás Cordero
- Departamento de Ingeniería Química, Facultad de Ciencias, Universidad de Málaga, Andalucía Tech, Málaga, Spain
The preparation of phosphorus-containing activated carbons and the effect of their surface chemistry and porosity on the performance as adsorbents of paracetamol are herein reported. A parent activated carbon is prepared by chemical activation of olive stones with phosphoric acid at 500°C and impregnation weight ratio of 3:1. This carbon is thermal treated under inert atmosphere at 900°C, producing porosity shrinkage, loss of 20% of surface area and less oxidized phosphorus groups. In addition, our knowledge about the redox behavior of P-containing groups has allowed the controlled gasification of the parent activated carbon in diluted air atmosphere, developing wide micropores and mesopores, increasing 40% the specific surface area and producing more oxidized phosphorus groups. Adsorption of a model micropollutant, paracetamol, has been conducted over these activated carbons by using diluted aqueous solutions (<10 mg L−1). Batch and small-scale column experiments confirmed that the presence of narrow microporosity and surface chemistry compatible with paracetamol improves the adsorption capacity, at the point of overcoming the potential effect of additional microporosity development. Moreover, the presence of a well-developed micro- and mesoporisity combined with a low surface acidity (that increases the affinity of the activated carbon surface and paracetamol) enhances the mass transfer rate of the adsorbent, improving the small-scale column performance parameters. To sum up, this study emphasizes the key role played by surface chemistry on the applicability of P-containing activated carbon as adsorbents. These results also confirm that controlled gasification at high temperatures of P-containing activated carbons is a useful method for improving their behavior in micropollutant abatement.
Introduction
Water is a very important constituent of the ecosystem on the Earth and essential component of life. The current deterioration of water quality is directly related to population growth and a lower availability of water sources. This deterioration is reflected in an increase of micropollutants or emerging pollutants, which presence in water effluents is mainly attributed to their incomplete removal through conventional methods in wastewater treatment plants (WWTP) (Onesios et al., 2009; Luo et al., 2014; Petrie et al., 2014). Consequently, these compounds are increasingly found in water systems, mainly in surface waters such as rivers, affecting the quality of drinking water supplies (Mailler et al., 2016). Micropollutants are characterized by their wide distribution and low concentration (ppb or ppt), high variety and heterogeneous physicochemical properties. Currently, they are being widely detected and have the potential to generate an environmental impact and have adverse effects on the health of living beings (Estrada-Arriaga et al., 2016). Therefore, WWTPs face great challenges in optimizing technologies to remove, as much as possible, this type of chemical compounds avoiding human health problems and ensuring environmental sustainability (Teodosiu et al., 2018).
Among the wide diversity of viable technologies to remove micropollutants from water, many researchers support that activated carbons adsorption is superior to other methods providing an effective and fast removal of pollutants with low operating cost, simple design and low production of harmful by-products (Rivera-Utrilla et al., 2011; Boehler et al., 2012; Bhatnagar et al., 2013). In fact, the interest for using activated carbons for adsorption has spread into diverse industrial fields such as food, chemical, petroleum, nuclear or pharmaceutical industries among others (Bansal and Goyal, 2005). The environmental and economic advantages of this method are obviously increased when activated carbons are obtained from biomass waste because it is cheap, renewable and available in large quantities (Danish and Ahmad, 2018). Specifically, olive stone, a lignocellulosic biomass waste highly abundant in our region, is a potential precursor of activated carbons (López-González et al., 1980; Rodríguez-Reinoso et al., 1995).
Our research team have lots of experience in the preparation of activated carbons from olive stone (Bedia et al., 2009; García-Mateos et al., 2015), hemp fiber (Rosas et al., 2009), lignin (Rodríguez-Mirasol et al., 1993; Gonzalez-Serrano et al., 1997, 2004; Cotoruelo et al., 2009, 2011) or others biomass waste such as eucalyptus wood (Tancredi et al., 1996), Pinus caribaea sawdust (Márquez-Montesinos et al., 2001) or fruit skin (Marquez-Montesinos et al., 2002; Rosas et al., 2010). We have reported the effects of the activation process with chemicals and physical methods in the porosity and surface chemistry and how they improve the carbon adsorption properties.
The activation process is the preparation stage of activated carbon where pore development takes part, with the available methods being classified either as physical activation or as chemical activation. While physical activation methods result in the preparation of microporous solid with large surface area but poor mass transfer rate, chemical activation methods allow the development of mesoporosity that enhances mass transfer rates of pollutants (Aktaş and Ferhan, 2012). It is important to note that the selected activation temperature and the activating agent in the chemical activation play a key role on the preparation yield as well as on the texture properties and surface chemistry of the resulting activated carbons (Rosas et al., 2012). In this sense, by controlling the activation process, it is possible to generate a wide variety of activated carbons to satisfy the requirements of diverse applications (Rosas et al., 2009). With regard to activated agents, many reagents have been tested; the most widely used are ZnCl2 (Gonzalez-Serrano et al., 1997), H3PO4 (Gonzalez-Serrano et al., 2004; Duan et al., 2017), KOH (Li et al., 2017), and NaOH (Kiliç et al., 2012), being ZnCl2 and H3PO4 preferred when activating lignocellulosic materials.
Specifically, activation of biomass waste by using phosphoric acid as activating agent is a well-established method that allows the preparation of carbons with higher contribution of the mesoporosity, which enhances mass transfer rates of pollutants. Several studies reported that phosphoric acid promotes the depolymerization of hemicellulose and lignin at low temperature during the chemical activation of lignocellulosic materials, as well as promote cyclation and condensation reactions of the polymeric fragments at medium temperatures. As a consequence, the formation and release of tars and volatiles is restricted during the carbonization process, thus increasing the yield of the remaining solid product (Jagtoyen and Derbyshire, 1998; Rosas et al., 2009). In addition, phosphate and polyphosphate groups form ester linkages through the hydroxyls of cellulose. These phosphorus groups have high thermal stability, crosslinking the polyaromatic units of the charred solid when temperature is increased. Therefore, the subsequent removal of the acid leaves the carbon matrix in an expanded state, with a high pore development structure (Castro et al., 2000; Vernersson et al., 2002; Li et al., 2005).
It is worth noting that the presence of stable phosphorous groups introduced during activation also confers to these carbonaceous solids high surface acidity (Bedia et al., 2010b) and oxidation resistance (Rosas et al., 2012), increasing the possibilities of these materials for applications in catalysis (Bedia et al., 2010a; Hita et al., 2016). The relevance of phosphorous groups on carbon reactivity has been demonstrated for the oxygen-carbon reaction (Valero-Romero et al., 2017) reported that the oxidation of P-containing carbons renders the preferential formation of oxygen-containing P surface groups through the oxidation of C-P to C-O-P bonds. Since C-O-P bonds are thermally stable up to 700°C, the carbon-oxygen reaction is inhibited at lower temperatures. Moreover, thermal treatment at temperatures over 800°C reduces C-O-P to C-P bonds. These redox properties of P groups also vary the carbon electrochemical reactivity (Berenguer et al., 2015) and the manner in which activated carbons are functionalized through organic reactions (Palomo et al., 2017).
Taking into account these considerations, the main aim of this study is to evaluate the role of surface chemistry and porosity of P-containing activating carbons from olive stones on the paracetamol adsorption. Following this purpose, a parent activated carbon is prepared by chemical activation with H3PO4. Two new activated carbons have been obtained from the parent activated carbon by thermal treatment at 900°C (i) in inert atmosphere (ii) in diluted air. The three activated carbons are characterized in terms of porous texture, surface chemistry and acidity. Batch and small-scale column adsorption of paracetamol on the three activated carbons are studied. Thermodynamic and kinetic parameters drawn from the batch adsorption experiments allow an accurate prediction of the breakthrough profiles from the column adsorption. Finally, the relationships between the surface properties of the activated carbons and their performance as adsorbents are discussed.
Materials and Methods
Preparation of Activated Carbons
Olive stones (provided by Sociedad Cooperativa Andaluza Olivarera y Frutera San Isidro, Periana) are used as feedstock for the preparation of activated carbons. The raw material is rinsed in water, dried overnight and impregnated with H3PO4 (85 wt%, Sigma Aldrich) at 60°C for 24 h. The weight impregnation ratio is set at 3:1 (3 grams of H3PO4 per gram of olive stone) in order to produce a high mesopore volume, a desirable feature for liquid phase adsorbents. The impregnated olive stones are placed in a tubular furnace and activated at 500°C at a heating rate of 10°C min−1 (holding time: 2 h) under continuous N2 flow (150 cm3 STP min−1). The sample is cooled down to room temperature in N2 and washed with distilled water at 60°C until neutral pH and negative phosphate analysis in the eluate are ensured. The obtained carbon (AC) is dried and weighted in order to determine the yield of the activation process (weight of activated carbon related to weight of raw material, in dry basis). The AC is grinded and sieved (300–100 μm) in order to control the particle size used in the adsorption experiments. In addition, two activated carbons with different porosity and surface chemistry are prepared by thermal treatment of AC at 900°C. The activated carbon labeled as AC-T is obtained under N2 flow during the treatment, whereas a gasified activated carbon (AC-G) is prepared by feeding diluted air (1% O2). Heating rate of 10°C min−1, holding time of 5 min and flow rate of 150 cm3 STP min−1 are utilized during the treatment. The sample is cooled down to room temperature in nitrogen in both cases.
Characterization of Activated Carbon
The porous texture of the activated carbons is analyzed by N2 adsorption-desorption at −196°C and CO2 adsorption at 0°C in ASAP 2020 equipment (Micromeritics) following the recommendations given by the IUPAC (Thommes et al., 2015). Samples are previously outgassed at 150°C for at least 8 h. From the N2 isotherm, the apparent surface area (SBET) is determined applying the BET equation, while the micropore volume (Vt) is calculated by using the t-method and the mesopore volume () is evaluated applying the Gurvich rule as the difference between the adsorbed volume of N2 at a relative pressure of 0.995 and the micropore volume (Vt). From the CO2 adsorption data, the narrow micropore volume (VDR) is calculated by using the Dubinin-Radushkevich equation. Pore size distribution is obtained from the N2 adsorption isotherms by using the 2D-NLDFT heterogeneous surface model (Jagiello and Olivier, 2013). Additionally, the mercury intrusion profiles into the pores of the activated carbons prepared in this work have been measured from 0 to 210 MPa with a Hg Micromeritics porosimeter (Autopore IV 9550). Contact angle of 130 degrees and surface tension of 485 dyne cm−1 have been considered in the Kelvin equation for the estimation of the pore size from the applied pressure.
The size, shape and texture of the carbon particles are characterized by scanning electron microscopy (SEM). The micrographs are recorded using a JEOL (JSM-6490LV) instrument. A collection of micrographs have been taken in order to determine the average particle size (Rp, m). The density in water of the samples (ρp, g cm−3) has been determined by water displacement in a pycnometer using 5 grams of dried sample.
The surface chemistry of the samples is analyzed by X-ray photoelectron spectroscopy (XPS) in a Physical Electronics equipment (5700C model) using Mg kα radiation (1253.6 eV). For detailed study of the peaks, the maximum of the C1s peak was set to 284.5 eV and used as reference to shift the other peaks. P 2p photoemission region has been deconvoluted following the procedure detailed elsewhere (Rosas et al., 2012). CO and CO2 temperature programmed desorption (TPD) analyses up to 940°C (10°C min−1) under inert flow (150 cm3 STP min−1) are carried out to determine the amount and type of surface oxygen groups. The gases evolved during the thermal treatment of 100 mg dried sample are analyzed by using specific CO and CO2 NDIR equipment (Siemens Ultramat 22). The bulk amount of phosphorus in the activated carbons has been determined by analyzing the P content of the ashes obtained by calcination in air at 900°C using inductively coupled plasma optical emission spectrometry (ICP-OES).
The acidity of the samples was evaluated by pyridine chemisorption at 120°C. For this study, 10 mg of dry activated carbon are loaded in a thermobalance (CI instruments) and outgassed at 150°C for 1 h under N2 flow (150 cm3 STP min−1). Saturation of the activated carbon is achieved at 120°C feeding pyridine (2% v v−1 in N2) until constant weight. The feeding gas is reverted to pure nitrogen flow in order to remove physically the adsorbed pyridine. The amount of chemisorbed pyridine is stablished as the weight uptake at the end of the experiment.
Adsorption of Paracetamol
Determination of the Adsorption Isotherms
Paracetamol (C8H9NO2, purity 99.5%, Sigma-Aldrich, labeled as PA along the text) is selected as a model compound for studying the effect of surface chemistry and porosity of P-containing activated carbons on the adsorption of emergent pollutants. The adsorption isotherm at 25°C has been determined by using batch experiments where 100 mL of PA solutions with different concentrations (1–20 mg L−1) and 10 mg of the different activated carbons are put in contact in stopped glass flasks. Adsorption equilibrium is ensured by keeping the flasks in an orbital incubator (Gallenkamp, model INR-250) at 200 rpm equivalent stirring rate for 10 days. The adsorbate concentrations are determined by UV spectroscopy (λmax: 243 nm) with an UV-Visible (Varian, Model Cary 1E) spectrophotometer. Adsorption capacities in the equilibrium, qe (mg g−1), are then determined:
In Equation (1), C0 and Ce stand for the initial and the equilibrium concentrations (mg L−1) of the adsorbate in solution, and w is the adsorbent dose (g L−1).
The experimental data for PA adsorption at the equilibrium were fitted using different adsorption isotherm models, being the best fitting provided by Langmuir model:
KL is the equilibrium constant (L mg−1), usually related to the enthalpy of adsorption, and qL is the equilibrium concentration of the adsorbate (mg g−1) on the activated carbon corresponding to a complete coverage of the available adsorption sites (i.e., adsorption capacity for the adsorption of a monolayer of the adsorbate).
Kinetic Adsorption
PA kinetic adsorption experiments are carried out in a 250 cm3 thermostatized batch system equipped with glass stirrer (rotating rate of 300 rpm). An initial PA concentration of 5 mg L−1, solution volume of 150 cm3 and adsorption temperature of 25°C are used for these experiments. 135 cm3 of distilled water and 15 mg of the carbon adsorbent are placed into the batch system before starting the experiment for wetting of the activated carbon pores. At the beginning of the experiment, 15 cm3 of a 50 mg L−1 PA solution is poured into the stirred tank. The concentration of the adsorbate is continuously monitored at the batch outlet by UV-vis by using a continuous-flow cell that allows the solution to pass through the spectrometer. The dead volume of the external tubbing and the flow cell is 4 cm3. The adsorbed amount of PA, qt (mg g−1), in the kinetic tests is calculated as:
where Ct (mg L−1) represents the adsorbate concentration in the aqueous phase at a given time. The kinetic results have been fitted to a modified hyperbolic equation (Equation 4) for data smoothing, what eases the determination of the diffusion constants.
where a (min−1), qm (mg g−1) and m are empirical parameters. qm represents the asymptotic qt (mg g−1) value in the function at the set experimental conditions. Therefore, qt tended to qm at the maximum contact time in the kinetic test.
In this sense, the equation proposed by Vermeulen (1953) (Equation 5) has been used to correlated the diffusion coefficient with time and the obtained data have been fitted by an exponential empirical equation (Equation 6)
where Rp is the particle radius (m) and b, c and d are empirical parameters.
Combining the hyperbolic equation (Equation 4) with Equation (6) it is possible to obtain an equation correlating the heterogeneous effective diffusion coefficient with the amount of adsorbed PA (Equation 7).
Small-Scale Column Adsorption Experiments
In order to analyze the dynamic response of activated carbons in the removal of the selected emerging pollutant, PA, small-scale adsorption columns experiments are performed using 200 mg of dry activated carbon. The activated carbons are packed within a thermostatized glass column (internal diameter of 5 mm) at 25 (± 0.5°C). The column height depends on the bulk density of the tested activated carbons, ranging from 2.8 to 3.4 cm. Before the test is started, the column is backwashed with water for 30 minutes to ensure the removal of trapped air and to fully wet the activated carbon porosity. PA solution (5 mg L−1) is pumped downflow through the column at 6 cm3 min−1 using a peristaltic pump. The breakthrough curves are obtained by continuous monitoring of the column outlet by UV spectrometry. We neglect the impact of axial dispersion effects confirming that the bed-length to particle diameter ratio (Lb/Rp) is larger than 20 in all cases (Raghavan and Ruthven, 1983).
In a previous work, we have reported a mathematical solution to the mass balance of the adsorption column that allows the prediction breakthrough profiles from batch adsorption measurements (García-Mateos et al., 2015). This approach has been also taken in this work to describe the column adsorption of paracetamol over P-containing activated carbons from the results of the batch adsorption experiments. In order to do so, a finite difference method is applied to solve simultaneously the PA mass balances i) along the carbon bed (z-axis) and ii) in the carbon particle (R-axis). Our previous work revealed that for the conditions used in this work, the external mass transfer resistance is much lower than the internal one, so that it is not necessary to include it in the mass balance to provide an accurate prediction of the breakthrough profile. The evaluation of a Peclet (which compares the advective to diffusive transport rates) number of ca. 2000 suggests that axial dispersion can be neglected. Moreover, a linear driving force model along with the assumption of a parabolic concentration profile of PA inside the carbon particles provides a good description of the internal mass transfer rate of the adsorbents. In consequence, the PA mass balances to be solved read as follow:
With v being the linear velocity of the liquid phase flowing through the column, ρp being the activated carbon density determined in water and ε being the bed porosity. In it, the diffusion coefficient, De, is related to the amount of adsorbed PA, , a dependency that is described in Equation (7). On the other hand, the Langmuir adsorption isotherm, Equation 2, and the assumption of the parabolic concentration profile in the carbon particle allows relating the concentration of PA in the bed, Cb, with the amount of PA adsorbed at the surface of the carbon particle at z point, qb. This allows the estimation of the average amount of adsorbed PA in the carbon porosity, , from the solution of the differential in Equation (9). More details regarding the mathematical solution of the mass balance to the adsorption column are provided elsewhere (García-Mateos et al., 2015).
Results and Discussion
Physicochemical Parameters of Activated Carbons
The textural properties of the activated carbons have been determined by means of N2 adsorption-desorption isotherms and Hg porosimetry. N2 adsorption isotherm of the parent AC (Figure 1A) reveals a sharp and large N2 uptake at low relative pressures owing to the presence of micropores, that is followed by a steady increase of adsorbed N2 amount at medium relative pressures, which can be related to the existence of mesopores (Thommes et al., 2015). The thermal treatments bring noticeable changes on the N2 adsorption isotherm of AC, which are different depending on the composition of the carrier gas. When performed under inert atmosphere, sample AC-T, the adsorbed volume decreases for all the relative pressures, indicating a porosity shrinkage. Differently, when a slightly oxidative atmosphere is used, sample AC-G, a controlled gasification of AC is achieved, delivering a large increase on the N2 uptake. The BET surface area, micropore and mesopore volumes derived from these isotherms are compiled in Table 1. They confirm the porosity shrinkage previously mentioned for sample AC-T (observed drops of 20% in micropore volume and SBET, and 13% in mesopore volume). In the case of the gasified sample, the surface area and micropore volume increases 40%, while mesopore volume is enlarged 75%. CO2 adsorption isotherm is used to assess the narrowest microporosity (pore sizes <0.7 nm) (Cazorla-Amorós et al., 1996, 1998). For all activated carbons, the micropore volume measured by N2 is larger than that measured by CO2, pointing out the predominance of wide micropores (i.e., pore sizes of 0.7–2.0 nm) in these samples. However, the Vt/ ratio decreases in sample AC-T, what is in line with a shrinkage of wide micropores to form narrow micropores. In the case of AC-G, this ratio remains unaltered, probably as a consequence of new wide micropores being formed by gasification of AC.
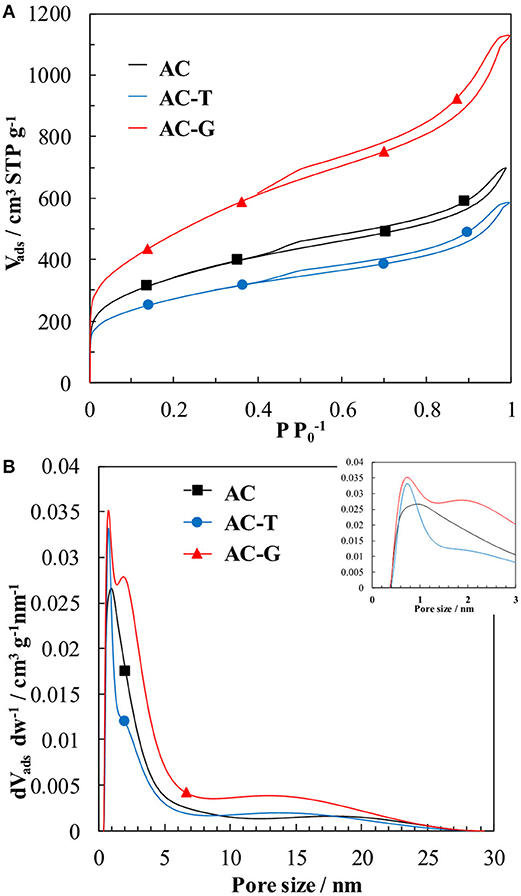
Figure 1. (A) N2 adsorption-desorption isotherms at −196°C of AC (square dot), AC-T (circle dot), and AC-G (triangle dot). (B) NL-DFT pore size distribution (PSD) derived from the N2 adsorption isotherms.
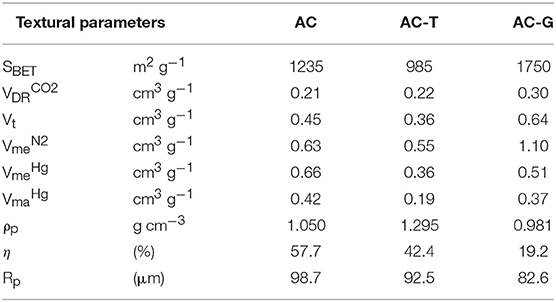
Table 1. Textural properties of activated carbon samples.
The evaluation of macro and mesopores volume of the analyzed samples by mercury porosimetry (Table 1) shows that AC has the largest macropore , pore size from 2,500 to 50 nm) and wide mesopores , pore sizes from 6 nm to 50 nm). The thermal treatment produces a shrinkage of both pore volumes. The pore contraction is larger in the case of AC-T. Figure 2 shows micrographs of the activated carbon samples at different magnifications. The decrease on these pore volumes seems to be related to a loss of external roughness of the particles, as pointed out by the smoother surface of AC-T and AC-G particles detected by SEM images at higher magnification covered in Figure 2. It is worth mentioning that mesopore volume measured from the nitrogen adsorption isotherm is larger than that measured by Hg porosimetry in AC-T and AC-G, pointing out the predominance of narrow mesopores (sizes from 2 to 6 nm) in these samples. The porosity shrinkage after the thermal treatment comes along with an increase of ca. 30% in the density evaluated in water of AC-T, ρp on Table 1. On the contrary, the development of micro and mesoporosity in AC-G renders a slight decrease of 7% on the density when compared to the parent AC. Finally, the burn-off of AC-G has been estimated from the preparation yields of AC-T (which is taken as the baseline of the gasification treatment) and AC-G, giving a value of 55%.
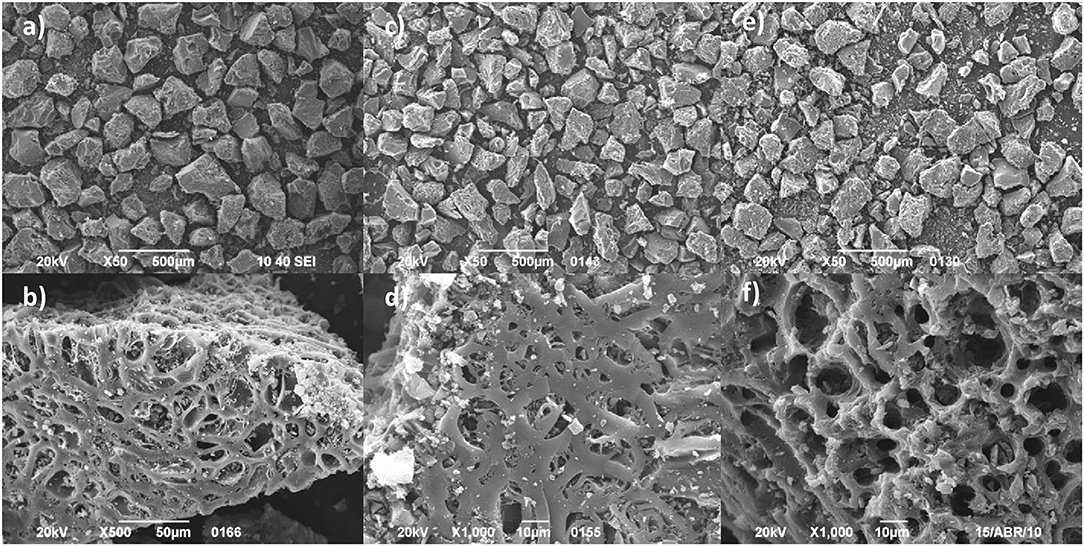
Figure 2. SEM images of (a,b) parent activated carbon, AC; (c,d) thermal treated activated carbon, AC-T, and (e,f) gasified activated carbon, AC-G.
The pore size distribution curves derived from the N2 isotherms have been obtained by NL-DFT (Jagiello and Olivier, 2013) and represented in Figure 1B. The DFT volumes from the integration of the PSDs are in agreement with the micropores and mesopores volumes obtained from t-method in Table 1. The PSD curves show a well-defined micropore distribution centered at 1.2 nm for AC with a long tail falling into the mesopore region, see inset of Figure 1B. In the case of AC-T, the shift of the PSD curve to smaller pore sizes (maximum moves to 1.0 nm) points out the shrinkage of the pore size of this sample. On AC-G, a similar shrinkage seems to take place (the same narrow peak centered at 1.0 nm is observed). However, the controlled gasification delivers the formation of wide micropores having an average size of 2 nm.
As for the mesopore distribution size, comparison between the PSD curves of AC and AC-T confirms the shrinkage of narrow and wide mesopores. This shrinkage is more pronounced in the 2–5 nm size range, what is probably related to the cleavage of polyphosphates bridges that produces the mesoporosity collapse. The mechanism of pore development during phosphoric acid activation of lignocellulosic biomass has been profusely described in the past and can be found elsewhere (Solum et al., 1995; Jagtoyen and Derbyshire, 1998; Rosas et al., 2009). On the contrary, gasification of AC proceeds with the development of mesopores with sizes averaging 13 nm, Figure 1B.
The surface chemistry of activated carbons has been analyzed by XPS and TPD. Table 2 shows the surface weight composition from XPS measurements, and Figure 3 details the P2p region of the XPS spectra recorded on the activated carbons. C1s and O1s XPS region as well as the deconvolution of the P2p spectrum are included in the supplementary file for the sake of brevity (Figures S1, S2 and Table S1). The binding energies of P species with different amount of C-O-P, C-P-O and C-P bonds available in the literature have been also marked by vertical lines in Figure 3 (Bedia et al., 2009; Rosas et al., 2012). The assignation of the XPS binding energies to the presence of these species has been discussed elsewhere (Puziy et al., 2006; Wu and Radovic, 2006; Rosas et al., 2009). A broad peak centered at 133.5 eV is observed in AC, suggesting that the pentavalent phosphorus prevails over the trivalent species (Moulder et al., 1995), what remains true no matter the treatment performed on it. The thermal treatment of AC delivers an increase in P content, Table 2, confirming that phosphorus is not lost from the surface of the activated carbon during thermal annealing, and only a minor increase in the presence of C-P-O bonds. Similar outcomes (i.e., reduced impact of thermal treatment in inert atmosphere) after thermal treatment of P-containing carbons can be found in our previous studies (Rosas et al., 2012; Berenguer et al., 2015; García-Mateos et al., 2015; Valero-Romero et al., 2017). Bulk P contents are in agreement with XPS determinations for AC and AC-G, while P seems to be more concentrated on the surface of AC-T (PXPS > Pbulk). The gasification of AC further increases both P and O content, and slightly shifts the spectrum to higher binding energy, pointing out that the P species distribution is moved toward the presence of more oxidized ones, of the like of C-O-PO3/(C-O)3-PO species, Figure S2 and Table S1.
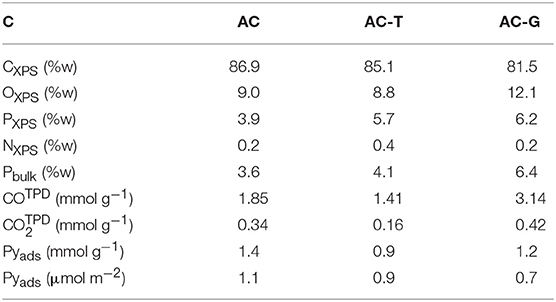
Table 2. Surface chemistry of the activated carbons.
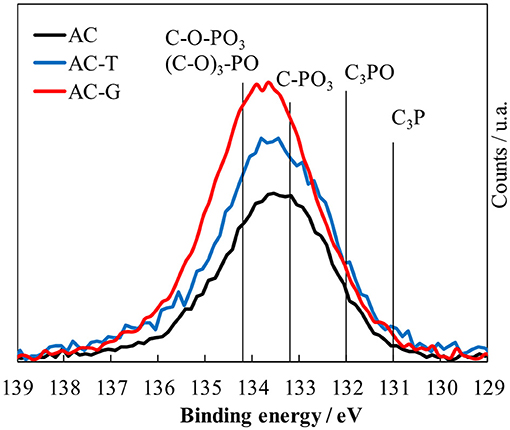
Figure 3. XPS P2p photoemission region of the activated carbons.
Table 2 compiles the amount of surface functional groups released as CO and CO2. CO2 evolution is traditionally related to the decomposition of surface oxygen groups with acid character, such as carboxylic acid at low temperatures and lactones and anhydrides at intermediate temperatures. The thermal treatment at 900°C removes most of these groups from the surface of AC-T, whereas the presence of oxygen during the preparation of AC-G induces the formation of CO2 evolving groups, see in Table 2. Attending to the release of CO2, AC should be the most acid activated carbon, followed by AC-G and finally by AC-T. When it is expressed in terms of surface area, AC-T would be slightly more acid than AC-G (0.23 μmol CO2 m−2 vs. 0.21 μmol CO2 m−2, respectively). On the other hand, the CO evolution originates from the presence of neutral or slightly basic groups, such as phenols at intermediate temperatures, and ether, quinones, and carbonyls at high temperatures. It is possible to see that AC-G has the largest amount of CO-type groups, followed by AC and finally by AC-T. In order to clarify the acidity of these carbons, we have utilized pyridine chemisorption method (Pyads, Table 2) that has been successfully applied for detailing the acidity of P-containing carbons serving as dehydration catalysts (Bedia et al., 2010c). Acidity was decreased after the thermal treatment, no matter the atmosphere. It is slightly higher for AC-G, although AC-T surpasses AC-G in terms of surface acidity (i.e., adsorbed pyridine divided by specific surface area). In general, oxidation treatments in air are known to deliver minor changes in surface acidity (Bandosz, 2008).
CO and CO2 TPD profiles are shown in Figure 4. In the CO profile, the main feature is the presence of a well-defined peak centered at temperatures around 850°C, Figure 4A. This CO evolution has been identified as the thermal decomposition of C-O-P groups, which releases CO (Rosas et al., 2009; Valero-Romero et al., 2017). The maximum of the peak is centered ca. 800°C in the case of AC and it is shifted to 860°C in AC-G and AC-T, reflecting the stabilizing effect of the benzene rings formed during thermal treatment (aromatic condensation reactions) on the C-C bonds that should be broken for the release of CO from the reduction of the C-O-P species. In the case of AC, additional release of small quantities of CO at temperatures from 500 to 750°C can be assigned to the presence of anhydrides (confirmed by the evolution of CO2 in a temperature range of 450–650°C, Figure 4B) and phenols/quinones (that decomposes in the form of CO at temperatures between 650 and 750°C) (Román-Martínez et al., 1993; Figueiredo et al., 1999; Boehm, 2002). Water evolution during TPD from 650 up to 900°C is also detected (H2O profiles not included for the sake of brevity), what has been proposed to be produced by the condensation of P-OH and saturated C atoms, forming C-P bonds (Valero-Romero et al., 2017). After the thermal treatment at 900°C under inert atmosphere, anhydrides and phenols/quinones are no longer observed, and most of the CO evolution found in sample AC-T is related to the presence of C-O-P species. We have already reported that the C-P bonds formed during the thermal treatment of P-containing activated carbons are prone to reoxidize at fast rate when they are again contacted with air, even at room temperature (Valero-Romero et al., 2017), what explains why the CO evolution related to the presence of C-O-P decomposition is seen in AC-T.
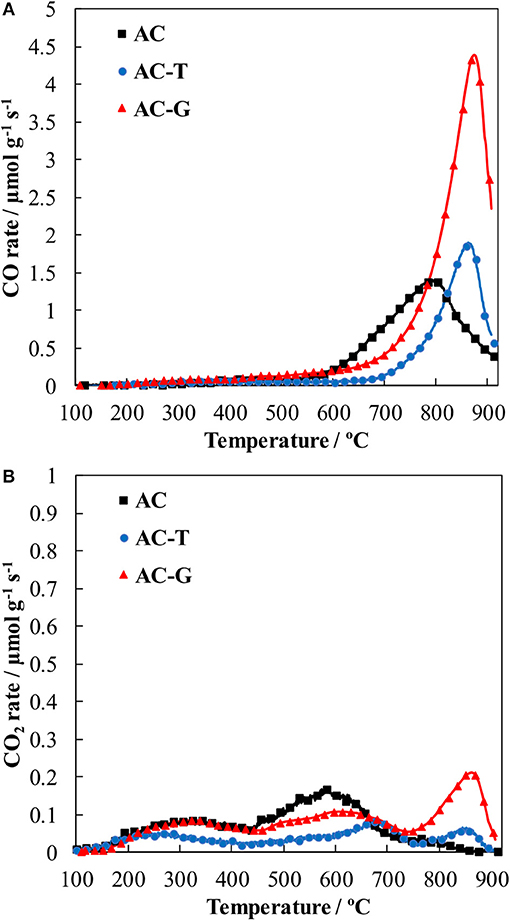
Figure 4. CO (A) and CO2 (B) TPD evolution profiles of the prepared activated carbons.
The C-O-P TPD related peaks at high temperature are notoriously increased in AC-G (red profiles in Figure 4), confirming the formation of larger numbers of C-O-P bonds in P groups. The amounts of CO and CO2 released at temperatures >700°C during TPD can be related to the amount of phosphorus on these activated carbons in order to gain knowledge of the number of C-O-P bonds on these carbons. Ratios of 1.15, 0.75 and 1.50 mmol OTPD mmol−1 PXPS (OTPD = COTPD+2·CO2, TPD) are obtained for AC, AC-T and AC-G, illustrating that P groups containing one C-O-P bond are more likely found in the former samples, while AC-G may contain P groups with one, two or even three C-O-P bonds. The O/P atomic ratios obtained from XPS for the same samples are 4.2 for AC, 2.8 for AC-T and 3.5 for AC, AC-T and AC-G, respectively. These ratios are higher than those of C-O-P bonds, pointing out that phosphorus can be also forming P = O bonds (and P-OH bonds in the case of AC, as pointed out by the thermal release of H2O at high temperatures) in all these samples.
Interestingly, a different porosity development was previously reported by our research group in the case of the gasification of a H3PO4-activated carbon prepared under similar conditions than AC (Rosas et al., 2012). In that work, mesoporosity was mostly destroyed after the gasification in air of AC until burn-off of 33%, while microporosity was preserved. These differences can be explained by the temperature chosen for the gasification. In the former work, the gasification of AC proceeded at 450°C for 3 h. At that temperature, C-O-P bonds are thermally stable, and gasification rate in air is noticeably hindered with respect to P-free activated carbons due to the slow rate of oxygen chemisorption and spillover over phosphorus groups and subsequent transfer to carbon free sites on the carbon structure. Differently, in this work gasification of AC takes place in diluted air in a non-isothermal heat treatment from room temperature up to 900°C. During the heating of the sample, oxidation of C-P to C-O-P bonds takes place (Rosas et al., 2012), while carbon gasification rate is much lower than before due to the low oxygen pressure. Once temperature surpasses 850°C, cleavage of C-O-P bonds takes part at fast rateline, with the release of CO2 (g) and the formation of a C'-P bonds, where C' refers to a carbon edge site formed on the loss of the carbon atom on CO2. C'-P bonds are highly reactive with oxygen, so that C'-O-P bonds are regenerated, enabling a new gasification circle on the carbon surface. Consequently, the gasification of AC is driven by the continuous reduction of phosphate groups by carbon and oxidation of the freshly formed phosphorane groups by oxygen. Since this redox cycle scavenges carbon atoms close to P species during the reduction step, new porosity is formed in a controlled way. This gasification mechanism is presented in Figure 5.
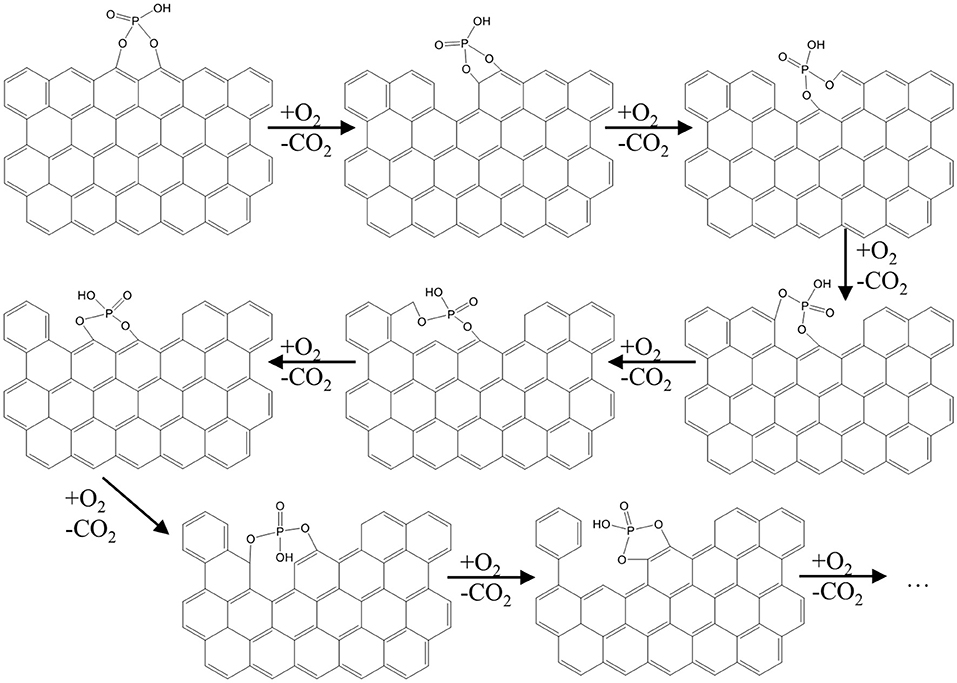
Figure 5. Scheme of a possible gasification mechanism of AC at 900°C.
Effect of Textural Properties and Surface Chemistry on Paracetamol Adsorption
PA adsorption on AC, AC-T, and AC-G has been studied in order to evaluate the effect of the adsorbent physico-chemical properties (See Table 1). The effect of pH ranging from 2 to 10 on the PA adsorption on several activated carbons was evaluated in a previous work, where we found it to be negligible (Cotoruelo et al., 2011), for what adsorption experiments herein reported have been performed at neutral pH. Figure 6 shows the PA adsorption equilibrium isotherms at 25°C. From these isotherms, it could be concluded the high ability of these carbon adsorbents to remove PA at very low equilibrium concentrations, obtaining large adsorption capacities even at 2 mg L−1. These adsorption isotherms could be classified as a type L of Giles (Giles et al., 1960). The experimental data are correctly described by the equation proposed by Langmuir, whose characteristic parameter values, qL (Langmuir monolayer adsorption capacity) and KL (Langmuir adsorption constant) are showed in Table 3.
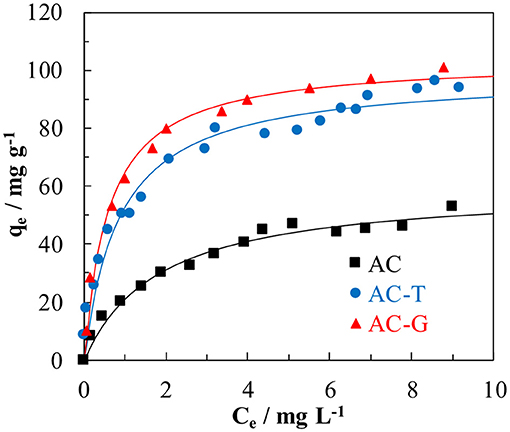
Figure 6. Paracetamol adsorption isotherm at 25°C on AC, AC-T, and AC-G (dots: experimental data; line: Langmuir fitting).
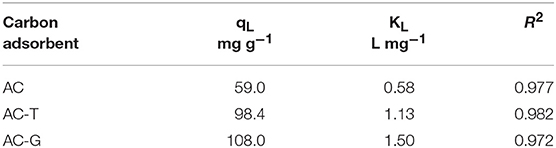
Table 3. Langmuir parameters for the paracetamol adsorption at 25°C on the different activated carbons.
The highest adsorption capacity is found for AC-G, followed by AC-T, with AC showing the lowest value. Although AC has a larger surface area than AC-T, a higher adsorption capacity was attained in AC-T. When qL values are normalized by SBET, adsorption capacities of 47.8, 99.9, and 61.7 μg m−2 are obtained for AC, AC-T and AC-G, respectively. It is known that the adsorption process has a strong relationship with surface area, but the dominant role of the surface chemistry in PA adsorption is out of the question. In this sense, AC-G shows the highest adsorption capacity, but it only shows a raise in PA adsorption of 10%, despite the increase in 77% of surface area (respect to AC-T). On the one hand, the structure of aromatic molecules, such as PA, is planar, and they show strong π- π dispersion interaction mechanism with basal planes, what increases the affinity of these molecules for the slit-shape, narrowest micropores of activated carbons (Moreno-Castilla, 2004; Rodríguez-Mirasol et al., 2005). The wide micropores developed on AC-G (see Figure 2b) do not match the size and shape for the optimum PA adsorption, what explains the minor impact of surface area. On the other hand, it has been known for a long time that increasing the acidity and the hydrophilicity of activated carbons decreases the amount of aromatic molecules adsorbed from aqueous solutions (Moreno-Castilla, 2004). More specifically, some authors have linked the PA adsorption capacity with the acidity of P-containing carbons (Wiśniewski et al., 2011). In this regard, a linear relationship between the Langmuir parameters and the specific acidity (determined as the ratio between the amount of chemisorbed pyridine and SBET) of these samples has been found, Figure 7. The agreement is especially relevant in the case of the affinity constant, KL, confirming that surface acidity governs the interaction between PA and the adsorbents.
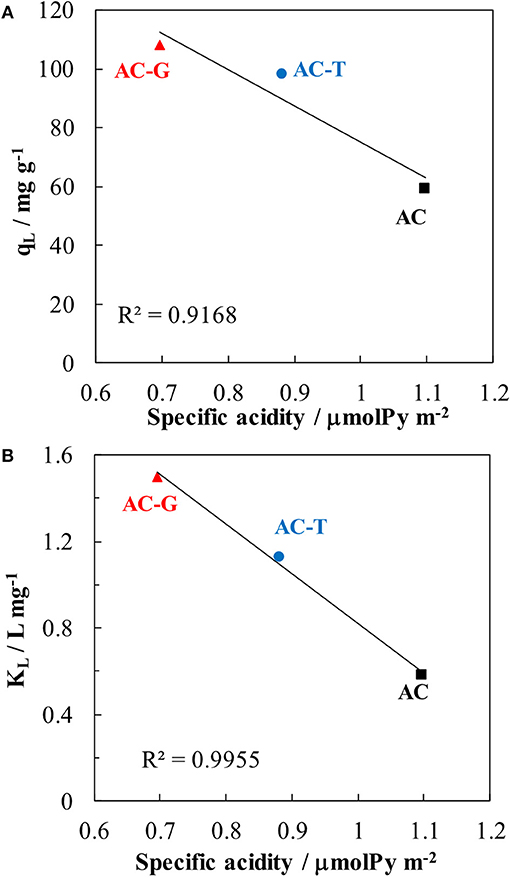
Figure 7. Relationship between paracetamol adsorption capacity and specific acidity (A) and paracetamol adsorption equilibrium constant and specific acidity (B).
The kinetic of PA adsorption results are shown in Figure 8, as well as the fitting results using the hyperbolic equation described in Equation 4. The fitting parameters are compiled in Table 3. The hyperbolic equation describes correctly the behavior of the experimental data, and the kinetic parameter, qm, related to the adsorption equilibrium capacity at infinite time is close, for all cases, to the equilibrium capacity, qe, calculated by Langmuir equation using Ctinfinite as equilibrium concentration. As in the equilibrium study, the maximum adsorption capacity was obtained for AC-G adsorbent.
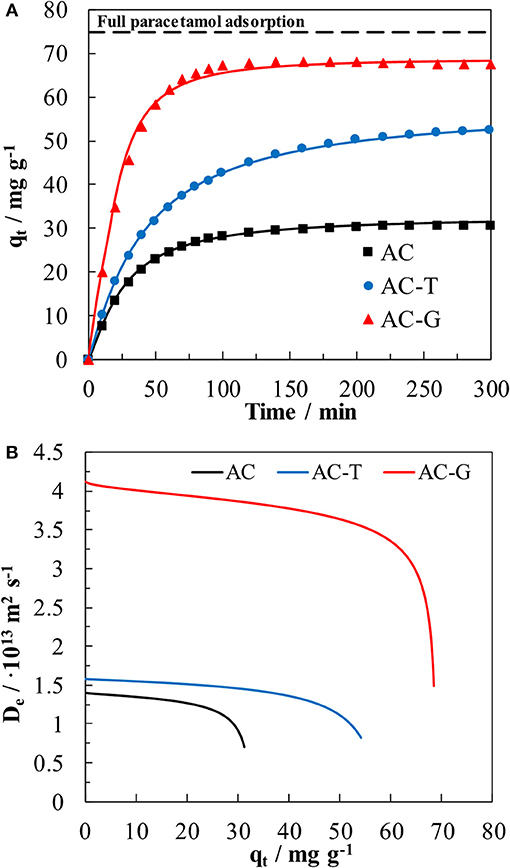
Figure 8. (A) Kinetic plots of paracetamol adsorption on AC, AC-T, and AC-G at 25°C. (C0 = 5 mg L−1; V = 150 mL; w = 100 mg L−1). Dots: experimental data, line: hyperbolic fitting. (B) Relationship between the heterogeneous effective diffusion coefficient with qt for the paracetamol adsorption on AC, AC-T, and AC-G derived from Equation (7).
Different steps are differenced in the kinetic adsorption process. At short times, the adsorption rate is faster in the adsorbent showing wider pores (AC and AC-G) owing to the external control of the adsorption process. At intermediate times, the diffusion process becomes internally controlled, with the volume and interconnectivity of mesopore and wide micropores governing the diffusion rate. At this point, the qt values for AC and AC-G reach near to constant value, an indicative of equilibrium being reached in short times owing to their well-developed meso- and micropore structure, Table 1, what increases the internal mass transfer rate of these samples. Contrarily, the heat treatment of AC-T brought a notable porosity shrinkage that reduced the mesoporosity and wide microporosity of this sample. In consequence, the adsorption rate becomes controlled by the diffusion process in the narrowest pores, which have a very slow diffusion rate, and long times are needed to reach the equilibrium for this adsorbent, as depicted in Figure 8.
In a previous work (García-Mateos et al., 2015), we defined an heterogeneous effective diffusion coefficient from the kinetic experiments that relies on the amount of adsorbed PA inside the carbon particle, q. A similar procedure has been applied in this work. The obtained parameters from the application of Equation 4 and 6 are compiled in Table 4, while the relationship between the heterogeneous diffusivity coefficient and qt has been plotted in Figure 8B. The diffusivity against qt plot corroborates the highest values of the diffusion coefficients are obtained by the carbon adsorbent with the largest porosity development (AC-G). Surprisingly, AC diffusivity coefficient values are lower than those of AC-T, in spite of the presence of a more opened porosity, Table 1. This unexpected result can be understood when it is considered that surface diffusion is the main mass transfer mechanism in activated carbons. Since AC shows the less compatible surface chemistry of the tested adsorbents (see the low KL value in Table 3), the surface diffusion rate is negatively impacted by the low affinity between PA and AC surface. Then, the mismatched surface chemistry overcomes the benefits of a well-developed porosity, rendering a large decrease of the effective diffusion coefficient. This result is in agreement with the findings by Błasinski and Kazmierczak (1984) concerning the decrease of surface diffusivity coefficient of p-nitrophenol with the increase of acidity of a series of adsorbents consisting in 14 activated carbons.
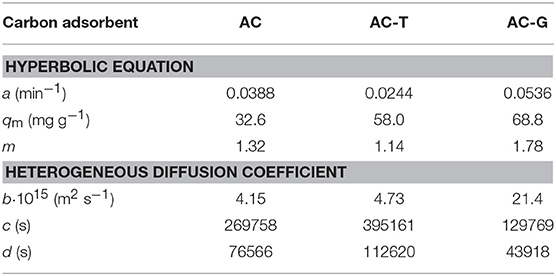
Table 4. Hyperbolic equation and heterogeneous diffusion coefficient parameters obtained from the kinetic study.
Figure 9 shows the breakthrough profiles of PA adsorption on the carbon adsorbents and their solution of the numerical model. All the breakthrough curves have the typical S-shaped curve for column operation with favorable adsorption isotherms (Ruthven, 1984). In those experiments, the value of the capacity adsorption can be determined from the area above the curve. From the breakthrough curves, the bed service time (BST) can be calculated as the time in which the outlet concentration is C/Ci = 0.05, where Ci is the concentration of PA in the inlet stream. Another critical parameter for determining the operation and the dynamic response of adsorption on activated carbon is the height of the mass transfer zone (HMTZ), being related to the shape of the curve. A short HMTZ means that most of the adsorption capacity of the carbon bed will be profited when BST is reached. Given that carbon beds have different height owing to the different carbon density, we have included the ratio HMTZ to bed length (HMTZ ) for each experiment. All the parameters related to the adsorption in column system are showed in Table 5.
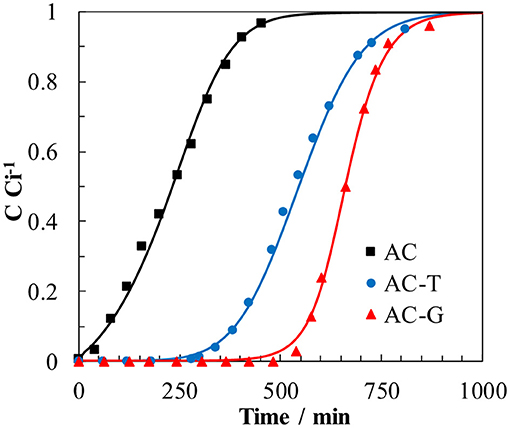
Figure 9. Breakthrough curves in column operation for paracetamol adsorption on AC, AC-T, and AC-G (W: 200 mg, Ci: 5 mg L−1, T: 25°C; Q = 6 mL min−1). Dots: experimental data; lines: prediction from the solution of the mass balance.
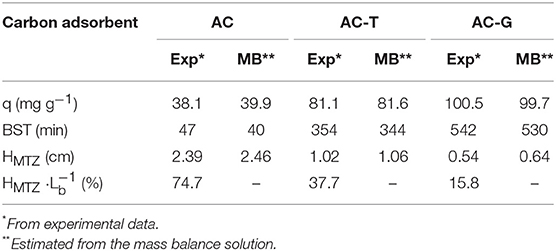
Table 5. Breakthrough profile parameters.
In our previous work (García-Mateos et al., 2015), we used the adsorption parameters obtained from batch experiences to predict the PA breakthrough curves on small-scale columns. The same approach has been herein implemented. Both the adsorption isotherm parameters obtained from Langmuir equation, Table 3, and the relationship between the heterogeneous effective diffusion coefficient and qt, obtained from Equation (7), are used to solve the mass balance for the adsorption column and for the carbon particles, Equations (8, 9). The good agreement between the predicted breakthrough profiles and the experimental ones in Figure 9 is worth mentioning. Similar good agreement is seen for the bed performance parameters compiled in Table 5, confirming the excellent accuracy provided by this procedure.
It is also remarkable that, in spite of showing only a difference of 23% in the amount of adsorbed PA in full saturation of the carbon bed (qt value on Table 5), the bed loaded with AC-G shows a BST 53% higher than its counterpart, AC-T. This is explained by the shorter HMTZ of AC-G. This result brings into light the importance of the gasification process in improving the mass transfer rate of the P-containing activated carbon, what have been achieved without increasing the surface acidity of the sample (i.e., maintaining a high PA affinity for the surface of AC-G, the activated carbon with the highest value of KL in Table 3). Moreover, the preponderance of surface chemistry over the porosity in PA adsorption on activated carbons is clearly illustrated by the poor AC performance. Even though it would be expectable a higher mass transfer rate in AC owing to its more opened porosity, the low affinity of paracetamol for the surface chemistry of AC sample greatly impedes its adsorption, what hinders the effective surface diffusion rate of this adsorbent. In consequence, mass transfer zone of the bed is much larger than for AC-T, and the BST is severely decreased.
Finally, volumetric capacities (i.e., weight of pollutant retained per volume of the adsorbent bed) are also of importance when designing adsorption columns. Thus, the density values from Table 1 have been employed for estimating the volumetric performance of AC-T and AC-G. In this sense, the highest PA saturation capacity in volumetric terms is obtained for AC-T, having 105 g per liter of adsorbent in contrast with the 98 g per liter showed by AC-G. Even with the advantage of being a denser solid, AC-T would still show a worse BST than AC-G when working at the same column height owing to the equivalent BST of AC-G being 377 min, which is 10% larger than that of AC-T.
Conclusions
P-containing activated carbons have been prepared by chemical activation with H3PO4 of olive stones at 500°C using an impregnation ratio of 3:1 (parent carbon AC), followed by thermal treatment under inert atmosphere at 900°C (AC-T) or by gasification in diluted air at the same temperature (AC-G). AC-T shows a decrease of SBET of 20%, as well as large porosity shrinkage, loss of oxygen functional groups, decrease of the number of C-O-P species and acidity. On the other hand, microporosity and mesoporosity of AC-G increases 40 and 70%, respectively, while an increase on the quantities of C-O-P species, loss of oxygen functional groups and a lower specific acidity are observed. Controlled gasification by using diluted air at such high temperature has been possible only due to the presence of P groups, which governs the gasification rate and mechanism of these P-containing carbons.
These activated carbons have been used as adsorbents of a model micropollutant, i.e., paracetamol. They all show Langmuir type isotherms and adsorption capacities from 55 to 105 mg g−1 at 10 mg L−1. In spite of the large meso- and micropore volumes of the P-containing activated carbon prepared at 500°C, it turns out that adsorption capacity determined in batch experiments is the lowest one, and the adsorption kinetic rate is lower than that of the carbon showing the narrowest pore size distribution, AC-T. This outcome suggests a low affinity between the surface of AC and paracetamol, as pointed out by the low value of the adsorption constant. In addition, the Langmuir adsorption constant and saturation adsorption capacity are linearly related to the surface acidity of the activated carbons. Even though the main micropore size of AC-G does not match the optimum pore size for improving the adsorption of aromatic molecules, it shows the best performance in column adsorption (largest BST and shorter HMTZ) owing to the combination of adequate surface chemistry, large surface area and opened porosity.
In summary, this study provides evidences of the key role played by surface chemistry on the applicability of P-containing activated carbon as adsorbents, and how gasification in diluted air at high temperature produces the most interesting combination of surface chemistry and porosity properties that enhances the performance of such activated carbons for adsorption applications.
Data Availability
The datasets generated for this study are available on request to the corresponding author.
Author Contributions
RR-R and FG-M synthesized the materials and with MG prepared the manuscript. Adsorption experiments were performed by FG-M. RR-R performed the characterization of samples and the discussion of the results. JR-M and TC developed the synthesis concept and the adsorption experiments. All authors discussed the result and commented on the manuscript.
Conflict of Interest Statement
The authors declare that the research was conducted in the absence of any commercial or financial relationships that could be construed as a potential conflict of interest.
Acknowledgments
This work was supported by the Spanish Ministry of Economy and Competitiveness and FEDER (CTQ2015-68654-R). MCGM gratefully acknowledges the assistance of Spanish Ministry of Economy and Competitiveness through a Juan de la Cierva–Formación fellowship (FJCI-2015-25788).
Supplementary Material
The Supplementary Material for this article can be found online at: https://www.frontiersin.org/articles/10.3389/fmats.2019.00134/full#supplementary-material
References
Aktaş, Ö., and Ferhan, Ç. (2012). Fundamentals of adsorption onto activated carbon in water and wastewater treatment, in Activated Carbon for Wastewater Treatment: Integration of Adsorption and Biological Treatment (Weinheim: WILEY-VCH Verlag GmbH & Co. KGaA), 13–42. doi: 10.1002/9783527639441.ch2
Bandosz, T. J. (2008). Surface chemistry of carbon materials, in Carbon Materials for Catalysis, eds P. Serp and J. L. Figueiredo (Hoboken, NJ: John Wiley & Sons, Inc.), 45–92.
Bansal, R. C., and Goyal, M. (2005). Activated Carbon Adsorption. Boca Raton, FL: Taylor & Francis. doi: 10.1201/9781420028812
Bedia, J., Rosas, J. M., Márquez, J., Rodríguez-Mirasol, J., and Cordero, T. (2009). Preparation and characterization of carbon based acid catalysts for the dehydration of 2-propanol. Carbon 47, 286–294. doi: 10.1016/j.carbon.2008.10.008
Bedia, J., Rosas, J. M., Rodríguez-Mirasol, J., and Cordero, T. (2010a). Pd supported on mesoporous activated carbons with high oxidation resistance as catalysts for toluene oxidation. Appl. Catal. B Environ. 94, 8–18. doi: 10.1016/j.apcatb.2009.10.015
Bedia, J., Ruiz-Rosas, R., Rodríguez-Mirasol, J., and Cordero, T. (2010b). A kinetic study of 2-propanol dehydration on carbon acid catalysts. J. Catal. 271, 33–42. doi: 10.1016/j.jcat.2010.01.023
Bedia, J., Ruiz-Rosas, R., Rodríguez-Mirasol, J., and Cordero, T. (2010c). Kinetic study of the decomposition of 2-butanol on carbon-based acid catalyst. AIChE J. 56, 1557–1568. doi: 10.1002/aic.12056
Berenguer, R., Ruiz-Rosas, R., Gallardo, A., Cazorla-Amorós, D., Morallón, E., Nishihara, H., et al. (2015). Enhanced electro-oxidation resistance of carbon electrodes induced by phosphorus surface groups. Carbon 95, 681–689. doi: 10.1016/j.carbon.2015.08.101
Bhatnagar, A., Hogland, W., Marques, M., and Sillanpää, M. (2013). An overview of the modification methods of activated carbon for its water treatment applications. Chem. Eng. J. 219, 499–511. doi: 10.1016/j.cej.2012.12.038
Błasinski, H., and Kazmierczak, J. (1984). Surface diffusion on active carbon in adsorption from solutions. Chem. Eng. Commun. 25, 351–361. doi: 10.1080/00986448408940116
Boehler, M., Zwickenpflug, B., Hollender, J., Ternes, T., Joss, A., and Siegrist, H. (2012). Removal of micropollutants in municipal wastewater treatment plants by powder-activated carbon. Water Sci. Technol. 66, 2115–2121. doi: 10.2166/wst.2012.353
Boehm, H. P. (2002). Surface oxides on carbon and their analysis: a critical assessment. Carbon 40, 145–149. doi: 10.1016/S0008-6223(01)00165-8
Castro, J. B., Bonelli, P. R., Cerrella, E. G., and Cukierman, A. L. (2000). Phosphoric acid activation of agricultural residues and bagasse from sugar cane: influence of the experimental conditions on adsorption characteristics of activated carbons. Ind. Eng. Chem. Res. 39, 4166–4172. doi: 10.1021/ie0002677
Cazorla-Amorós, D., Alcañiz-Monge, J., de la Casa-Lillo, M. A., and Linares-Solano, A. (1998). CO2 As an adsorptive to characterize carbon molecular sieves and activated carbons. Langmuir 14, 4589–4596. doi: 10.1021/la980198p
Cazorla-Amorós, D., Alcañiz-Monge, J., and Linares-Solano, A. (1996). Characterization of activated carbon fibers by CO2 adsorption. Langmuir 12, 2820–2824. doi: 10.1021/la960022s
Cotoruelo, L. M., Marqués, M. D., Leiva, A., Rodríguez-Mirasol, J., and Cordero, T. (2011). Adsorption of oxygen-containing aromatics used in petrochemical, pharmaceutical and food industries by means of lignin based active carbons. Adsorption 17, 539–550. doi: 10.1007/s10450-010-9319-x
Cotoruelo, L. M., Marqués, M. D., Rodríguez-Mirasol, J., Rodríguez, J. J., and Cordero, T. (2009). Lignin-based activated carbons for adsorption of sodium dodecylbenzene sulfonate: equilibrium and kinetic studies. J. Colloid Interface Sci. 332, 39–45. doi: 10.1016/j.jcis.2008.12.031
Danish, M., and Ahmad, T. (2018). A review on utilization of wood biomass as a sustainable precursor for activated carbon production and application. Renew. Sustain. Energy Rev. 87, 1–21. doi: 10.1016/j.rser.2018.02.003
Duan, X., Srinivasakannan, C., Wang, X., Wang, F., and Liu, X. (2017). Synthesis of activated carbon fibers from cotton by microwave induced H3PO4activation. J. Taiwan Instit. Chem. Eng. 70, 374–381. doi: 10.1016/j.jtice.2016.10.036
Estrada-Arriaga, E. B., Cortés-Muñoz, J. E., González-Herrera, A., Calderón-Mólgora, C. G., de Lourdes Rivera-Huerta, M., Ramírez-Camperos, E., et al. (2016). Assessment of full-scale biological nutrient removal systems upgraded with physico-chemical processes for the removal of emerging pollutants present in wastewaters from Mexico. Sci. Total Environ. 571, 1172–1182. doi: 10.1016/j.scitotenv.2016.07.118
Figueiredo, J. L., Pereira, M. F. R., Freitas, M. M. A., and Órfão, J. J. M. (1999). Modification of the surface chemistry of activated carbons. Carbon 37, 1379–1389. doi: 10.1016/S0008-6223(98)00333-9
García-Mateos, F. J., Ruiz-Rosas, R., Marqués, M. D., Cotoruelo, L. M., Rodríguez-Mirasol, J., and Cordero, T. (2015). Removal of paracetamol on biomass-derived activated carbon: modeling the fixed bed breakthrough curves using batch adsorption experiments. Chemi. Eng. J. 279, 18–30. doi: 10.1016/j.cej.2015.04.144
Giles, C. H., MacEwan, T. H., Nakhwa, S. N., and Smith, D. (1960). 786. Studies in adsorption. Part XI. A system of classification of solution adsorption isotherms, and its use in diagnosis of adsorption mechanisms and in measurement of specific surface areas of solids. J. Chem. Soc. 1960, 3973–3993. doi: 10.1039/jr9600003973
Gonzalez-Serrano, E., Cordero, T., Rodriguez-Mirasol, J., Cotoruelo, L., and Rodriguez, J. J. (2004). Removal of water pollutants with activated carbons prepared from H3PO4 activation of lignin from kraft black liquors. Water Res. 38, 3043–3050. doi: 10.1016/j.watres.2004.04.048
Gonzalez-Serrano, E., Cordero, T., Rodríguez-Mirasol, J., and Rodríguez, J. J. (1997). Development of porosity upon chemical activation of kraft lignin with ZnCl2. Ind. Eng. Chem. Res. 36, 4832–4838. doi: 10.1021/ie970261q
Hita, I., Cordero-Lanzac, T., Gallardo, A., Arandes, J. M., Rodríguez-Mirasol, J., Bilbao, J., et al. (2016). Phosphorus-containing activated carbon as acid support in a bifunctional Pt–Pd catalyst for tire oil hydrocracking. Catal. Commun. 78, 48–51. doi: 10.1016/j.catcom.2016.01.035
Jagiello, J., and Olivier, J. P. (2013). 2D-NLDFT adsorption models for carbon slit-shaped pores with surface energetical heterogeneity and geometrical corrugation. Carbon 55, 70–80. doi: 10.1016/j.carbon.2012.12.011
Jagtoyen, M., and Derbyshire, F. (1998). Activated carbons from yellow poplar and white oak by H3PO4 activation. Carbon 36, 1085–1097. doi: 10.1016/S0008-6223(98)00082-7
Kiliç, M., Apaydin-Varol, E., and Pütün, A. E. (2012). Preparation and surface characterization of activated carbons from Euphorbia rigida by chemical activation with ZnCl2, K2CO3, NaOH and H3PO4. Appl. Surf. Sci. 261, 247–254. doi: 10.1016/j.apsusc.2012.07.155
Li, G., Bhosale, S., Tao, S., Bhosale, S., and Fuhrhop, J. H. (2005). Conducting polythiophenes with a broad spectrum of reactive groups. J. Polym. Sci. A Polym. Chem. 43, 4547–4558. doi: 10.1002/pola.20928
Li, S., Han, K., Li, J., Li, M., and Lu, C. (2017). Preparation and characterization of super activated carbon produced from gulfweed by KOH activation. Micropor. Mesopor. Mater. 243, 291–300. doi: 10.1016/j.micromeso.2017.02.052
López-González, J., de, D., Martínez-Vilchez, F., and Rodríguez-reinoso, F. (1980). Preparation and characterization of active carbons from olive stones. Carbon 18, 413–418. doi: 10.1016/0008-6223(80)90033-0
Luo, Y., Guo, W., Ngo, H. H., Nghiem, L. D., Hai, F. I., Zhang, J., et al. (2014). A review on the occurrence of micropollutants in the aquatic environment and their fate and removal during wastewater treatment. Sci. Total Environ. 473–474, 619–641. doi: 10.1016/j.scitotenv.2013.12.065
Mailler, R., Gasperi, J., Coquet, Y., Derome, C., Bulet,é, A., Vulliet, E., et al. (2016). Removal of emerging micropollutants from wastewater by activated carbon adsorption: experimental study of different activated carbons and factors influencing the adsorption of micropollutants in wastewater. J. Environ. Chem. Eng. 4, 1102–1109. doi: 10.1016/j.jece.2016.01.018
Márquez-Montesinos, F., Cordero, T., Rodríguez-Mirasol, J., and Rodríguez, J. (2001). Powdered activated carbons from Pinus caribaena sawdust. Sep. Sci. Technol. 36, 3191–3206. doi: 10.1081/SS-100107767
Marquez-Montesinos, F., Cordero, T., Rodriguez-Mirasol, J., and Rodriguez, J. J. (2002). CO2 and steam gasification of a grapefruit skin char. Fuel 81, 423–429. doi: 10.1016/S0016-2361(01)00174-0
Moreno-Castilla, C. (2004). Adsorption of organic molecules from aqueous solutions on carbon materials. Carbon 42, 83–94. doi: 10.1016/j.carbon.2003.09.022
Moulder, J. F., Stickle, W. F., Sobol, P. E., and Bomben, K. D. (1995). Handbook of X-ray Photoelectron Spectroscopy. Norwalk: PhysicalElectronics Division, Perkin-Elmer Corp.
Onesios, K. M., Yu, J. T., and Bouwer, E. J. (2009). Biodegradation and removal of pharmaceuticals and personal care products in treatment systems: a review. Biodegradation 20, 441–466. doi: 10.1007/s10532-008-9237-8
Palomo, J., Ternero-Hidalgo, J. J., Rosas, J. M., Rodríguez-Mirasol, J., and Cordero, T. (2017). Selective nitrogen functionalization of phosphorus-containing activated carbons. Fuel Process. Technol. 156, 438–445. doi: 10.1016/j.fuproc.2016.10.006
Petrie, B., Barden, R., and Kasprzyk-Hordern, B. (2014). A review on emerging contaminants in wastewaters and the environment: current knowledge, understudied areas and recommendations for future monitoring. Water Res. 72, 3–27. doi: 10.1016/j.watres.2014.08.053
Puziy, A. M., Poddubnaya, O. I., and Ziatdinov, A. M. (2006). On the chemical structure of phosphorus compounds in phosphoric acid-activated carbon. Appl. Surf. Sci. 252, 8036–8038. doi: 10.1016/j.apsusc.2005.10.044
Raghavan, N. S., and Ruthven, D. M. (1983). Numerical simulation of a fixed-bed adsorption column by the method of orthogonal collocation. AIChE J. 29, 922–925. doi: 10.1002/aic.690290608
Rivera-Utrilla, J., Sánchez-Polo, M., Gómez-Serrano, V., Álvarez, P. M., Alvim-Ferraz, M. C. M., and Dias, J. M. (2011). Activated carbon modifications to enhance its water treatment applications. An overview. J. Hazard. Mater. 187, 1–23. doi: 10.1016/j.jhazmat.2011.01.033
Rodríguez-Mirasol, J., Bedia, J., Cordero, T., and Rodríguez, J. J. (2005). Influence of water vapor on the adsorption of VOCs on lignin-based activated carbons. Sep. Sci. Technol. 40, 3113–3135. doi: 10.1080/01496390500385277
Rodríguez-Mirasol, J., Cordero, T., and Rodriguez, J. J. (1993). CO2-reactivity of eucalyptus kraft lignin chars. Carbon 31, 53–61. doi: 10.1016/0008-6223(93)90155-4
Rodríguez-Reinoso, F., Molina-Sabio, M., and González, M. T. (1995). The use of steam and CO2 as activating agents in the preparation of activated carbons. Carbon 33, 15–23. doi: 10.1016/0008-6223(94)00100-E
Román-Martínez, M. C., Cazorla-Amorós, D., Linares-Solano, A., and de Lecea, C. S.-M. (1993). Tpd and TPR characterization of carbonaceous supports and Pt/C catalysts. Carbon 31, 895–902. doi: 10.1016/0008-6223(93)90190-L
Rosas, J. M., Bedia, J., Rodríguez-Mirasol, J., and Cordero, T. (2009). HEMP-derived activated carbon fibers by chemical activation with phosphoric acid. Fuel 88, 19–26. doi: 10.1016/j.fuel.2008.08.004
Rosas, J. M., Bedia, J., Rodríguez-Mirasol, J., and Cordero, T. (2010). On the preparation and characterization of chars and activated carbons from orange skin. Fuel Process. Technol. 91, 1345–1354. doi: 10.1016/j.fuproc.2010.05.006
Rosas, J. M., Ruiz-Rosas, R., Rodríguez-Mirasol, J., and Cordero, T. (2012). Kinetic study of the oxidation resistance of phosphorus-containing activated carbons. Carbon 50, 1523–1537. doi: 10.1016/j.carbon.2011.11.030
Ruthven, D. M. (1984). Principles of Adsorption and Adsorption Processes. New York, NY: John Wiley & Sons.
Solum, M. S., Pugmire, R. J., Jagtoyen, M., and Derbyshire, F. (1995). Evolution of carbon structure in chemically activated wood. Carbon 33, 1247–1254. doi: 10.1016/0008-6223(95)00067-N
Tancredi, N., Cordero, T., Rodríguez-Mirasol, J., and Rodríguez, J. J. (1996). Activated carbons from Uruguayan eucalyptus wood. Fuel 75, 1701–1706. doi: 10.1016/S0016-2361(96)00168-8
Teodosiu, C., Gilca, A. F., Barjoveanu, G., and Fiore, S. (2018). Emerging pollutants removal through advanced drinking water treatment: a review on processes and environmental performances assessment. J. Clean. Prod. 197, 1210–1221. doi: 10.1016/j.jclepro.2018.06.247
Thommes, M., Kaneko, K., Neimark, A. V., Olivier, J. P., Rodriguez-Reinoso, F., Rouquerol, J., et al. (2015). Physisorption of gases, with special reference to the evaluation of surface area and pore size distribution (IUPAC Technical Report). Pure Appl. Chem. 87, 1051–1069. doi: 10.1515/pac-2014-1117
Valero-Romero, M. J., García-Mateos, F. J., Rodríguez-Mirasol, J., and Cordero, T. (2017). Role of surface phosphorus complexes on the oxidation of porous carbons. Fuel Process. Technol. 157, 116–126. doi: 10.1016/j.fuproc.2016.11.014
Vermeulen, T. (1953). Theory for irreversible and constant-pattern solid diffusion. Ind. Eng. Chem. 45, 1664–1670. doi: 10.1021/ie50524a025
Vernersson, T., Bonelli, P. R., Cerrella, E. G., and Cukierman, A. L. (2002). Arundo donax cane as a precursor for activated carbons preparation by phosphoric acid activation. Bioresour. Technol. 83, 95–104. doi: 10.1016/S0960-8524(01)00205-X
Wiśniewski, M., Pacholczyk, A., Terzyk, A. P., and Rychlicki, G. (2011). New phosphorus-containing spherical carbon adsorbents as promising materials in drug adsorption and release. J. Colloid Interface Sci. 354, 891–894. doi: 10.1016/j.jcis.2010.11.072
Keywords: activated carbon, adsorption, water treatment, micropollutant removal, surface chemistry, porosity
Citation: Ruiz-Rosas R, García-Mateos FJ, Gutiérrez MC, Rodríguez-Mirasol J and Cordero T (2019) About the Role of Porosity and Surface Chemistry of Phosphorus-Containing Activated Carbons in the Removal of Micropollutants. Front. Mater. 6:134. doi: 10.3389/fmats.2019.00134
Received: 15 February 2019; Accepted: 21 May 2019;
Published: 06 June 2019.
Edited by:
Wei Lv, Tsinghua University, ChinaReviewed by:
Ji-Jun Zou, Tianjin University, ChinaLeszek A. Czepirski, AGH University of Science and Technology, Poland
Copyright © 2019 Ruiz-Rosas, García-Mateos, Gutiérrez, Rodríguez-Mirasol and Cordero. This is an open-access article distributed under the terms of the Creative Commons Attribution License (CC BY). The use, distribution or reproduction in other forums is permitted, provided the original author(s) and the copyright owner(s) are credited and that the original publication in this journal is cited, in accordance with accepted academic practice. No use, distribution or reproduction is permitted which does not comply with these terms.
*Correspondence: Ramiro Ruiz-Rosas, cmFtaXJvQHVtYS5lcw==