 Courtney Calahoo1*
 Jelena Petrovic1
 Quyen Huyen Le1Ulrike Werner-Zwanziger2Josef Zwanziger2
 Lothar Wondraczek1*
- 1Otto Schott Institute of Materials Research, University of Jena, Jena, Germany
- 2Department of Chemistry, Dalhousie University, Halifax, NS, Canada
Structural heterogeneity is a common feature of all glasses, however, little is known about the underlying contributions of chemical fluctuations and modulations in free volume in concrete glass forming systems. In this investigation, we relate the dynamics of structural relaxation of (100-x)NaPO3-xAlF3 glasses to their heterogeneous structure as determined from multinuclear magnetic resonance spectroscopic analysis. For this, we evaluate differential scanning calorimetry (DSC) data using the integral isoconversional method to determine the variation in activation energy, Ea, of the glass transition as a function of temperature and conversion progress. Specific heat measurements from DSC allow for the determination of the effective size of the cooperatively rearranging region (CRR). From 31P, 19F, and 27Al NMR, we observe that the introduction of AlF3 into the NaPO3 network increases the average connectivity (i.e., the number of heteronuclear Al—O—P bonds), rationalizing the higher Ea determined from the DSC measurements. We find highly constrained regions of Al(OP)4F2 with Al—F—Al cross-linking (high Ea) and, simultaneously, more flexible regions of phosphate chains containing P—F··(Na+)n bonds (low Ea); this results in a topologically and dynamically heterogeneous structure as evidenced by the increased variability in Ea with higher AlF3 content. The decreasing size of the CRR reflects the increased heterogeneity: at low AlF3 the CRR is large, while at high AlF3 (high heterogeneity), the CRR is significantly smaller (by a factor of 103). Finally, we relate the heterogeneity to other macroscopic properties, such as Tg and mechanical properties.
Introduction
The non-equilibrium structure of glass becomes evident in the relaxation dynamics. Relaxation can occur while heating through the glass transition, or during annealing below the glass transition temperature (physical aging; Vyazovkin, 2015). Since the kinetics of structural relaxation are indicative of molecular mobility and therefore, glass stability, studying the dynamics near the glass transition is of importance for the characterization and fundamental understanding of physical and chemical properties (Greaves and Sen, 2007).
Since the glass is frozen dynamically, the transition preserves the heterogeneity of the liquid state, typically manifest in density fluctuations on the scale of a few nanometers (Ediger, 2000). Macroscopic consequences of structural heterogeneity are found in, e.g., ion mobility (Greaves and Ngai, 1995), mechanical behavior (Benzine et al., 2018), crystallization (Moesgaard et al., 2010; Zhang et al., 2013), or Rayleigh scattering (Champagnon et al., 2009). During re-annealing of the glass, structural relaxation occurs toward a supercooled liquid via the cooperative motion of ions and molecules (Greaves and Sen, 2007). This process is typically known as α-relaxation; it is characterized by high activation energy (typically hundreds of kilojoules per mole) and stands in contrast to the movement of individual ions, atoms, or molecules (β relaxation). Molecules which are located in highly correlated regions can move only cooperatively, i.e., together with a large number of neighbors, while the molecules in less crowded areas are able to move in a less cooperative manner. The rearrangement of one molecule is only possible if a certain number (Nξ) of neighbor molecules also move (Donth, 2001). According to Adam and Gibbs (Adam and Gibbs, 1965), a cooperatively rearranging region (CRR) is defined as a subsystem which, due to thermal fluctuations, can rearrange into another configuration independent of its environment. When the glass relaxes toward the liquid, the overall process generally occurs via convolution of multiple more or less cooperative reactions of structural rearrangement. However, one particular mechanism may dominate the relaxation, depending on temperature or relaxation progress (Vyazovkin, 2015). Near to the glass transition temperature (Tg), structural heterogeneity occurs on the order of a few nanometers in diameter (Duval et al., 2007).
According to the heterogeneous nature of the glass transition, the traditional concept of a constant activation energy [which has already been criticized from a physical point of view (Garn, 1990)] is ill-suited for glass transition kinetics: Garn (1990) has pointed out that a constant activation energy is strictly applicable only to reactions that take place in homogeneous media. In the case of an extremely heterogeneous, hyperquenched CaO-MgO-SiO2 glass, DSC showed the existence of two separate sub-Tg relaxation peaks corresponding to two dynamically, structurally and energetically different domains (Zhang et al., 2013). However, even for a single-step reaction, the temperature dependence of the physical properties gives rise to variations in energy barrier height and, thus, the activation energy (Vyazovkin, 2016). As a consequence, the glass transition process is represented by a distribution of the activation energies (Moeller et al., 2006). For non-isothermal kinetic analyses, model-fits, and model-free methods are usually employed, whereby model fits are often ambiguous in terms of attributing a given reaction mechanism. For this reason, model-free evaluation routines can be used, such as the isoconversional method which allows for the determination of the effective activation energy as a function of conversion progress without assuming any particular form of the reaction mechanism (Vyazovkin, 2006).
The various isoconversional methods which are available for the evaluation of differential scanning calorimetric data can be distinguished into two groups: Differential isoconversional methods such as proposed by Friedman (2007) typically yield sufficiently accurate values of the effective activation energy, however, they are sensitive to noise in the raw data (Vyazovkin, 2016). Alternatively, integral isoconversional methods (Ozawa, 1965; Flynn and Wall, 1966; Vyazovkin, 2001, 2015) are significantly less sensitive to noise in the raw data; consequently, they are the most commonly used model-free methods for calculation of the variable activation energy. Common to both groups of methods, they do not yield the reaction model nor the pre-exponential factor. In order to interpret the obtained varying activation energy, a rational must be found from supporting mechanistic data.
Here, we report on the calorimetric investigation of the structural relaxation in fluoride-phosphate mixed-anion glasses of the type (100-x)NaPO3 – xAlF3 (NAPF) using the integral isoconversional method. In those glasses, large amounts of aluminum fluoride can be dissolved (Brow, 1992; Zhang et al., 2007; Le et al., 2017; Bradtmüller et al., 2018). The simultaneous formation of strong Al—O—P bonds and weaker terminal Al—F or P—F bonds reported (Brow, 1992) makes the NAPF system an interesting candidate for studying structural heterogeneity; there are highly constrained, strongly bonded regions (bridging O or F) interspersed among more flexible, less-constrained regions (NBOs or terminal F).
For rationalizing the observation of variable activation energy at the glass transition, we conduct complementary structural investigations of both glass former and anion mixing, using 31P, 27Al, and 19F MAS NMR. From DSC analysis, we interpret the variations in activation energy in terms of chemical composition, i.e., changes in dominant intermolecular interactions. Assuming that the activation energy reflects the cooperative dynamics of the glass transition, we examine the activation energy variability as a function of CRR volume. Finally, we relate the distribution of activation energies and average CRR volume to the degree of structural heterogeneity within the glass as determined by NMR.
Materials and Methods
In Table 1 the melting conditions and nominal compositions of the fluorophosphate glasses of this study (NAPF: (100-x)NaPO3 – xAlF3) are given; glasses were prepared using optical-grade raw materials of NaPO3 and AlF3. We used platinum crucibles to melt batches of 100 g in a muffle furnace for 1.5 h at 850–1,000°C, followed by homogenization for 2 h at 1,000–1,100°C. Melts were cast into preheated graphite molds and annealed at Tg+ 50° C for 4 h before cooling to room temperature at a rate of about 3–5 K/min. Due to planned NMR experiments, glasses were prepared with a small addition of CuO, 0.2 wt% (where CuO reduces relaxation times), and all types of measurements were made on these doped glasses. As has been thoroughly explored by Möncke et al. (2018), the loss of fluorine at high melting temperatures (>850°C) is a common problem; as such, we expect that the actual fluorine content is significantly lower than the reported nominal values. All the same, in a binary series such as this, our current and past results indicate a step-wise increase in AlF3 content (Le et al., 2017).
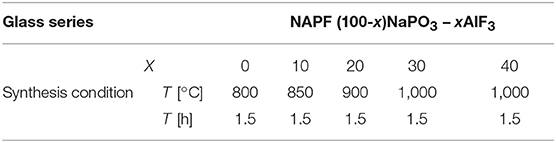
Table 1. Nominal compositions (mol %) and synthesis conditions for NAPF glass series.
NMR Experiments
The 31P NMR spectra were collected routinely and the experimental parameters are reported in our previous paper (Le et al., 2017). The 27Al ssNMR experiments were conducted on a Bruker Avance NMR spectrometer with a 16.45 T magnet (182.46 MHz 27Al NMR Larmor frequency) using our H-F/C-P probe head for rotors of 2.5 mm diameter. The 27Al NMR chemical shift scale was referenced externally against potassium alum at −0.033 ppm as a secondary reference. The 27Al MAS NMR spectra were acquired after a single 0.31 μs pulse (10 degree pulse angle) at 25.00 kHz sample spinning with 0.2 s repetition times accumulating between 1,024 and 4,096 scans depending on the AlF3 concentration. The short pulse was used to produce quantifiable spectra on quadrupolar nuclei. A spectrum of an empty rotor acquired under identical conditions but summing 18,000 scans characterized the 27Al background signal. This spectrum was subtracted from the sample 27Al NMR spectra after accounting for the different scan numbers accumulated. The chosen chemical shift ranges for integration of aluminum coordinations are the following: Al[4] (29–60 ppm); Al[5] (5–29 ppm); and Al[6] (−63 – 5 ppm).
The 19F ssNMR experiments were acquired on a Bruker DSX Avance NMR spectrometer with a 9.4 T magnet (400 MHz 1H, and 376.60 MHz 19F NMR Larmor frequencies) using our H-F/C-P probe head for rotors of 2.5 mm diameter. The 19F NMR chemical shift scale was referenced against Teflon at −123.2 ppm as a secondary reference relative to CFCl3 (MacKenzie and Smith, 2002). The 19F MAS NMR spectra were acquired with a Hahn-echo sequence (π/2 – τ – π – acquire) with π /2 and π pulse durations of 8.5 and 17 μs, respectively. The echo delay τ was synchronized to one spinner rotation at 25, 23 and 19 kHz MAS spinning frequency (τ = 40, 43, 52.6 μs, respectively). Spin lattice relaxation times, T1, were estimated from the 0-crossings of an inversion-recovery experiment with Hahn-Echo detection. The samples were acquired with recycle delays between 5 and 8.4 s equal to or exceeding five times the estimated spin lattice relaxation times, which were shortened by the copper doping. Between 16 and 256 scans were accumulated depending on the 19F content. The absence of noteworthy background signal was confirmed on the 19F MAS NMR spectrum of an empty rotor acquired under identical conditions.
Chemical Shielding Calculations
Calculations of the F-19 chemical shieldings were performed using the VASP code (Kresse and Furthmüller, 1996), an implementation of density functional theory using a plane wave basis, periodic boundary conditions, and the projector augmented wave formalism (PAW) (Kresse and Joubert, 1999). The PAW data sets used were those supplied with VASP as the 5.4 release, using the Perdew-Burke-Ernzerhof (PBE) exchange and correlation functional (Perdew et al., 1996). The valence spaces were as follows: F, 2s22p5; Al, 3s23p; Na, 2s22p63s; O, 2s22p4; P, 3s23p3. A 700 eV plane wave energy cut-off was used, and a k point mesh spacing of about 0.02 Å−1. These values were found to be sufficient to converge the shieldings to better than 1 ppm, in these wide band-gap systems. The shieldings themselves were computed using the gauge-including PAW method (GIPAW, Pickard and Mauri, 2001) as implemented in VASP, in which the electron current due to an external magnetic field is computed to first order in density functional perturbation theory and then used to calculate the nuclear magnetic shieldings.
DSC Measurements
Both, specific heat capacity and non-isothermal DSC, measurements were conducted on a Netzsch STA 449 F3 Jupiter equipped with DSC sample holders. Samples were in a bulk form with mass of around 30 mg and one polished surface in order to ensure good contact with the bottom of the employed platinum crucibles and, hence, the thermal sensor. Each measurement was done in inert atmosphere of N2 with a flow rate of 20 ml/min. Temperature and heat flow calibrations were done for all heating/cooling rates used in this investigation.
In order to erase the initial thermal history, each glass sample was first heated to a temperature of C, held for 2 min and then cooled down to 60°C at a rate of 20 K/min. The actual DSC scan was subsequently conducted under constant heating rates of 5, 10, 15, and 20 K/min, respectively, up to a peak temperature of , followed by cooling back to room temperature at 20 K/min. Each full measurement consisted of two such runs under equivalent conditions. Thereby, the first run was a blank run, with both sample and reference crucibles empty, while the second run had the reference crucible empty and the glass sample in the sample crucible. The temperature program for each run consisted of two subsequent heating and cooling cycles with the same heating/cooling rates. This procedure resulted in four DSC curves per sample, recorded for four different heating rates (5, 10, 15, and 20 K/min).
Specific heat capacity measurements were done in accordance with previous studies (Wondraczek and Behrens, 2007; Wondraczek et al., 2007), using a sapphire crystal as bulk reference material. The specific program consisted of starting at room temperature, then heating up to 40°C, holding for 30 min to equalize the temperature on the samples and furnace, then heating up to with a heating rate of 20 K/min, holding at for another 30 min and finally cooling back to room temperature.
Results
Structure Determination
In order to understand the thermal relaxation processes, the glass structure was analyzed by 31P, 19F, and 27Al MAS NMR. Although the 31P NMR spectra have partially been reported elsewhere (Le et al., 2017), we believe the analysis to be pertinent to the discussion here. As shown in Figure 1, the 31P NMR spectrum of pure NaPO3 is dominated by the expected single peak at ~-20 ppm (assigned as Q20Al) with a small contribution near −8 ppm (Q10Al). Upon the introduction of 10 mol% AlF3, two new peaks appear; a peak upfield of each the Q10Al and Q20Al peaks at −14 and −26 ppm, respectively. Given that aluminum is an intermediate glass former and similar literature (Le et al., 2017), we assign these new peaks to Q11Al and Q21Al, respectively. In this paper, we follow the terminology used by Bradtmüller et al. (2018): Qnm notation is the typical Qn notation, with n being the number of homonuclear phosphate bonds and m being the number of aluminum neighbors, whereas in the Pqm notation, q refers to number of total bridging oxygens (P or Al). For the 10 and 20 mol% AlF3, the peaks with one aluminum neighbor (Q11Al and Q21Al) grow in at the expense of the Q10Al and Q20Al peaks, and commensurately with the amount of AlF3 in the glass.
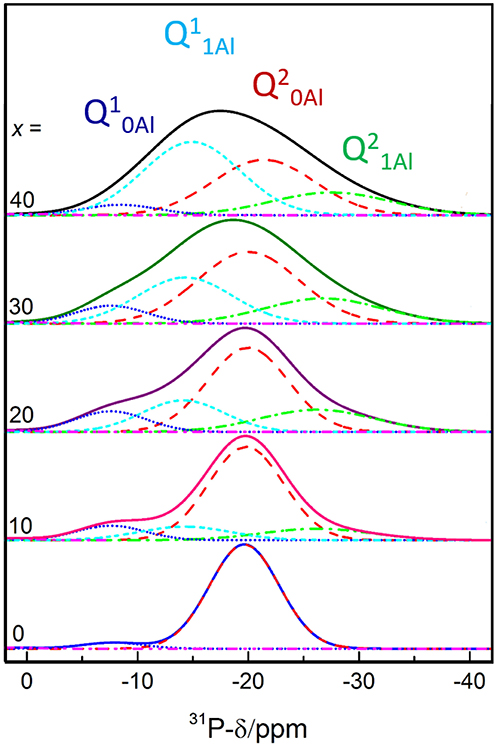
Figure 1. 31P MAS NMR spectra deconvolutions. Modified and reproduced from Le et al. (2017).
Figure 2 displays clearly the evolution of the species with increased AlF3. For compositions with ≥ 30 mol% AlF3, a structural change occurs, where now additional AlF3 results in the formation of Q11Al species only, with Q21Al species remaining constant (Q10Al and Q20Al continue to decrease). Although the four peaks overlap, the area fractions show the expected monotonic exchange between the Qn species with and without aluminum neighbors. Moreover, the trends match those of Bradtmüller et al. (2018) found for the same glass series, including the increase and then subsequent decrease of the Q10Al species. The exact fitting 31P NMR parameters can be found in Table 2.
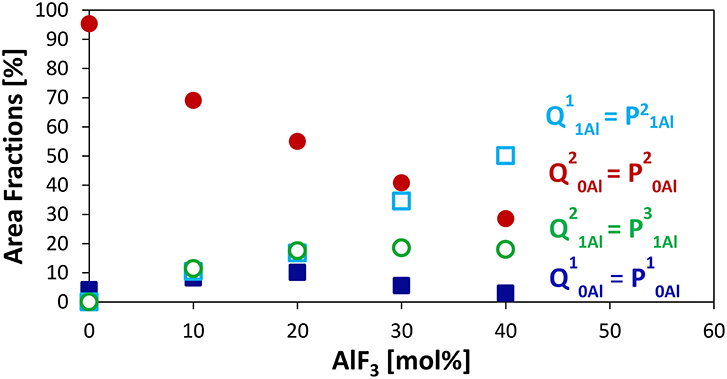
Figure 2. Area Fractions of phosphate Qnm species (n = number of P neighbors, m = number of Al neighbors) or Pqm (q refers to number of total bridging oxygens, P or Al) from 31P MAS NMR.
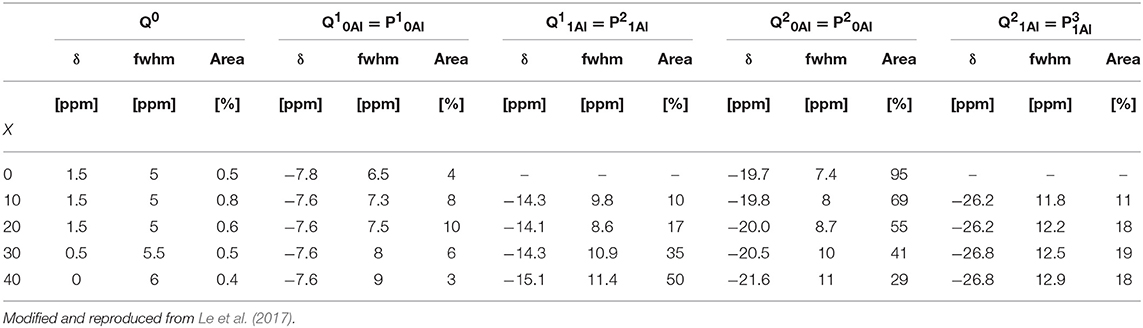
Table 2. 31P NMR shifts NMR parameters of (100-x)NaPO3 – xAlF3 series.
The major advantage of using the (q refers to number of total bridging oxygens, P or Al) notation is that we can monitor the connectivity changes in the glass; we observe that although the homonuclear Qn species, i.e., P—O—P bonds, are decreasing, they are being replaced with equal amounts of heteronuclear P—O—Al bonds. For example, when 10–20 mol% AlF3 is present in the glass, P20Al is being replaced with roughly equal amounts of P10Al, P21Al, and , summing to only small changes in the number of bridging oxygens connected to the phosphate network. For >30 mol% of AlF3, P20Al tetrahedra are being replaced with more species than P10Al (we are ignoring the increase in P21Al, since number of BO is the same). Consequently, the total number of bridging oxygens per phosphate tetrahedron is actually increasing for ≥ 30 mol% AlF3.
The 19F NMR spectra in Figure 3 reveal three types of fluorine in the glass, i.e., terminal phosphorus-bound [P—F··(Na+)n], bridging Al—F—Al, and terminal aluminum-bound [Al—F··(Na+)n] found at −75, −148, and −172 ppm, respectively. The assignments are based on NMR studies of similar glass systems and double resonance NMR experiments, which showed a lack of Al—F—P bonds (Le et al., 2017; Bradtmüller et al., 2018). These assignments are validated further by calculated 19F NMR chemical shifts for various crystalline compounds (Table 3). These calculations reveal that both Na+ neighbors and phosphate next-nearest neighbors change the 19F chemical shifts of pure AlF3 significantly: sodium coordination changes the 19F chemical shift from −172 ppm (Al—F—Al) in crystalline AlF3 to −191 ppm for terminal Al—F··(Na+)2, in Na3AlF6. Yet the further addition of phosphate moves the 19F shift back to −170 ppm for terminal Al—F··(Na+)4 in Na5AlF2(PO4)2 and back to −147 ppm for bridging Al—F—Al with 1 Na+ neighbor, in NaAlFPO4. The lack of intensity in the 19F spectra at −191 ppm, the computed chemical shift of Na3AlF6, indicates that no “islands” of Al, F, and Na exist; the chemical shifts found in these glasses correspond to crystals containing phosphate. Also, these shifts indicate that fluorine is always associated with at least one sodium, even bridging fluorines, which may indicate a preference for F··(Na+)n association.
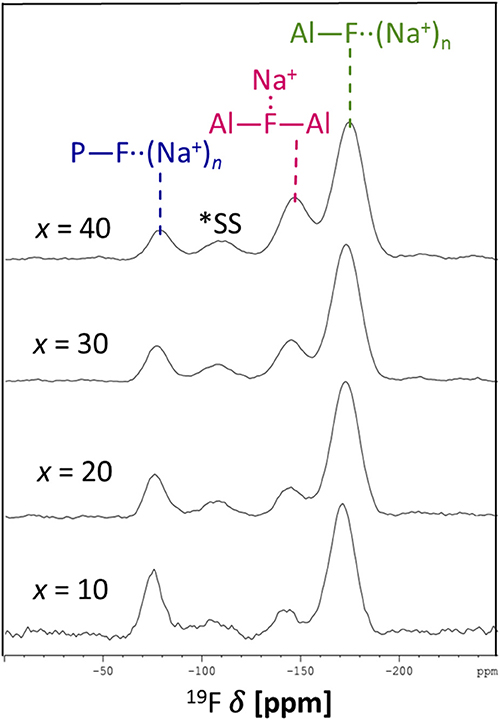
Figure 3. 19F MAS NMR of (100-x)NaPO3 – xAlF3 series.
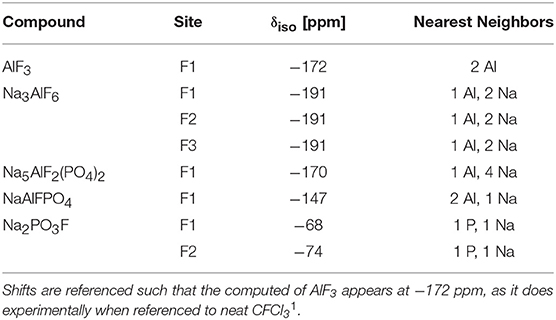
Table 3. Computed 19F shifts in various crystal models.
19F NMR spectra collected at three different MAS spinning speeds were fitted using the dmfit program (Massiot et al., 2002), accounting for the respective spinning sidebands and their results are given in Tables 4, 5.
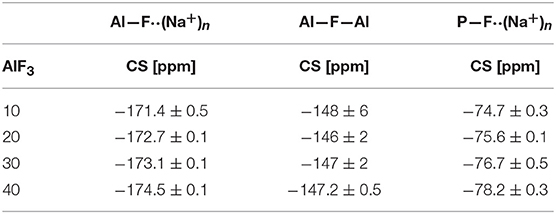
Table 4. 19F chemical shifts of (100-x)NaPO3 – xAlF3 series.
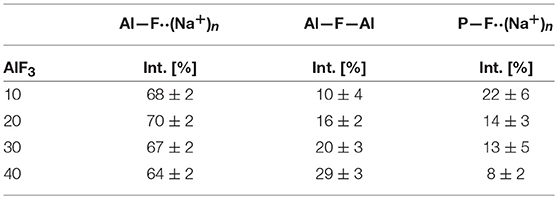
Table 5. 19F intensities of (100-x)NaPO3 – xAlF3 series.
Figure 4 shows the progression of fluorine types with further addition of AlF3 to NaPO-3. Within the uncertainty of the peak deconvolution, the relative concentration of Al—F··(Na+)n stays constant, however, with increasing AlF3 and correspondingly decreasing NaPO-3 content, P—F··(Na+)n is replaced with bridging Al—F—Al (w/one Na+ neighbor). This result indicates that as more aluminum is available connectivity increases between the aluminum atoms: at high AlF3 content (x = 30, 40 mol%), there are significant amounts of bridging Al—F—Al bonds, ~17% and ~24%, respectively. The increase in bridging oxygens per phosphate and appearance of Al—F—Al bonds is likely caused by the decrease of sodium available; P and Al want to form four and six bonds, respectively, but are forced to bond to neighboring glass formers, rather than form non-bridging oxygens or terminal fluorines. It is also worth noting that initially when terminal P—F··(Na+)n bonds are prevalent (high sodium), P10Al and species increase (Figure 2), but at low NaPO3 mol%, when P—F··(Na+)n bonds are only a small structural contribution, P10Al and peaks stop growing in; this similarity in trends demonstrates how aluminum fluorine initially adds to the phosphate backbone (P10Al and species) when sodium is present until Al—F—Al bonds begin to dominate and only P21Al forms.
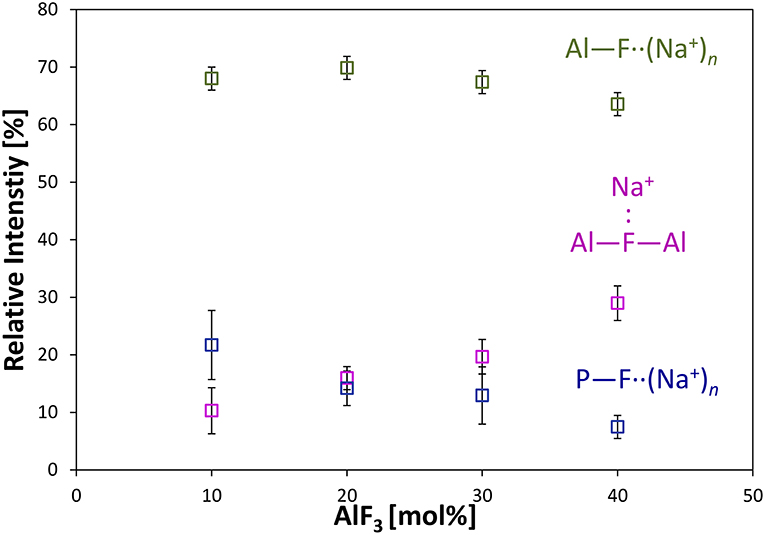
Figure 4. Average area fractions (over different spinning speeds) from 19F MAS NMR of different types of fluorine atoms: terminal P—F··(Na+)n, bridging Al—F—Al, and terminal Al—F··(Na+)n bonds.
The 27Al NMR spectra in Figure 5 reveal that the aluminum site is to a high percentage octahedral (order of and larger than 90%), with a small variation between Al[5]- and Al[4]-fold sites. Given the low intensities of Al[5] and Al[4] coordinations, integration was fixed to a chemical shift range based on the 60NaPO3-40AlF3 sample, shown in Figure 5; our final values are given in Table 6. These values agree with the descriptions reported elsewhere on this same glass series: Bradtmüller et al. (2018) demonstrate that at low AlF3 content, all the aluminum is 6-fold coordinated and only at high amounts of AlF3 (40 mol%) are small amounts of 5-fold (8%) and 4-fold (1%) aluminum present. Similarly, Brow (Brow, 1992) observed only one central peak at −10 ppm in the 27Al NMR spectra of this glass series, without any evidence for Al[4] or Al[5].
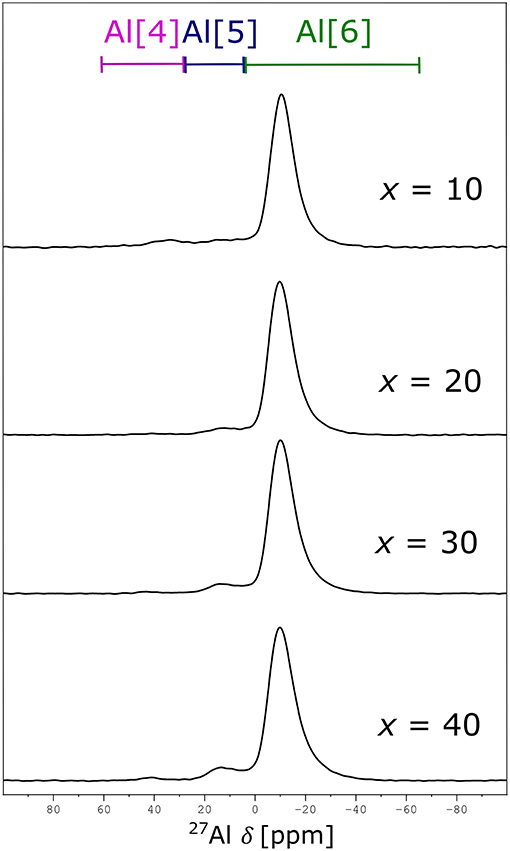
Figure 5. 27Al MAS NMR of (100-x)NaPO3 – xAlF3 series.
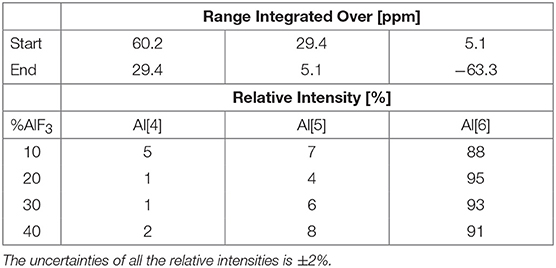
Table 6. Chemical shift ranges and integration of (100-x)NaPO3 – xAlF3 series from 27Al MAS NMR.
Bradtmüller et al. (2018) complete a comprehensive structural study giving many insights to the role of AlF3 in these glasses. One major conclusion is that the fluorine is uniformly distributed throughout the glass structure, i.e., no AlF3-like regions are formed. Using the 2nd moments from several nucleus pairs of double resonance NMR experiments, the authors determine that on average Al[6] is coordinated by four phosphorus and two fluorine atoms, Al(OP)4F2. Given the similarity in our NMR data as well as phase-pure XRD and optical microscopy results, we also conclude that our glasses contain Al(OP)4F2 and do not exhibit phase separation.
Brow et al. (1993) have measured and predicted the distribution of Al[4], Al[5], and Al[6] for a related glass system without fluoride, (1-x)NaPO3 – xAl2O3. They found that the average Al coordination decreased from six to four as the Al/P ratio increased; specifically, only Al[6] was found at low Al/P, ≤ 0.3, while Al[4] dominates at higher Al/P, ≥ 0.6. The Al/P ratio of our glass series ranges from 0.1 to 0.7, yet no significant differences in Al-speciation are observed between samples, i.e., no dependence on amount of AlF3 is found, indicating that fluorine is affecting the glass structure in a different way compared to oxygen.
The strong effect of fluoride addition upon Al coordination can be seen in Figure 6, where fluoride content clearly favors 6-fold aluminum at any Al/P ratio. Similar to our results, Zhang et al. (2007) found for sol-gel-derived glasses along the composition lines Na/Al/P/F 2:x:2:1, 2:2:x:1, 2:2:2:x, and x:2:2:x, respectively, that both low Al/P (<1) and high F/Al (or F/P) ratio were associated with increased fraction of Al[6]. The Al/P ratio still plays a role: at lower Al/P ratio, less fluorine drastically increases the average Al coordination, which agrees well with our 27Al NMR data. If we compare [F]/[Al+P] ratios for Zhang et al. (2007) and our glass system (indicated by degree of shading in Figure 6), all of our samples have higher [F]/[Al+P] ratios (and therefore higher proportion of Al[6], with the exception of the 90NaPO3-10AlF3 sample, which also has the lowest Al/P ratio). These two factors, Al/P ratio and fluorine content, are the reason we see nearly no variation in Al speciation, unlike the corresponding (1-x)NaPO3 – xAl2O3 series.
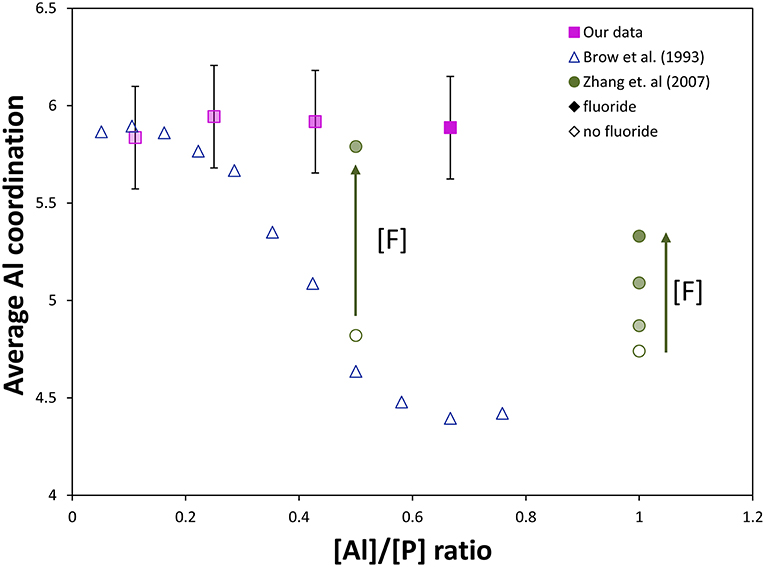
Figure 6. Comparison of our NMR data to literature NMR data from Brow et al. (1993) and Zhang et al. (2007, 2013). Effect of [Al]/[P] ratio and fluorine content on the average Al coordination in aluminophosphate and fluoroaluminophosphate series (completely shaded markers have the most fluoride, [F]/[Al+P] = 1.2, and unshaded markers have no fluoride content, [F]/[Al+P] = 0). Without fluorine, substantial Al[6] only forms at very low [Al]/[P], ≤ 0.3. The effect of fluorine content on the Al coordination can be observed: addition of fluoride ([F]/[P] = 0.5) forces most Al content into Al[6] despite a much higher [Al]/[P] (~0.5) compared with only aluminophosphate, while at sufficiently high [Al]/[P] (~1), much more fluoride content can be added without forcing all aluminum into 6-fold coordination (some remains as Al[4] and Al[5]).
The next several structural figures use valence unit [V.U.] theory (Bunker et al., 1991) to understand the driving forces behind the propensity of aluminum to form Al[6] in the presence of fluorine. Valence unit [V.U.] theory proposes that strong cations have V.U. equal to their valence which are shared by the number of bonds they form, i.e., tetrahedral P5+ has 5 V.U. shared among four bonds. Additionally, oxygen bonds must sum up to 2 V.U., while modifying ions are more fungible (0.1-−0.4 V.U. each). Due to the chemical complexity of our system, rather than finding crystals of corresponding composition, we have decided to focus on the fluoride bonding between aluminum and phosphorus. Brow et al. (1993) have used valence bond theory to explain the bonding in aluminophosphate glasses, specifically the equilibrium of Al[4] and Al[6] units as a function of Al/P. Figure 7A demonstrates that at low Al/P, ≤ 0.3, the fluoride bond in Al[4]—F—Al[4] is overbonded. Moreover, in Figure 7B, we observe at the same low Al/P ratio, fluorine is overbonded in P—F—Al[4] and energetically unfavored (even when the NBO and terminal F possess maximum ionicity, blue values). In fact P—F··(Na+)n bonds are much preferred and in agreement with the 19F NMR results: at low Al/P, 10-−20 mol% AlF3, P—F··(Na+)n bonding is prevalent. Indeed, the experimental and calculated 19F chemical shifts indicate that fluorine, even bridging Al—F—Al bonds have at least one coordinated Na+, with terminal fluorines likely requiring more Na+ partners; as such, we assume that every terminal fluorine has one Na+ contributing 1/6 V.U.
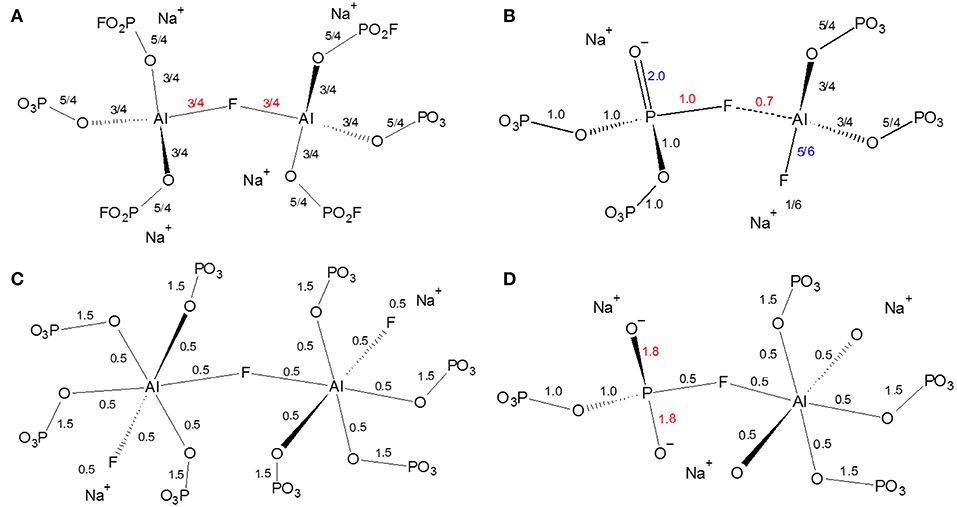
Figure 7. Effect of fluoride in fluoroaluminophosphate glass in phosphate-rich (low Al/P ratio, 0.3) environment (A) instability of Al[4]—F—Al[4] bond; (B) Instability of P—F—Al[4] bond; (C) Al[6]—F—Al[6] bond; (D) Instability of P—F—Al[6] bond.
On the one hand, Figure 7C clearly indicates the high stability of the bridging fluoride in Al[6]—F—Al[6], with it being preferred over P—F··(Na+)n once sufficient aluminum is available at higher Al/P, 30-−40 mol% AlF3 (19F NMR). Yet we know that P—F—Al[6] is still not formed: Figure 7D proposes that the high electron density (1.8 V.U.) on two NBOs of the phosphate tetrahedra is unstable. In metaphosphate the maximum V.U. on the two NBOs is 1.5 (which can also be intraconverted into 2.0 and 1.0 VU or a double and single bond, respectively), thus there is likely a resonance stabilization which cannot be achieved in Figure 7D.
Finally, we find it interesting that at low phosphate content, the aluminum coordination is significantly less sensitive to fluorine content; even at the same [F]/[Al+P], the average aluminum coordination is five rather than six observed in Zhang's data (Zhang et al., 2007). Figure 8 indicates that terminal fluorine have more flexibility in their valence (compared with bridging anions), therefore, they can compensate to ensure the bridging fluorine in Al—F—Al is not overbonded. There appears to be a large difference in Al/P of 0.67 and Al/P of 1.0, yet as it is always associated with terminal fluorines, the amount of sodium also plays a significant role; when an aluminum can have at least two terminal fluorines it can remain as Al[4] (right side), however, if two P—O—Al bonds are formed (low sodium), then the aluminum prefers Al[6] to accommodate more bridging oxygens (left side).
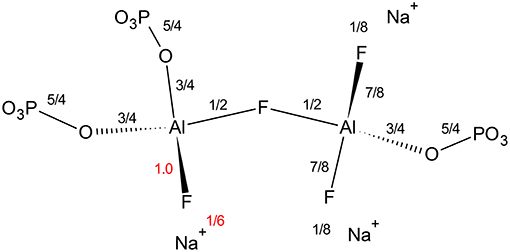
Figure 8. Effect of increasing fluoride on Al[4]—F—Al[4] bond in Al/P ratios of 0.67 (right side) and 1.0 (left side) environment. We are assuming all terminal fluorines have one coordinated Na+.
Thermal Analysis
Examples of endothermic peaks corresponding to the glass transition in NAPF glass (x = 20), using heating rates of 5, 10, 15, and 20 K/min, are shown in Figure 9. It is evident, from Figure 9, that the glass transition temperature (Tg) shifts to higher values with increasing heating rate, illustrating the kinetic nature of the glass transition.
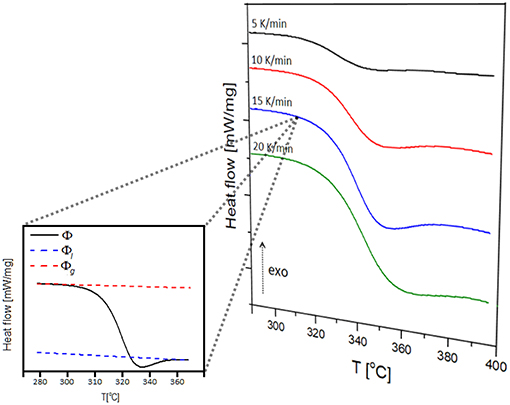
Figure 9. Multiple heating rate DSC curves of 80NaPO3 – 20AlF3 glass and determination of the extent of conversion at the heating rate of 15 K/min.
In order to estimate the activation energy as a function of the extent of conversion (α), the integral isoconversional method proposed by Vyazovkin (2015) was applied to the non-isothermal DSC data. Here, variable activation energies (Eα) are calculated by minimizing the function:
with the integral J[Eα, T(tα )]
In Equation 2, Ti(t), i = 1…n, is a set of arbitrary temperature programs and R is the universal gas constant. The method relies on direct numerical integration without any approximations. In the next step, the progress of conversion is defined,
where Φ is the heat flow at a given temperature T, and Φl and Φg represent heat flow values for the liquid and glass phases extrapolated to the same temperature T (inset of Figure 9).
The application of the aforementioned procedure results in α vs. Tcurves (Figure 10). The endothermic overshoot which is observed during heating gives rise to α-values which are formally higher than 1, however, the iso-conversional calculations for measurements performed on heating require only the ascending part of the α vs. Tcurves in the limit of α = 1.
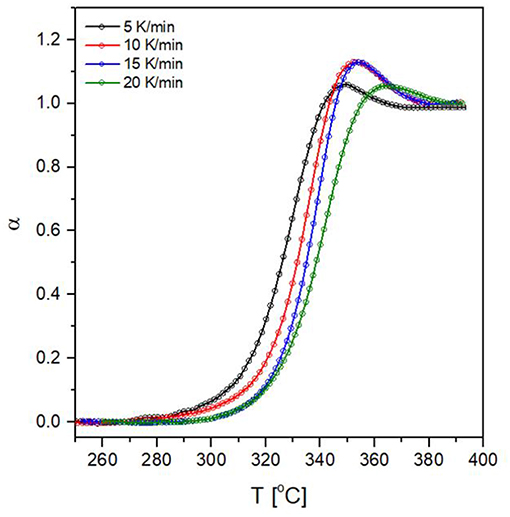
Figure 10. Conversion against temperature curves for the glass transition of 80NaPO3 – 20AlF3 glass at four heating rates.
The activation energies as a function of both conversion extent and temperature are shown in Figure 11. The Eαvs. α and Eα vs. T representations are linked to each other because they are two projections of the same line that cuts through the three-dimensional surface E(α, T). The line is determined by the α vs. T trace, which is simply a kinetic curve measured at a given heating rate (Vyazovkin, 2018). Based on the data presented in Figure 11, we find that the reduction of NaPO3/AlF3 ratio leads to an increase in Eα values, as well as an increase in the range of activation energies with conversion progress. Addition of 10 mol% AlF3 causes a small but progressive change in Eα, but not in the range of activation energies. Activation energy in these glasses (x = 0, 10) can be considered as constant during the glass transition process, which according to Vyazovkin (2018) can be interpreted as an effectively single-mode relaxation, characterized by an almost constant degree of molecular cooperativity. The near-constant activation energy typically indicates that the rate of a multistep process is either limited or dominated by the rate of one step. When more AlF3 is added, a distinct peak in Ea develops indicating a pronounced multi-mode relaxation process. The activation energy of the lowest process is equal to that at low AlF3 content, yet the highest-energy step increases significantly, signifying that a different, higher-energy process is being introduced.
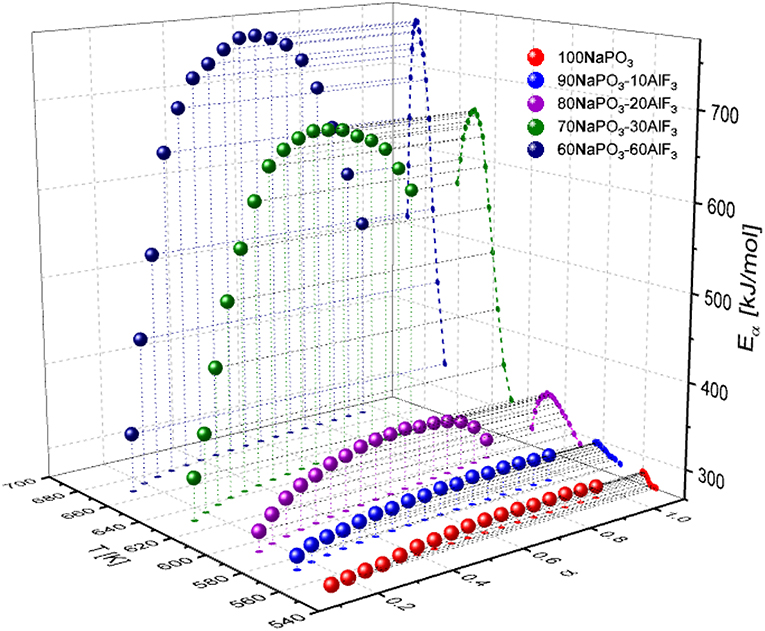
Figure 11. Conversion and temperature dependence of the activation energy for NAPF [(100-x)NaPO3–AlF3, x = 0, 10, 20, 30, 40] glasses.
The characteristic volume of the cooperatively rearranging region (CRR) at the glass transition temperature (Vξ) can be obtained from calorimetric data (Donth, 1982):
where, ξ represents characteristic length (size of CRR), Tg is the glass transition temperature, cV is the specific heat at constant volume, ρ is density of the sample, kB is the Boltzman constant and δT is the average temperature fluctuation of an average CRR. Specific heat capacity, cV, is a function of the structure of the material itself and depends on the number of degrees of freedom of motion that are available; the larger the number of degrees of freedom available to the particles of the material, the larger the specific heat capacity of the material. Kinetic energy of the particles in the material, i.e., translation and rotation of polyatomic molecules, is only one of the many possible types of degrees of freedom which manifests as a temperature change; some thermal energy may also be stored as the potential energy associated with higher energy modes of vibration, often occurring in interatomic bonds in a glass. These two types of energy, kinetic and potential, represent the degrees of freedom of motion which classically contribute to the heat capacity of a thermodynamic system.
Reliable values of Δ1/cp and δT can be calculated according to Hempel et al. (2000) (Figure 12):
where cp and cv are specific heats (J/mol·K) at constant pressure and volume, respectively. δT represents the mean-square temperature fluctuation of one average CRR, and it is, in the case of specific heat measurements upon heating, calculated as Hempel et al. (2000):
Since our specific heat measurements were done under constant pressure, the approximation Δcp≈Δcv was made in Equation 5 in order to calculate the characteristic volume of the CRR (Equation 4). Previously published Δcp and Δcv values (O'Reilly, 1977) were used to calculate a correction factor, S, determined from four small-molecule glass formers and 14 polymers (Hempel et al., 2000):
where ±0.22 is the standard deviation. All Vξ values (Figure 13) are corrected by S = 0.74.
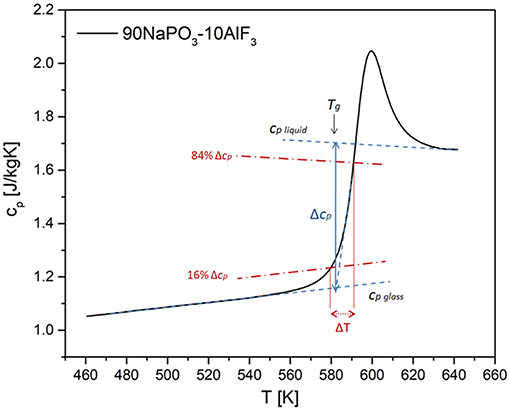
Figure 12. Scheme for the determination of the quantities needed for the calculation of the CRR volume based on specific heat measurements using DSC.
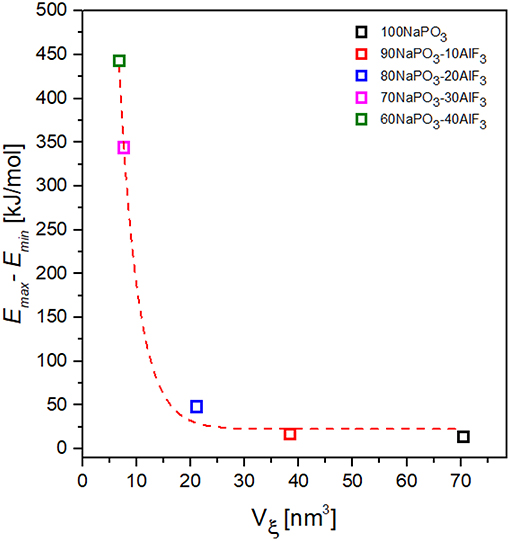
Figure 13. Dependence of the activation energy variability on CRR volume for NAPF [(100-x)NaPO3 – xAlF3, x = 0, 10, 20, 30, 40] glasses.
Taking the variability of activation energy as the difference between its minimum and maximum values, we find a relationship between activation energy variability and CRR volume (Figure 13): the activation energy variability decreases exponentially with increasing CRR volume.
Discussion
To better visualize the changes in the phosphate network with increasing AlF3 content, we begin with a schematic of pure NaPO3 glass in Figure 14A. Although P are tetrahedra in the glass, we have chosen to represent them with triangles in 2d space. As in the glass, most phosphate tetrahedra are Q20Al species and the average phosphate chain length is five tetrahedra (grouped in yellow). This is a relatively long chain length and represents a large cooperatively rearranging region (grouped in yellow), calculated to have volume of ~70 nm3 in Figure 14Aa (≈4 nm in effective diameter, or 103 phosphate tetrahedra, using molar volume Le et al., 2017). As CRR was defined earlier, we expect each phosphate chain to be able to rearrange independently of its environment. Despite some variation in chain length, the individual tetrahedra in the phosphate chains experience very similar bonding environments and the Ea required to plastically deform each chain is roughly equal. Consequently, the glass transition is dominated by one process with a relatively low Ea of 300 kJ/mol (Figure 11).
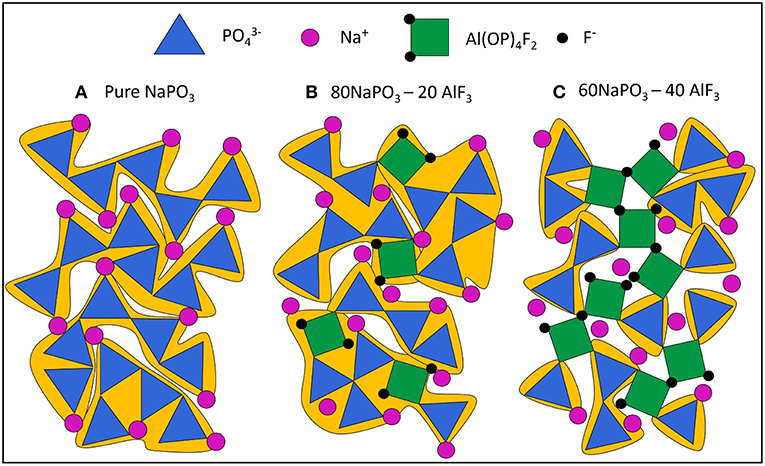
Figure 14. Manually drawn schematic of (A) pure NaPO3 glass, all Q2 chains and an average chain length of 5 phosphate tetrahedra (large CRR, ≈ 70 nm3, 103 phosphate tetrahedra for real system); (B) 80NaPO3 – 20AlF3, Q1, and Q2 species present and an average chain length of 2.5 phosphate tetrahedra (smaller CRR, ≈ 20 – 40 nm3, 300 – 600 formula units in real system) and (C) 60NaPO3 – 40AlF3, Q1, and Q2 species present and an average chain length of 1 phosphate tetrahedra (smallest CRR, ≈ 10 nm3, < 200 formula units in real system). Highlights the Al—F—Al bridges leading to high energy barrier for some CRR.
Addition of AlF3 results in the formation of Al(OP)4F2 groups (Bradtmüller et al., 2018) causing a sufficient increase in the degree of molecular cooperativity to raise the activation energy barrier slightly, compared with sodium metaphosphate glass. Although the connectivity of the pure phosphate backbone is decreasing, the P20Al are being replaced by P10Al, P30Al and (Figure 2) maintaining the number of BOs per tetrahedra and bonding to Al, which in turn, is connected to four other phosphorus atoms through bridging oxygens (as Al(OP)4F2) (Bradtmüller et al., 2018). In terms of connectivity, Al(OP)4F2 may be considered as a Q4 species, thus we argue that the introduction of AlF3 increases the connectivity of the glass, which agrees with the higher activation energy observed for 10–20 mol% AlF3 in Figure 11. Moreover, there has been evidence that the introduction of halides encourages reforming of BOs from NBOs (Baasner et al., 2014); halides' bonding preference for modifiers is sufficiently strong so that the halides pull the modifiers from the phosphate backbone. In the case of x = 20, activation energy values are a bit higher compared to that of x = 10, due to increased connectivity via more heteronuclear BOs between phosphate tetrahedra (Al—O—P), some bridging fluorines (Al—F—Al) and possibly some reformed P—O—P bonds as well.
In addition to increasing connectivity, Al(OP)4F2 is significantly more constrained than only Q2 phosphate chains. The glass transition involves energy on the scale of plastic deformation and the Al(OP)4F2 octahedra can be thought as pin defects between phosphate chain segments. Nonetheless, the average phosphate chain length is much lower, 2.5 tetrahedra (grouped in yellow), making the calculated average CRR volume smaller as well (≈20–40 nm3, corresponding to some 300–600 formula units of glass).
At the highest AlF3 content, in Figure 14C, we introduce some bridging fluorines between Al(OP)4F2 octahedra. More AlF3 results in further depolymerization of the phosphate backbone, but also the creation of more substantial grain-boundary-like AlF3 chains. Here the CRRs (grouped in yellow) are very small (≈10 nm3, <200 formula units). The structural ensemble is becoming more heterogeneous in terms of the selective precipitation of super-structural units; the Al(OP)4F2 octahedra are significantly more constrained (more than four bridges to neighboring Al or P) than phosphate tetrahedra (less than two bridges to neighboring Al or P). This is similar to the structurally and dynamically heterogeneous domains found by Moesgaard et al. (2010) in calcium aluminosilicate: regions of highly constrained, alternating AlO4 and SiO4 tetrahedra located between more mobile, depolymerized calcium SiO4 domains. As Brow (Brow, 1992) discusses, AlF3 addition creates strong Al—O—P bonds, while simultaneously producing unconstrained terminal phosphorus-bound and aluminum-bound F-. As such, we expect that in contrast to highly constrained Al(OP)4F2 octahedra, there are also highly mobile phosphate regions with terminal fluorines.
A high AlF3:NaPO3 ratio (x = 30, 40) results in a large increase in activation energy (up to 700 kJ/mol) and a large difference between the minimum and the maximum of the activation energy (450 kJ/mol). Interestingly, in Figure 11 the activation energy minima remain relatively constant as AlF3 is introduced (increasing from ~275 to 325 kJ/mol), indicating that a similar relaxation process is present in all samples which involves the pure NaPO3 component; when we assign the minimum Ea mode to P2m phosphate chains, with or without Al or F− neighbors, there appear to be only small differences based on the chemical identity of neighbors with number of constraints being the dominant factor.
At x ≥ 30, a major structural change occurs; the aluminum-bound fluorine bridges (Al—F—Al) become more common than the phosphorus-bound terminal fluorines (P—F··(Na+)n) and more BOs per phosphate tetrahedron are formed, leading to a sharp increase in the connectivity of the glass structure. According to the results shown in Figure 11, increase in temperature (conversion) up to around α = 0.5 enhances molecular motion and increases the degree of molecular cooperativity leading to an increase in activation energy. Since the Al(OP)4F2 is highly constrained, all the neighboring phosphate chains need to be mobile before the Al(OP)4F2 participates cooperatively. As a result, the rearrangement of the regions involving Al(OP)4F2 lag behind those composed of mostly phosphate chains, but also have higher activation energies (stronger Al—O—P bonds). As α increases from 0.5 to 1, the free volume continues to increase and the bonds become weaker and longer, decreasing the activation energy of the relaxation processes as well as giving polyhedra more freedom of motion, resulting in higher probabilities of less cooperative motion.
The exact size or length of the two heterogeneous domains, Al(OP)4F2 octahedra and phosphate tetrahedra chains, is not known, however based on the 19F, we expect mostly isolated Al(OP)4F2 octahedra at low AlF3 and as more AlF3 is introduced, Al(OP)4F2 octahedra form dimers, followed by longer Al(OP)4F2 octahedra “chains” (larger domain size). Consequently, at low AlF3 content, the isolated Al(OP)4F2 octahedra domains are much shorter than the phosphate chains. Yet, at high AlF3 content, half of the phosphate groups are no longer in chains, but are isolated pyrophosphate groups (Q1, P2). If we assume each Al(OP)4F2 octahedra has two F− bonds and that no Al—O—Al bonds form, the 19F NMR informs us that at high AlF3 content, roughly half of the Al(OP)4F2 octahedra bond to another Al(OP)4F2 octahedron (dimers or longer “chains”); therefore, the sizes of the two domains [Al(OP)4F2 octahedra and phosphate tetrahedra] overlap and are much more comparable at high AlF3 content. This similarity in domain size may be another reason for Al—F—Al bonding being such a crucial factor in determining the thermal relaxation behavior.
The structural schematics presented in Figure 14 demonstrate clearly the decrease in CRR, however, they less accurately portray the structural relaxation with increasing temperature. Although Al(OP)4F2 octahedra separate the glass network into differently sized phosphate regions, when the glass relaxes, the phosphate regions do not relax completely, leaving frozen Al(OP)4F2 regions behind. We believe that this is more akin to lower aluminum-to-phosphorus regions cooperatively rearranging, followed by regions with higher aluminum-to-phosphorus ratios. This creates a topologically heterogeneous glass composed of faster (low Ea) and slower (high Ea) relaxing regions. We believe these higher Ea relaxation modes to govern macroscopic properties other than the Tg; shear and bulk modulus also increase non-linearly for samples with ≥ 30% AlF3 content (without the commensurate non-linear increase in molar volume, packing density or volume density of bonding energy; Le et al., 2017).
Conclusion
31P NMR indicated that the introduction of AlF3 increases the average connectivity in the glass through heteronuclear Al—O—P bonding, i.e., replacement of P20Al with P21Al and formation of at high AlF3 content, and the forced association of Na+ with terminal fluorines. 19F NMR revealed that AlF3 adds to the phosphate backbone mostly as Al—F··(Na+)n, with initial AlF3 addition creating P—F··(Na+)n bonds until the lack of sodium and availability of aluminum force Al—F—Al bonds to become more dominant at 30 mol% AlF3. DFT calculations verified the 19F assignments, lack of Al—F—P bonds and the strong coordination of Na+ with both bridging and terminal fluorine. In agreement with other 27Al NMR results, we found that low Al/P ratio or high fluorine content result in Al[6] sites being the dominant species negligible Al[5] and Al[4] sites at high AlF3 content; based on Bradtmüller et al's. [15] investigation, we conclude that our system also contains octahedral Al(OP)4F2. Finally, we used Valence Unit theory to explain the instability of Al—F—P bonds, while demonstrating the preference for Al[6]—F—Al[6]; similarly, we used V.U. theory to discuss the role of sodium in the formation of P—F··(Na+)n and Al[4]—F—Al[4] bonds.
Multinuclear NMR analysis allowed us to produce structural schematics that demonstrate the structural and topological differences which occur as a function of AlF3 and relate the trends to relaxation processes. Concurrent with the rise in maximum Ea, the variability of the Ea for the glass transition also increases with increasing AlF3 content. We proposed that there are phosphate-rich regions which are more like NaPO3 without many bridging bonds to Al, but at the same time, there are Al(OP)4F2-rich regions that are much more topologically constrained. As more AlF3 is added, some glass regions become increasing constrained due to more Al—F—Al and Al—O—P cross-links, which increases further ΔEa. At the same time, P—F··(Na+)n bonds create less constrained, flexible regions that have similarly low Ea as phosphate chains in pure NaPO3. The large difference between minimum and maximum Ea indicates that the glass transition is composed of several different-energy structural relaxation processes and that the glass structure is heterogeneous on the length-scale of these processes.
Surprisingly, despite a higher maximum Ea for relaxation processes and a higher connectivity in the glass network at high AlF3 content, an on average smaller volume of cooperatively rearranging regions is found for glasses with higher fluorine content. The Al(OP)4F2 octahedra are significantly more topologically constrained and break up the phosphate network into smaller phosphate chains, similar to pin defects in granular materials. The observed decrease in the average CRR size agrees with the results from 31P NMR: the average homonuclear phosphate chain length decreases with increasing AlF3 content (mostly P21A1 at high AlF3).
Data Availability
All datasets generated for this study are included in the manuscript and/or the supplementary files.
Author Contributions
CC, LW, JP, and UW-Z conceived and planned the experiments. JP (thermal analysis) and UW-Z (NMR) performed the experiments, processed the experimental data and performed the analysis. JZ planned and carried out simulations. QL manufactured the samples. LW, CC, QL, UW-Z, JP, and JZ contributed to the interpretation of the results. CC took the lead in writing the discussion and manuscript with contributions from all authors. All authors provided critical feedback and helped shape the research, analysis and manuscript.
Funding
This project has received funding from the European Research Council (ERC) under the European Union's Horizon 2020 research and innovation program (ERC grant UTOPES, grant agreement no. 681652). CC is grateful to the Natural Sciences and Engineering Research Council of Canada (NSERC) for financial support.
Conflict of Interest Statement
The authors declare that the research was conducted in the absence of any commercial or financial relationships that could be construed as a potential conflict of interest.
Footnotes
1. ^The near neighbors to fluorine were determined based on a cut-off of 2.35 Å, with the exception that the fourth Na in Na5AlF2(PO4)2 is slightly farther, at 2.45 Å.
References
Adam, G., and Gibbs, J. H. (1965). On the temperature dependence of cooperative relaxation properties in glass-forming liquids. J. Chem. Phys. 43, 139–146. doi: 10.1063/1.1696442
Baasner, M., Hung, I., Kemp, T. F., Dupree, R., Schmidt, B. C., and Webb, S. L. (2014). Constraints on the incorporation mechanism of chlorine in peralkaline and peraluminous Na2O-CaO-Al2O3-SiO2 glasses. Am. Mineral. 99, 1713–1723. doi: 10.2138/am.2014.4717
Benzine, O., Bruns, S., Pan, Z., Durst, K., and Wondraczek, L. (2018). Local deformation of glasses is mediated by rigidity fluctuation on nanometer scale. Adv. Sci. 5:916. doi: 10.1002/advs.201800916
Bradtmüller, H., Zhang, L., de Araujo, C. C., Eckert, H., Möncke, D., and Ehrt, D. (2018). Structural studies of NaPO3-AlF3 glasses by high-resolution double-resonance NMR spectroscopy. J. Phys. Chem. C 122, 21579–21588. doi: 10.1021/acs.jpcc.8b06162
Brow, R. K. (1992). A multinuclear MAS NMR study of the short-range structure of fluorophosphate glass. J. Mater. Res. 7:1892. doi: 10.1557/JMR.1992.1892
Brow, R. K., Kirkpatrick, R. J., and Turner, G. L. (1993). Nature of alumina in phosphate glass: II, Structure of sodium aluminophosphate glass. J. Am. Ceram. Soc. 76, 919–928. doi: 10.1111/j.1151-2916.1993.tb05316.x
Bunker, B. C., Kirkpatrick, R. J., and Brow, R. K. (1991). Local structure of alkaline-earth boroaluminate crystals and glasses: I, Crystal chemical concepts—structural predictions and comparisons to known crystal structures. J. Am. Ceram. Soc. 29, 1425–1429. doi: 10.1111/j.1151-2916.1991.tb04123.x
Champagnon, B., Wondraczek, L., and Deschamps, T. (2009). Boson peak, structural inhomogeneity, light scattering and transparency of silicate glasses. J. Non. Cryst. Solids 355, 712–714. doi: 10.1016/j.jnoncrysol.2009.01.029
Donth, E. (1982). The size of cooperatively rearranging regions at the glass transition. J. Non. Cryst. Solids 53, 325–330. doi: 10.1016/0022-3093(82)90089-8
Donth, E.-J. (2001). The Glass Transition: Relaxation Dynamics in Liquids and Disordered Materials. Berlin: Springer-Verlag. doi: 10.1007/978-3-662-04365-3
Duval, E., Mermet, A., and Saviot, L. (2007). Boson peak and hybridization of acoustic modes with vibrations of nanometric heterogeneities in glasses. Phys. Rev. B - Condens. Matter Mater. Phys. 75, 1–9. doi: 10.1103/PhysRevB.75.024201
Ediger, M. D. (2000). Spatially heterogeneous dynamics in supercooled liquids. Annu. Rev. Phys. Chem. 51, 99–128. doi: 10.1146/annurev.physchem.51.1.99
Flynn, J. H., and Wall, L. A. (1966). A quick, direct method for the determination of activation energy from thermogravimetric data. J. Polym. Sci. B Polym. Lett. 4, 323–328. doi: 10.1002/pol.1966.110040504
Friedman, H. L. (2007). Kinetics of thermal degradation of char-forming plastics from thermogravimetry. Application to a phenolic plastic. J. Polym. Sci. Part C Polym. Symp. 6, 183–195. doi: 10.1002/polc.5070060121
Garn, P. D. (1990). Kinetics of thermal decomposition of the solid state. II. Delimiting the homogeneous-reaction model. Thermochim. Acta 160, 135–145. doi: 10.1016/0040-6031(90)80254-V
Greaves, G. N., and Ngai, K. L. (1995). Reconciling ionic-transport properties with atomic structure in oxide glasses. Phys. Rev. B 52, 6358–6380. doi: 10.1103/PhysRevB.52.6358
Greaves, G. N., and Sen, S. (2007). Inorganic glasses, glass-forming liquids and amorphizing solids. Adv. Phys. 56, 1–166. doi: 10.1080/00018730601147426
Hempel, E., Hempel, G., Hensel, A., Schick, C., and Donth, E. (2000). Characteristic length of dynamic glass transition near Tg for a wide assortment of glass-forming substances. J. Phys. Chem. B 104, 2460–2466. doi: 10.1021/jp991153f
Kresse, G., and Furthmüller, J. (1996). Efficient iterative schemes for ab initio total-energy calculations using a plane-wave basis set. Phys. Rev. B 54, 11169–11186. doi: 10.1103/PhysRevB.54.11169
Kresse, G., and Joubert, D. (1999). From ultrasoft pseudopotentials to the projector augmented-wave method. Phys. Rev. B 59, 1758–1775. doi: 10.1103/PhysRevB.59.1758
Le, Q. H., Palenta, T., Benzine, O., Griebenow, K., Limbach, R., Kamitsos, E. I., et al. (2017). Formation, structure and properties of fluoro-sulfo-phosphate poly-anionic glasses. J. Non. Cryst. Solids 477, 58–72. doi: 10.1016/j.jnoncrysol.2017.09.043
MacKenzie, K. J. D., and Smith, M. E. (2002). Multinuclear solid-state NMR of inorganic materials. Pergamon Mater. Ser. 6, 3–727. doi: 10.1016/j.jaap.2008.03.002
Massiot, D., Fayon, F., Capron, M., King, I., Le Calv, éS., Alonso, B., et al. (2002). Modelling one- and two-dimensional solid-state NMR spectra. Magn. Reson. Chem. 40, 70–76. doi: 10.1002/mrc.984
Moeller, R. P., Gupta, P. K., Elterman, P. B., Moynihan, C. T., Sasabe, H., Macedo, P. B., et al. (2006). Structural relaxation in vitreous materials. Ann. N. Y. Acad. Sci. 279, 15–35. doi: 10.1111/j.1749-6632.1976.tb39688.x
Moesgaard, M., Keding, R., Skibsted, J., and Yue, Y. (2010). Evidence of intermediate-range order heterogeneity in calcium aluminosilicate glasses. Chem. Mater. 15, 4471–4483. doi: 10.1021/cm1011795
Möncke, D., da Neto, M. C. B., Bradtmüller, H., de Souza, G. B., Rodrigues, A. M., Elkholy, H. S., et al. (2018). NaPO3-AlF3 glasses: fluorine evaporation during melting and the resulting variations in structure and properties. J. Chem. Technol. Metall. 53, 1047–1060. Available online at: https://dl.uctm.edu/journal/web/j2018-6
O'Reilly, J. M. (1977). Conformational specific heat of polymers. J. Appl. Phys. 48, 4043–4048. doi: 10.1063/1.323444
Ozawa, T. (1965). A new method of analyzing thermogravimetric data. Bull. Chem. Soc. Jpn. 38, 1881–1886. doi: 10.1246/bcsj.38.1881
Perdew, J. P., Burke, K., and Ernzerhof, M. (1996). Generalized gradient approximation made simple. Phys. Rev. Lett. 77, 3865–3868. doi: 10.1103/PhysRevLett.77.3865
Pickard, C. J., and Mauri, F. (2001). All-electron magnetic response with pseudopotentials: NMR chemical shifts. Phys. Rev. B 63:245101. doi: 10.1103/PhysRevB.63.245101
Vyazovkin, S. (2001). Modification of the integral isoconversional method to account for 699 variation in the activation energy. J. Comput. Chem 22, 178–183. doi: 10.1002/1096-987X(20010130)22:2<178::AID-JCC5>3.0.CO;2-%23
Vyazovkin, S. (2006). Model-free kinetics: staying free of multiplying entities without necessity. J. Therm. Anal. Calorim. 83, 45–51. doi: 10.1007/s10973-005-7044-6
Vyazovkin, S. (2015). Isoconversional Kinetics of Thermally Stimulated Processes. London: Springer. doi: 10.1007/978-3-319-14175-6
Vyazovkin, S. (2016). A time to search: finding the meaning of variable activation energy. Phys. Chem. Chem. Phys. 18, 18643–18656. doi: 10.1039/C6CP02491B
Vyazovkin, S. (2018). “Chapter 4: Modern isoconversional kinetics,” in Handbook of Thermal Analysis and Calorimetry - Recent Advances, Techniques and Applications, 2nd ed, eds S. Vyazovkin, N. Koga, and C. Schick (Amsterdam: Elsevier), 131–172.
Wondraczek, L., and Behrens, H. (2007). Molar volume, excess enthalpy, and Prigogine-Defay ratio of some silicate glasses with different (P,T) histories. J. Chem. Phys. 127:2794745. doi: 10.1063/1.2794745
Wondraczek, L., Behrens, H., Yue, Y., Deubener, J., and Scherer, G. W. (2007). Relaxation and glass transition in an isostatically compressed diopside glass. J. Am. Ceram. Soc. 90, 1556–1561. doi: 10.1111/j.1551-2916.2007.01566.x
Zhang, L., De Araujo, C. C., and Eckert, H. (2007). Structural role of fluoride in aluminophosphate sol-gel glasses: high-resolution double-resonance NMR studies. J. Phys. Chem. B 111, 10402–10412. doi: 10.1021/jp072725w
Keywords: structural relaxation, fluorophosphate glass, ionic glass, structural heterogeneity, thermal analysis, structure-property relationship, NMR spectroscopy, structural analysis
Citation: Calahoo C, Petrovic J, Le QH, Werner-Zwanziger U, Zwanziger J and Wondraczek L (2019) Structural Relaxation in Polyanionic Sodium Fluorophosphate Glasses. Front. Mater. 6:165. doi: 10.3389/fmats.2019.00165
Received: 19 March 2019; Accepted: 24 June 2019;
Published: 11 July 2019.
Edited by:
Randall Youngman, Corning Inc., United StatesReviewed by:
Yuanzheng Yue, Aalborg University, DenmarkHellmut Eckert, Universidade de São Paulo São Carlos, Brazil
Copyright © 2019 Calahoo, Petrovic, Le, Werner-Zwanziger, Zwanziger and Wondraczek. This is an open-access article distributed under the terms of the Creative Commons Attribution License (CC BY). The use, distribution or reproduction in other forums is permitted, provided the original author(s) and the copyright owner(s) are credited and that the original publication in this journal is cited, in accordance with accepted academic practice. No use, distribution or reproduction is permitted which does not comply with these terms.
*Correspondence: Courtney Calahoo, Y291cnRuZXkuY2FsYWhvb0B1bmktamVuYS5kZQ==; Lothar Wondraczek, bG90aGFyLndvbmRyYWN6ZWtAdW5pLWplbmEuZGU=