 Francesca Ferrari
 Raffaella Striani
 Carola Esposito Corcione
 Antonio Greco
- Department of Engineering for Innovation, University of Salento, Lecce, Italy
This work is aimed to the development of new green composite materials by the incorporation of natural additives into poly(vinyl) alcohol (PVA). Two additives, shredded walnut shells and organic fraction of municipal solid waste (MW), were used to improve the mechanical properties of PVA. Both additives, derived from food industry wastes, were added in a PVA/water solution, which allowed to produce samples by the use of a pressure free process. Rheological analysis was performed in order to study the evolution of the material viscosity during thermal treatment, aimed at water removal. Samples obtained were characterized by means of differential scanning calorimetry (DSC), showing an improvement of the glass transition temperature brought by the addition of walnut shells. Finally, flexural tests were carried out on samples obtained after the incorporation of the different additives in PVA and compared with the mechanical properties of the neat matrix. Results obtained indicate the potential improvement brought by the addition of walnut shells, which allows increasing the flexural modulus of about 50%, at the expenses of a flexural strength reduction of about 30%. Also, at least for low amount of added water, the addition of MW was shown to provide an increase of the strain at break equal to 100%.
Introduction
Poly(vinyl) alcohol (PVA) is a non-toxic, water soluble thermoplastic polymer obtained from the hydrolysis in ethanol of poly(vinyl) acetate. Unlike other polymers, which were produced starting by their monomer, PVA is obtained by the ester interchange with methanol of acetate groups in presence of anhydrous sodium methylate or aqueous sodium hydroxide (Saxena, 2004). Because of its non-toxic nature, PVA is employed since the first years of twentieth century for food packaging and medical disposals (DeMerlis and Schoneker, 2003). Also, due to its high biodegradability, PVA is often mixed with other biopolymers for the production of hydrophilic films, or in order to improve the mechanical response of the material (Limpan et al., 2012). As reported in PVA MSDS, the product is not classified as environmentally hazardous, and is characterized by very low eco toxicity toward different micro-organisms.
Because of its high solubility, PVA can be easily processed at low temperatures, through the addition of water, which brings a liquid solution, at relatively high concentrations of PVA, characterized by very low viscosity (Gaaz et al., 2015). In addition, PVA is characterized by very low cost and low gas permeability toward oxygen and carbon anhydride. Moreover, PVA can be added to fiber reinforced composites in order to improve the fiber- matrix interfacial properties, through the development of strong bonds between its hydroxyl groups and the functionalized fillers (Mallakpour et al., 2014; Shang et al., 2015).
Despite its good behavior in terms of easy processing, low cost and high permeability, PVA lacks adequate mechanical properties in different lading conditions (Stammen et al., 2001): therefore, many studies were carried out on PVA in order to improve its mechanical properties, through the addition of different fillers. As an example, Abdullah and Dong (2019) showed that water absorption capacity and water solubility of nanocomposite films were decreased remarkably by 44.24 and 48.05%, respectively, with increasing the halloysite nanotube (HNT) content from 0 to 5 wt% when compared with those of biopolymer matrices. However, they did not performed mechanical charcaterizations of the PVA based composiets. On the other hand, Cadek et al. (2002) added multiwall carbon nanotubes in different amounts to PVA, increasing stiffness and hardness of the polymer. In details, it was found that, by adding various concentrations of nanotubes, both Young's modulus and hardness increased by factors of 1.8 and 1.6 at 1 wt% in PVA and 2.8 and 2.0 at 8 wt% in PVA (Cadek et al., 2002). Other studies were focused on the addition of fully exfoliated graphene oxide (GO) sheets and multi-walled carbon nanotubes (CNTs), thus obtaining a significant improvement in mechanical properties if compared to neat PVA films. In particular, it was shown that the yield strength and Young's modulus of GO–CNT/PVA composite films with 1 wt% GO and 0.5 wt% CNT have increased by 48 and 31%, respectively if compared to neat PVA (Li et al., 2011).
Alternatively, the production of bio-composites requires the addition of natural fillers or fibers, thus avoiding problems related to safety and toxicological impact, still preserving the excellent water solubility and biodegradability of PVA. Therefore, several studies were performed on the addition of naturally-derived reinforcements to PVA matrix.
Biodegradable cornstarch/PVA blends were prepared and characterized by many authors. The produced blends are characterized by a high hydrophilicity and poor mechanical properties, which, however, can be significantly improved by the methylation of cornstarch, as reported by Guohua et al. (2006).
Addition of methylcellulose (MC) was shown to improve the tensile strength of about 20% (Park et al., 2001). Furthermore, PVA nanocomposites were produced by adding Bamboo Charcoal (BC) nanoparticles via solution casting. Authors found an increase of lamellar size of PVA by the incorporation of BC, which in turns allowed for significant improvement in tensile strength and elastic modulus (Mohanad and Dong, 2018). In details, the incorporation of BC nanoparticles enhanced the elastic moduli of both crystalline and amorphous phases of PVA by ~51 and ~100%, respectively (Mohanad and Dong, 2018).
On the other hand, the possibility to reinforce PVA by means of food wastes was not yet fully investigated. The food waste recycling for this application assumes a primary importance, since it allows both the reinforcement of a matrix and the increase of the efficiency of waste management with the reduction of its negative effects on the environment and on population. This work was therefore aimed to the improvement of PVA mechanical properties by the addition of natural fillers derived from selected food waste of from the organic fraction of municipal solid waste (MW). The PVA blends obtained, characterized by a very high loading of natural fillers, where analyzed in terms of mechanical and thermal properties.
Materials and Methods
The PVA used in this work is Kuraray Poval 3–85, a partially saponified grade of poly(vinyl) alcohol, supplied as fine powder/granules with a bulk density of 0.4–0.6 gcm−3, a degree of hydrolysis of 84.2–86.2 mol% and a viscosity in a 4% aqueous solution of 3.4–4.0 mPa*s at 20°C. Walnut shells (WS) and organic fraction of municipal solid waste (MW) were obtained by the recycling of food industry. In order to accurately control the amount of water of the blends, all the fillers were completely dried before being mixed with water and PVA.
Afterwards, mixtures of PVA and different additives (Table 1) were produced by varying the water content between 50 and 65% in weight, keeping a constant ratio 1:1 (in weight) between PVA and the fillers (Table 1).
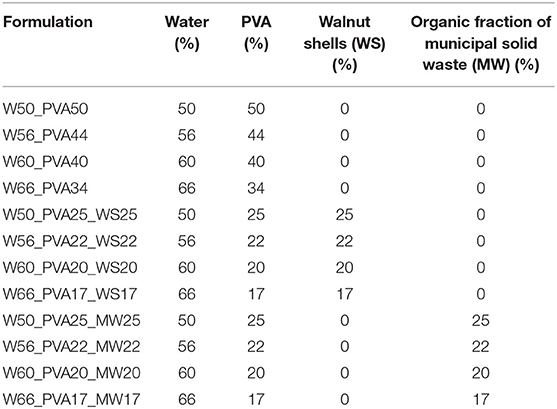
Table 1. Compositions of all the produced formulations.
After mechanical mixing for 10 min at 60 rpm in a Haake Rheocord mixer at room temperature, all the mixtures were degassed and then poured in silicon molds and then kept in oven at 70°C. Samples were extracted from the oven after complete evaporation of the water, which was taken as the time necessary for two successive weighting in time intervals of 24 h differ <0.1%. For comparison, mixtures with only PVA and water were also produced.
DSC analysis was performed on a Mettler Toledo 822 (Mettler Toledo, Greifensee, Switzerland) instrument under a nitrogen flux of 60 mL min−1, applying an heating scan from 20 to 180°C, with a heating rate of 10°C/min. All the tested samples had a sample mass of 5 mg.
Rheological analyses were carried out on a Rheometrics Ares rheometer. Steady rate tests were carried out at 70°C varying the shear rate from 0.05 to 1 s−1 for viscosity measurement at different amounts of water. Also, dynamic temperature ramp tests were performed on PVA samples, in order to analyze the water evaporation during a heating scan from 25 to 70°C at 3°C/min on a parallel plate geometry, with a gap of 0.3 mm, constant oscillatory amplitude (1%) and frequency (1 Hz).
Flexural tests were performed on 100 × 10 × 3 mm samples, obtained after water evaporation, using a Lloyd LR5K and a crosshead speed of 1.5 mm/min, following the standard ASTM D790-00. Six samples for every composition were tested. Before testing, samples were kept for 24 h at 70°C in order to allow complete water evaporation. Finally, an optical microscope Zeiss AXIO-LINKAM was used for the morphological characterization of the materials. The size of the pores was obtained as an average of 50 measurements.
Experimental Results
Initially, rheological analyses were performed on neat PVA samples with different amount of water, ranging between 50 and 65°C, as reported in Figure 1A.
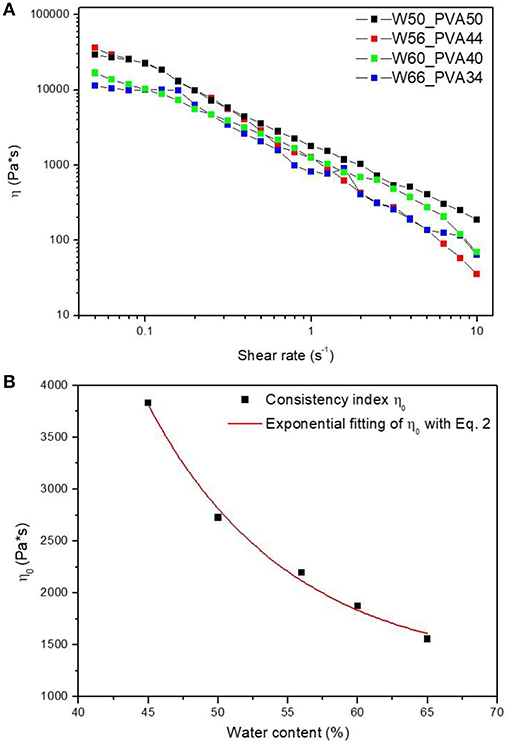
Figure 1. (A) Steady rate sweep tests on PVA samples with different water contents and (B) consistency index η0 as a function of water content.
All the samples show a pseudo-plastic behavior, characterized by a viscosity decrease with increasing shear rate. Therefore, by considering a power law correlation between the viscosity and the shear rate:
the consistency index η0 was calculated by fitting the curves in Figure 1B. L'origine riferimento non è stata trovata. (A). All the samples showed a similar qualitative behavior, with consistency index increasing by decreasing the water amount. Fitting parameters found for curves at different water content are shown in Table 2.
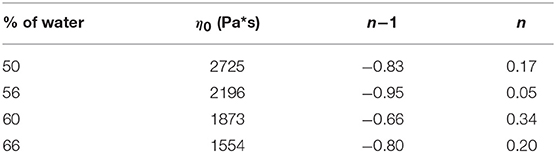
Table 2. Fitting parameters of Equation (1) applied to the experimental curves of Figure 1A at different water content.
Results reported in Errore. L'origine riferimento non è stata trovata. (B) show an exponential decrease of η0 by increasing water content according to Equation (2):
where, η0 is the offset (1252.53 Pa*s), A1 indicates the amplitude (215684.81), wc is the water content and t1 is the decay constant (10.14).
However, the viscosity evolution during heating was found to be significantly different for the different samples; results reported in Figure 2 show that, at room temperature, the viscosity of PVA_WS is much higher than that of the two other systems, neat PVA and PVA_MW. This is attributed to the water absorption by neat PVA and PVA_MW, in contrast to PVA_WS, which absorbs much lower amounts of water. In turn, this latter result was attributed to the much higher water amounts absorbed by both PVA and MW, compared to WS.
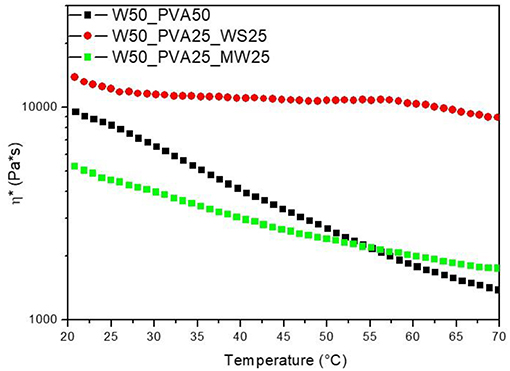
Figure 2. Rheological analyses on neat PVA and PVA mixed with walnut shells and municipal solid waste.
Moreover, as reported in Figure 2, PVA shows a marked decrease of viscosity with increasing temperature; such decrease is mainly due to the viscosity decrease of water during heating. At higher temperatures (not shown in Figure 2) water evaporation causes a significant increase of the viscosity of PVA sample.
For PVA_MW, the slope of the viscosity curve is reduced, indicating that the effect of water viscosity decrease is counterbalanced by viscosity increase due to water evaporation. For PVA_WS, a further decrease of the slope of the curve indicates that in this sample water evaporation occurs at much lower temperatures compared to the other two samples.
The results of Figure 2 can be correlated to the affinity between the material and water; for neat PVA, which is water soluble, a complete water adsorption causes a better retention of water during heating. Therefore, water evaporation occurs at much higher temperatures. Upon addition of MW, which is not completely water soluble, but absorbs some water, water release occurs, quite slowly, during heating. For WS, which does not absorb water, water release occurs much faster during the heating stage.
DSC analyses were carried out on neat PVA and PVA_WS samples, in order to evaluate the glass transition temperature (Tg) of the mixture. The DSC curves are reported in Figure 3.
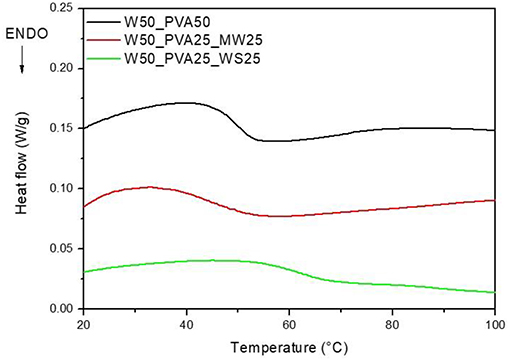
Figure 3. DSC analyses on neat PVA and PVA_WS.
As shown in Figure 3, an increase in Tg from about 49°C to about 61°C was obtained with the addition of walnut shells to PVA. In contrast, no significant change in the glass transition was observed upon addition of MW to PVA.
On the other hand, the development of a pressure-free process for the production of such components poses severe issues related to the void amount in the produced samples. To this purpose, density measurements were performed by using a pycnometer, in order to evaluate the density ρ of the component; afterwards, the theoretical density ρT of each mixture was calculated by using the following equation:
where:
• ρf and ρPVA are the density of the filler (measured to be 0.99 g/cm3 for the solid waste and 1.50 g/cm3 for the walnut shells) and PVA (1.19 g/cm3 from the materials technical data sheet), respectively;
• vPVA and vf are the volume fraction of PVA and fillers, respectively.
Once the theoretical density was calculated, the adimensional void fraction vv was estimated as:
Where ρ is the measured density of the different samples, obtained as the average of 10 measurements. The void fraction for the produced PVA samples obtained by the use of Equation (4) is reported in Figure 4.
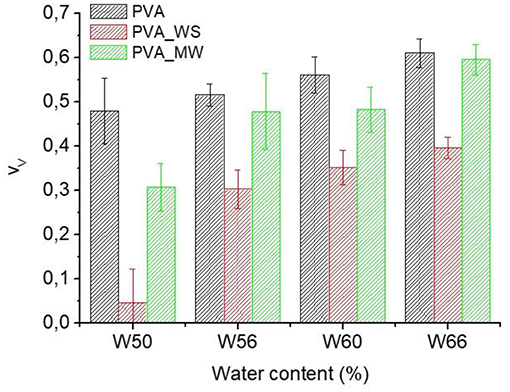
Figure 4. Void fraction for PVA samples (vv) with different amounts of water.
Also in view of the error bars reported in Figure 4, two-ways analysis of variance (ANOVA) was performed on the void fraction, considering both the type of additive and the amount of water as the sources of variation. ANOVA results are shown in Figure 5.
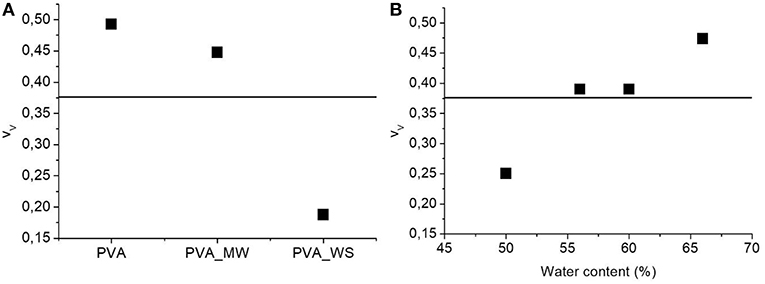
Figure 5. ANOVA results for the void fraction as function of (A) type of additive and (B) water amount.
The p-value calculated for the type of additive is 1.56*10−25, much lower than the confidence value p = 0.05, indicating the relevant effect of the type of additive on the void fraction of the materials. In particular, referring to the average value estimated over the 4 levels of water amount, and reported in Figure 5A, the void fraction of PVA is reduced upon addition of MW, and more relevantly, upon addition of WS. Referring to the results of Figure 2, the void fraction is strictly correlated to the rate of water release during heating; in facts, for neat PVA, water release is very fast, and occurs during the isothermal step at 70°C; this results in the formation of a highly porous structure, as observed in Figure 5A. For PVA_MW, showing an intermediate evaporation rate, occurring at lower temperatures, the resulting void fraction is lower than that of neat PVA. Finally, for PVA_WS, showing a slow rate of evaporation at lower temperatures, the lowest void fraction is observed in Figure 5.
The average value of void fraction estimated over the 3 levels of type of additive at each level of water amount is reported in Figure 5B, showing a void fraction increase with increasing water amount; also in this case, the behavior can be explained by considering that, with increasing water amount, an higher rate of steam is released during heating, which, being partially entrapped in the sample, causes a higher void fraction.
Flexural tests were carried out on samples with different amounts of water, with and without filler addition, as reported in Figures 6A,B, respectively.
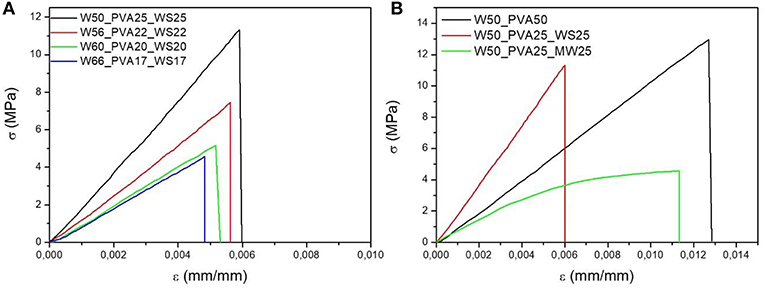
Figure 6. Stress strain curves of PVA mixtures with (A) different water content, (B) different fillers. The characteristic values of the flexural modulus, strength and strain at break as a function of water content are reported in Figures 8A–C, respectively.
Initially, data obtained for the flexural modulus were analyzed by means of two-ways ANOVA, considering the type of additive and water amount as the sources of variation (factors).
The significance of each factor was tested by calculating the F value, as the ratio of the variance between the means to the variance of the experimental error. The F value was then used in order to calculate the corresponding p-value, which was then compared with the confidence level, α = 0.05. According to ANOVA, p > α, corresponds to the null hypothesis (equivalence of the means), whereas p < α indicates that the population means are significantly different (Montgomery, 2009).
Being A and B the number of levels of Factor 1 and Factor 2, respectively, the effect of each factor was reported by estimating the Main Effects Averages (MEA) as:
Being yijn the n-th replicate obtained at factor level i and j.
The results reported in Table 3 for the p-values, in each case much lower than α = 0.05, indicate the statistically relevant effect of both type of additive and water amount on the flexural modulus.
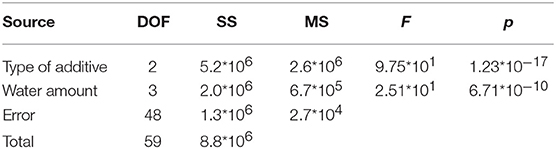
Table 3. ANOVA analysis results on experimental data of Figures 8A–C.
In particular, for each constant value of water amount, the addition of WS filler involves, an increase of the flexural modulus compared to neat PVA. In contrast, addition of MW results in a modulus decrease. This is highlighted in the ANOVA results reported in Figure 7A. Increasing the amount of water involves a decrease of the flexural modulus, as highlighted in Figure 7B. However, in this case, the water content has a different effect on the blends obtained with neat PVA, PVA_WS, and PVA_MW. In facts, for neat PVA, as reported in Figure 7A, the modulus decreases as the water amount is increased between 50 and 55%, after which it reaches a plateau value, and a further increase of water amount has no significant influence on the modulus. For the PVA_WS and PVA_MW systems, a continuous decrease of the modulus is observed as the water amount is increased between 50 and 65%.
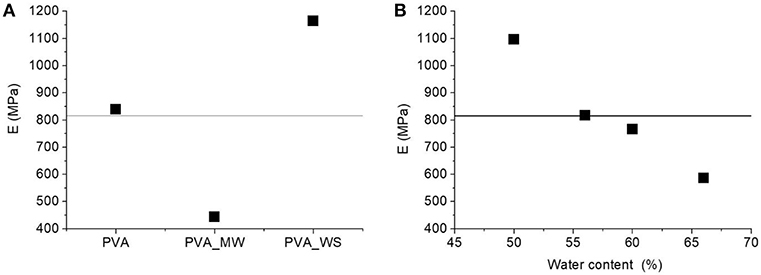
Figure 7. ANOVA analysis results: average flexural modulus as a function of: (A) type of additive and (B) water amount.
Also, the results for flexural strength were analyzed by means of ANOVA. In this case, the p-value estimated by considering the type of additive as the source of variation is p = 1.7*10−14, which indicates the statistically relevant effect of the type of additive. Referring to the results of Figure 8B for each water amount, addition of WS or MW involves a decrease of flexural strength compared to net PVA. The p-value obtained by considering the water amount as the source of variation provides p = 4.07*10−8, also indicating, according to the results of Figure 8B, a decrease of the strength as the water amount increases. However, the results for flexural strength, reported in Figure 8B, show that, as previously observed for the modulus, the strength of neat PVA decreases as the water amount is increased from 50 to 56%, but above this value further water amount increase does not involve any significant change in flexural strength. In contrast, for PVA_WS and PVA_MW, the strength continuously decreases as the water amount increases.
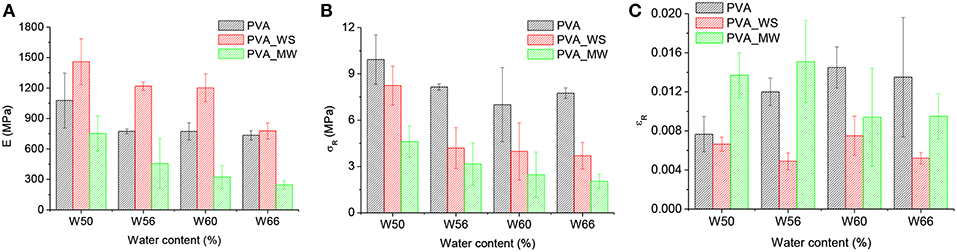
Figure 8. Flexural modulus (A), flexural strength (B), and strain at break (C), for PVA samples with different amounts of water and a constant 1:1 ratio between PVA and filler.
ANOVA performed on the strain at break, considering the type of additive as the source of variation, provides p = 2.27*10−7, which confirms, according to the results of Figure 8C, that the strain at break of PVA_WS is statistically lower than that of PVA and PVA_MW. On the other hand, when considering the water amount of the source of variation, p = 0.6 indicates that the effect of the water amount is not statistically significant.
In view of the results reported in Figures 4, 8, the flexural modulus was plotted as a function of the void fraction, and the results are reported in Figure 9. Here, the strong correlation between modulus and void fraction can be observed.
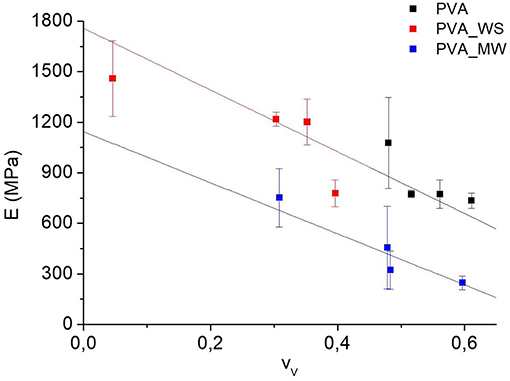
Figure 9. Flexural modulus as a function of void fraction.
Based on the correlation between flexural modulus and void fraction reported in Figure 9, the evolution of the flexural modulus or strength as a function of the void fraction can be expressed, by considering that the latter is a function of the type of additive and water amount:
Therefore, a variation in the materials properties as a function of void fraction can be explained by considering the differential form of Equation (5):
According to Equation (6), the evolution of a property as a function of the void fraction can be explained by considering the dependence of the property on the amount of water or on the type of additive . This is because, in any case, as previously discussed in Figure 4, and are both different from 0.
According to the results of Figure 9, linear fit shows that the data of PVA and PVA_WS fall on a single master curve. According to Equation (5), this indicates that the term is null. Therefore, there is no direct dependence of the flexural modulus on the type of additive; instead the type of additive influences the void fraction, which in turn has a significant effect on the flexural modulus. This means, according to the results of Figure 9, that, for the same value of the void fraction, there is no significant difference between the samples PVA and PVA_WS. The situation when considering the PVA_MW is different; in this case, the data do not fall on a single master curve, and therefore the evolution of the flexural modulus can only be explained by considering also the term , indicating that, for the same void fraction, the modulus of PVA_MW is lower than that of PVA and PVA_WS.
The situation is quite different when considering the curves for flexural strength vs. void fraction, reported in Figure 10. In this case, the data for PVA_WS and PVA_MW fall on a single master curve. This indicates that the effect of adding WS of MW has no direct influence on the flexural strength; instead, different additives have a different effect on the void fraction, which in turn involves a change in the flexural strength. Therefore, for the same value of the void fraction, the flexural strength of samples PVA_WS and PVA_MW is not significantly different. In this case, the data of neat PVA do not fall on the same master curve, which again can be explained by considering the term being different from zero. In this case, for the same void fraction, the flexural strength of PVA is higher than that of PVA_WS and PVA_MW.
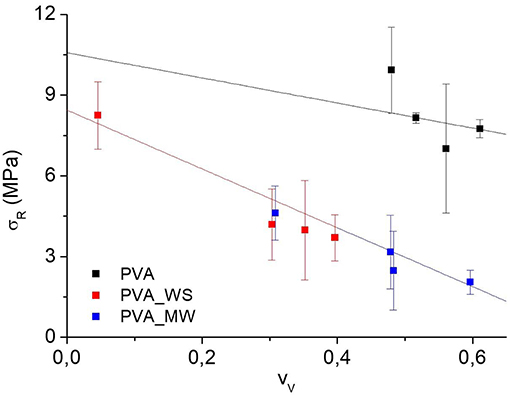
Figure 10. Flexural strength as a function of void fraction.
Figure 11 shows the microscopic images of neat PVA samples (Figure 11A), PVA with walnut shells (Figure 11B) and organic fraction of municipal solid waste (Figure 11C), obtained with a 50X magnification. As reported in Table 4, the average dimension of the pores decreases with the addition of walnut shells on PVA. On the other hand, the addition of MW involved a strong increase in the pore dimension.
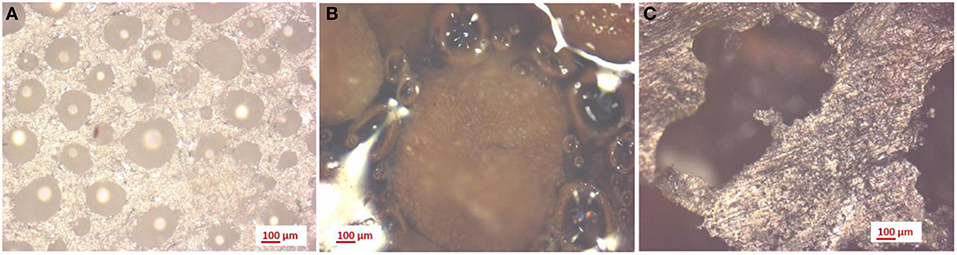
Figure 11. 50x magnification on PVA samples: (A) without additives, (B) with walnut shells, and (C) with mixed waste.
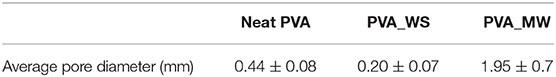
Table 4. Average pore diameter of PVA samples.
Conclusions
This work was focused on the reinforcement of PVA by the addition of natural fillers, derived from food industry wastes. In particular, the effect of a selected waste (walnut shells) and the organic fraction of municipal solid waste on PVA properties was explored. PVA samples, with and without filler addition, were produced by the use of a pressure free process, taking advantage of the water solubility of PVA.
The evolution of viscosity was then studied by rheological analysis. Although a decrease in viscosity with the increase in water content was found for all the samples, higher viscosities were achieved with PVA with walnut shells, due to its lower absorption of water. This in turn caused water release during the heating stage to occur at much lower temperatures. The release rate of water was found to deeply affect the porosity of the sample. In facts, a lower adsorption of water, causing water evaporation at lower temperatures, was found to have a beneficial effect on the reduction of porosity. Therefore, addition of food wastes caused a decrease of void fraction compared to neat PVA; however, the effect was more relevant for WS compared to MW.
The presence of voids significantly affected the mechanical response of the material. A decrease in modulus and flexural strength was detected by increasing water content, regardless of the additive addition. Furthermore, due to the lower amount of voids, PVA_WS showed an increase in stiffness compared to neat PVA. In contrast, addition of MW caused a stiffness decrease compared to neat PVA. However, this was balanced, at least for low amounts of water, by an increase of the ductility brought by the addition of MW. On the other hand, both additives caused a significant decrease of flexural strength compared to neat PVA. The experimental results obtained for PVA_WS show the potential of the developed approach for the production of PVA samples characterized by higher stiffness compared to neat PVA, as well a cost reduction and increase of the efficiency of waste management, with the reduction of its negative effects on the environment and on population.
Data Availability
The datasets generated for this study are available on request to the corresponding author.
Author Contributions
FF and RS performed the experimental measurements. CE and AG supervised the activities.
Conflict of Interest Statement
The authors declare that the research was conducted in the absence of any commercial or financial relationships that could be construed as a potential conflict of interest.
References
Abdullah, Z. W., and Dong, Y. (2019). Biodegradable and water resistant poly(vinyl) alcohol (PVA)/starch (ST)/halloysite nanotube (HNT) nanocomposite films for sustainable food packaging. Front. Mater. 6:58. doi: 10.3389/fmats.2019.00058
Cadek, M., Coleman, J. N., and Barron, V. (2002). Morphological and mechanical properties of carbon-nanotube-reinforced semicrystalline and amorphous polymer composites. Appl. Phys. Lett. 81:5123. doi: 10.1063/1.1533118
DeMerlis, C. C., and Schoneker, D. R. (2003). Review of the oral toxicity of polyvinyl alcohol (PVA). Food Chem. Toxicol. 41, 319–326. doi: 10.1016/S0278-6915(02)00258-2
Gaaz, T. S., Sulong, A. B., Akhtar, M. N., Kadhum, A. A., Mohamad, A. B., and Al-Amiery, A. A. (2015). Properties and applications of polyvinyl alcohol, halloysite nanotubes and their nanocomposites. Molecules 20, 22833–22847. doi: 10.3390/molecules201219884
Guohua, Z., Ya, L., Cuilan, F., Min, Z., Caiqiong, Z., and Zongdao, C. (2006). Water resistance, mechanical properties and biodegradability of methylated-cornstarch/poly(vinyl alcohol) blend film. Polym. Degrad. Stab. 91, 703–711. doi: 10.1016/j.polymdegradstab.2005.06.008
Li, Y., Yang, T., Yu, T., Zheng, L., and Liao, K. (2011). Synergistic effect of hybrid carbon nantube–graphene oxide as a nanofiller in enhancing the mechanical properties of PVA composites. J. Mater. Chem. 21, 10844–10851. doi: 10.1039/c1jm11359c
Limpan, N., Prodpran, T., Benjakul, S., and Prasarpran, S. (2012). Influences of degree of hydrolysis and molecular weight of poly (vinyl alcohol)(PVA) on properties of fish myofibrillar protein/PVA blend films. Food Hydrocoll. 29, 226–233. doi: 10.1016/j.foodhyd.2012.03.007
Mallakpour, S., Abdolmaleki, A., and Borandeh, S. (2014). l-Phenylalanine amino acid functionalized multi walled carbon nanotube (MWCNT) as a reinforced filler for improving mechanical and morphological properties of poly(vinyl alcohol)/MWCNT composite. Prog. Org. Coat. 77, 1966–1971. doi: 10.1016/j.porgcoat.2014.07.005
Mohanad, M., and Dong, Y. G. (2018). Elastic behavior of nanophases in polyvinyl alcohol (PVA)/bamboo charcoal (BC) nanocomposite films. Front. Mater. 5:44. doi: 10.3389/fmats.2018.00044
Montgomery, D. C. (2009). Introduction to Statistical Quality Control, 6th Edn. Hoboken, NJ: John Wiley and Sons.
Park, J.-S., Park, J.-W., and Ruckenstein, E. (2001). Thermal, and dynamic mechanical analysis of PVA/MC blend hydrogels. Polymer 42, 4271–4280. doi: 10.1016/S0032-3861(00)00768-0
Shang, S., Gan, L., Yuen, C. W. M., Jiang, S., and Luo, N. M. (2015). The synthesis of graphene nanoribbon and its reinforcing effect on poly(vinyl alcohol). Compos. Part Appl. Sci. Manuf. 68, 149–154. doi: 10.1016/j.compositesa.2014.10.011
Keywords: poly(vinyl) alcohol, mechanical properties, water content, organic waste, rheological properties
Citation: Ferrari F, Striani R, Esposito Corcione C and Greco A (2019) Valorization of Food Industries Wastes for the Production of Poly(vinyl) Alcohol (PVA) Biodegradable Composites. Front. Mater. 6:177. doi: 10.3389/fmats.2019.00177
Received: 03 June 2019; Accepted: 08 July 2019;
Published: 25 July 2019.
Edited by:
Yu Dong, School of Civil and Mechanical Engineering, Faculty of Science and Engineering, Curtin University, AustraliaReviewed by:
Philippe Boisse, Institut National des Sciences Appliquées de Lyon (INSA), FranceKunal Masania, ETH Zürich, Switzerland
Copyright © 2019 Ferrari, Striani, Esposito Corcione and Greco. This is an open-access article distributed under the terms of the Creative Commons Attribution License (CC BY). The use, distribution or reproduction in other forums is permitted, provided the original author(s) and the copyright owner(s) are credited and that the original publication in this journal is cited, in accordance with accepted academic practice. No use, distribution or reproduction is permitted which does not comply with these terms.
*Correspondence: Carola Esposito Corcione, Y2Fyb2xhLmNvcmNpb25lQHVuaXNhbGVudG8uaXQ=